. 2022 Aug;61(2):96.
doi: 10.3892/ijo.2022.5386. Epub 2022 Jul 1.

CYP11A1‑derived vitamin D hydroxyderivatives as candidates for therapy of basal and squamous cell carcinomas

Affiliations

CYP11A1‑derived vitamin D hydroxyderivatives as candidates for therapy of basal and squamous cell carcinomas

Andrzej T Slominski et al. Int J Oncol. 2022 Aug.

Abstract

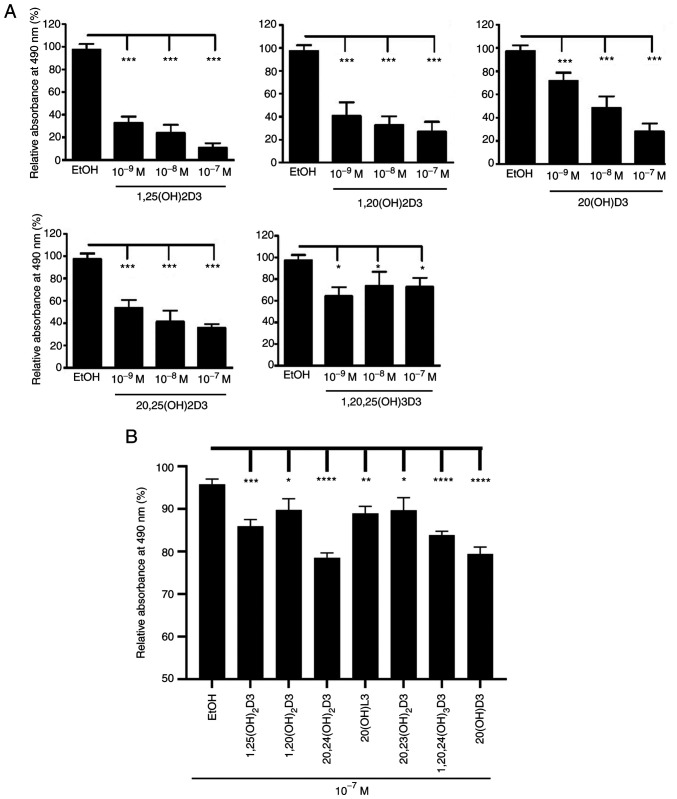
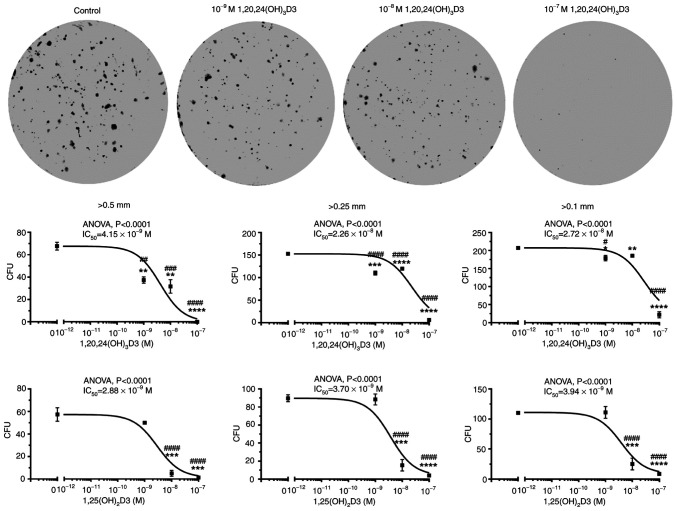
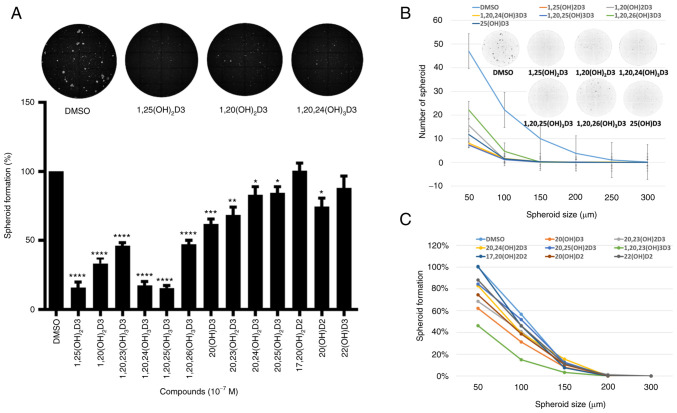
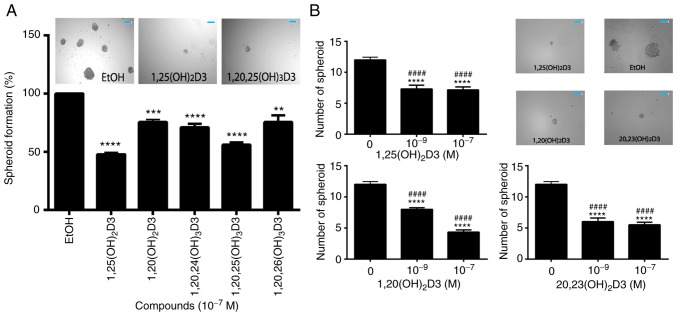
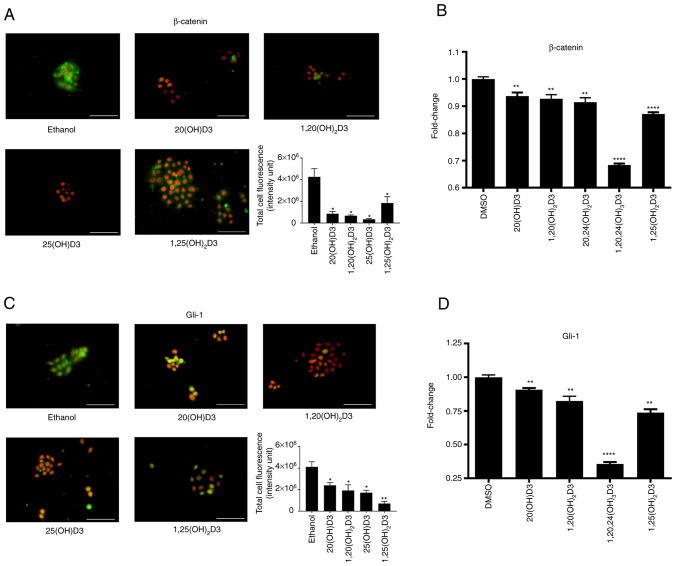
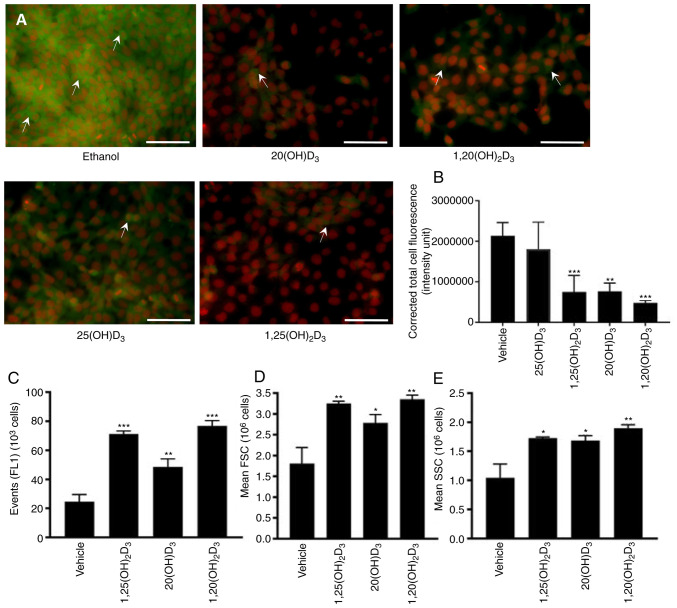
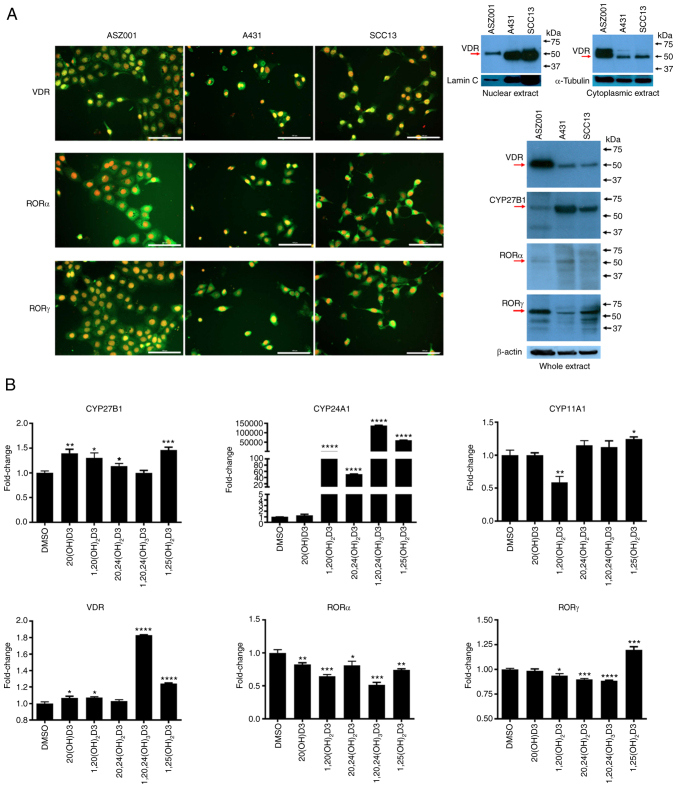
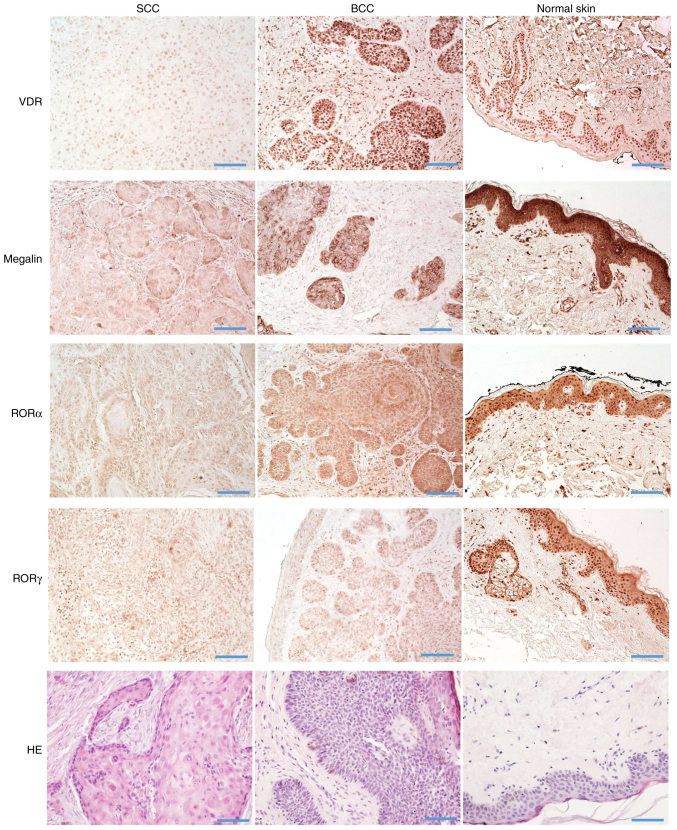
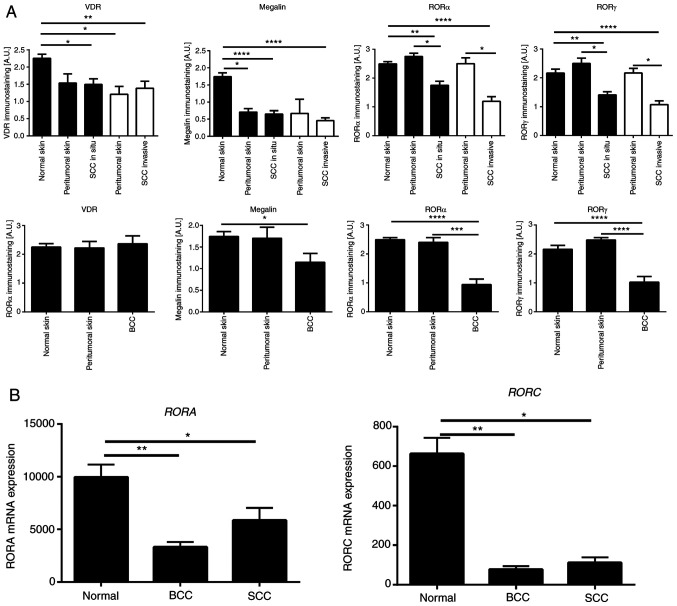
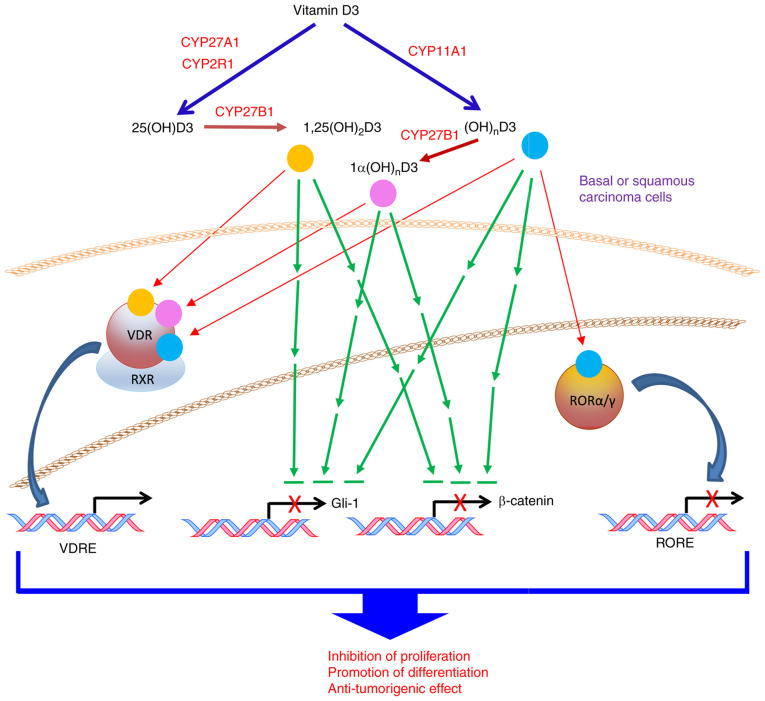
Hydroxyderivatives of vitamin D3, including classical 1,25(OH)2D3 and novel CYP11A1‑derived hydroxyderivatives, exert their biological activity by acting as agonists on the vitamin D receptor (VDR) and inverse agonists on retinoid‑related orphan receptors (ROR)α and γ. The anticancer activities of CYP11A1‑derived hydroxyderivatives were tested using cell biology, tumor biology and molecular biology methods in human A431 and SCC13 squamous (SCC)‑ and murine ASZ001 basal (BCC)‑cell carcinomas, in comparison with classical 1,25(OH)2D3. Vitamin D3‑hydroxyderivatives with or without a C1α(OH) inhibited cell proliferation in a dose‑dependent manner. While all the compounds tested had similar effects on spheroid formation by A431 and SCC13 cells, those with a C1α(OH) group were more potent in inhibiting colony and spheroid formation in the BCC line. Potent anti‑tumorigenic activity against the BCC line was exerted by 1,25(OH)2D3, 1,20(OH)2D3, 1,20,23(OH)3D3, 1,20,24(OH)3D3, 1,20,25(OH)3D3 and 1,20,26(OH)3D3, with smaller effects seen for 25(OH)D3, 20(OH)D3 and 20,23(OH)2D3. 1,25(OH)2D3, 1,20(OH)2D3 and 20(OH)D3 inhibited the expression of GLI1 and β‑catenin in ASZ001 cells. In A431 cells, these compounds also decreased the expression of GLI1 and stimulated involucrin expression. VDR, RORγ, RORα and CYP27B1 were detected in A431, SCC13 and ASZ001 lines, however, with different expression patterns. Immunohistochemistry performed on human skin with SCC and BCC showed nuclear expression of all three of these receptors, as well as megalin (transmembrane receptor for vitamin D‑binding protein), the level of which was dependent on the type of cancer and antigen tested in comparison with normal epidermis. Classical and CYP11A1‑derived vitamin D3‑derivatives exhibited anticancer‑activities on skin cancer cell lines and inhibited GLI1 and β‑catenin signaling in a manner that was dependent on the position of hydroxyl groups. The observed expression of VDR, RORγ, RORα and megalin in human SCC and BCC suggested that they might provide targets for endogenously produced or exogenously applied vitamin D hydroxyderivatives and provide excellent candidates for anti‑cancer therapy.

Keywords: basal cell carcinoma; keratinocytes; retinoid‑related orphan receptor γ; retinoid‑­related orphan receptor α; squamous cell carcinoma; vitamin D; vitamin D receptor.


Conflict of interest statement

The authors declare that they have no competing interests.

Figures

Figure 1
Figure 1
Inhibition of cell proliferation of (A) human A431 cells and (B) murine ASZ001 cells by hydroxy-derivatives of vitamin D3 in comparison with 1,25(OH)2D3 (positive) and ethanol (negative) controls. Cells were seeded in 96-well plates and treated with the listed secosteroids for 24 h and cell proliferation assessed using the MTS assay. Data are shown as means ± SEM (n=6) with ****P<0.0001; ***P<0.001; **P<0.001; *P<0.05 by (A) one way ANOVA with Dunnett's multi comparison post-hoc test or (B) Student's t-test. The concentrations of the secosteroids used are shown on the x axis.
Figure 2
Figure 2
1,20,24(OH)3D3 and 1,25(OH)2D3 inhibit colony formation by murine ASZ001 cells. Cells were plated in 6 well-plates (1,000 cells/well) and incubated with graded concentrations of the secosteroids for six days. After methanol fixation and staining with 0.1% crystal violet, the colonies sized >0.5, >0.25, >0.1 mm were counted using Cytation 5 and analyzed by Gene 5 software (BioTek Instruments, Inc.). Representative images for 1,20,24(OH)3D3 treatment are shown at the top of the Figure. Data points for the dose responses (lower panels) are shown as means ± SEM (n=3) *P<0.05, **P<0.01, ***P<0.001, ****P<0.0001 by Student's t-test; #P<0.05, ##P<0.01, ###P<0.001, ####P<0.0001 at one-way AVOVA with Dunnett's multi comparison post-hoc test. IC50 values were calculated from the non-fitted dose-response curves.
Figure 3
Figure 3
Inhibition of spheroid formation of murine ASZ001 cells by secosteroids. Cells suspended in tumerosphere medium (154CF phenol red free, 0.4% BSA, 20 ng/ml EGF, 10 ng/ml FGF, 5 µg/ml insulin) were treated with the listed secosteroids and seeded into low adhesion 24 well plates (500 cells/well) and incubated for 7 days at 37°C. (A) Spheroids ≥50 µm in size were counted using Cytation 5 (BioTek Instruments, Inc.). Representative images were taken by Cytation 5 at microscopic magnification 4× Data are shown as means ± SEM (n=6) with *P<0.05, **P<0.01, ***P<0.001, ****P<0.0001 by Student's t-test. Inhibition of spheroids formation in relation to (B) their size (means ± SD; n=6) or (C) means where SD ≤15% of the mean; n=6.
Figure 4
Figure 4
Inhibition of (A) human A431 and (B) human SCC13 cell spheroids formation by secosteroids. Cells suspended in tumerosphere medium (DMEM, 0.4% BSA, 20 ng/ml EGF, 10 ng/ml FGF, 5 ug/ml insulin) were treated with the selected secosteroids and seeded into low adhesion 96 well plates (1,000 cells/well) then incubated for 7 days at 37°C. Spheroids ≥50 um in size were counted using Cytation 5 (BioTek Instruments, Inc.). Scale bar=200 µm. Data represent means ± SEM (n=6) with **P<0.01, ***P<0.001, ****P<0.0001 by the Student's t-test in A or ####P<0.0001 at one-way AVOVA with Dunnett's multi comparison post-hoc test.
Figure 5
Figure 5
Inhibition of β-catenin and GLI1 signaling in the ASZ001 murine basal cell carcinoma cell line by vitamin D hydroxyderivatives. Cells were treated with 10−7 M of representative secosteroids in comparison with vehicle control (ethanol), for 24 h. The cells were stained with (A) murine antibodies against β-catenin (green) or (C) rabbit antibodies against GLI1 (green), or RNA was isolated for qPCR assay of (B) Ctnnb1 (gene coding β-catenin) or (D) Gli1 (gene coding Gli1) gene expression. Cell nuclei are red (counterstained with propidium iodide). Scale bar=100 µm. For protein expression the images were analyzed to calculate the corrected total cell fluorescence [CTCF=integrated density-(area of selected cell x mean fluorescence of background readings)] using ImageJ. For gene expression, data were normalized by the comparative 2−ΔΔCq method followed by calculating the fold change, using β-actin as a housekeeping gene. Data are presented as means ± SEM (n=4) with *P<0.05, **P<0.01, ****P<0.0001 by the Student's t-test.
Figure 6
Figure 6
Inhibition of GLI1 and stimulation of involucrin expression by vitamin D3 hydroxyderivatives in the A431 human carcinoma cell line. (A) Immunohistochemistry panel showing inhibition of GLI1 (green, marked by arrows) in cells treated with 10−7 M of selected secosteroids in comparison with the vehicle (ethanol) control, for 24 h. Cell nuclei are red (counterstained with propidium iodide). Scale bar=100 µm. (B) Quantification was performed as described in the legend to Fig. 5 and relative values are presented in as means ± SD (n=5) with **P<0.01, ***P<0.001 by Student's t-test. Stimulation of involucrin expression by 10−7 M of the secosteroids in comparison with the vehicle (ethanol) control. After 24 h of incubation cells were harvested, fixed in 2% PFA, stained with anti-involucrin antibody and read with a flow cytometer. Data are presented as (C) the number of positive events (FL-1 or green cells), (D) forward scatter (relative to cell size), or (E) side scatter (relative to cell granularity). Data are presented as means ± SD (n=3) with *P<0.05, **P<0.01, ***P<0.001 by the Student's t-test. Histograms (representative flow chart for each treatment) supporting evidence for the reported quantification is presented in Fig. S3.
Figure 7
Figure 7
Expression of nuclear receptors for vitamin D3 hydroxyderivatives and CYP enzymes involved in vitamin D metabolism in murine ASZ001, human A431 and human SCC13 carcinoma lines. (A) Immunofluorescence detection (left panel) was performed using antibodies against VDR (MA1-710) and RORα and RORγ (54). The antigen is in green, while cell nuclei are red-counterstained with propidium iodide; scale bar=100 µm. Right panel shows detection of VDR and RORα and RORγ by western blotting (arrows) using specific anti-receptor antibodies (see Materials and methods) for isolated cytoplasmic or nuclear fractions (VDR) from the cells or whole extracts (CYP27B1, RORα and RORγ). Human hepatoma and human melanoma SKMEL-188 cells were used as positive controls for RORα and RORγ. Loading was evaluated using antibodies against lamin C and α-tubulin for nuclear or cytoplasmic fractions, respectively, while with anti-β-actin for whole extracts. (B) shows expression at the mRNA level of Cyp27b1, Cyp24a1, Cyp11a1, Vdr, Rora and Rorc, respectively in ASZ001 murine carcinoma line treated with 10−7 M of the secosteroids listed on the x-axis. Data represent fold change, using β-actin as a housekeeping gene and are shown as means ± SEM (n=4) with *P<0.05, **P<0.01, ***P<0.001, ****P<0.0001 by Student's t-test. ROR, retinoid-related orphan receptor; VDR, vitamin D receptor.
Figure 8
Figure 8
Immunohistochemical detection of VDR, RORα, RORγ, megalin and hematoxylin and eosin stained sections of human SCC (left column), BCC (middle column) and normal skin (right column) on archival formalin-fixed paraffin-embedded sections. Scale bar=100 µm. Immunohistochemistry was performed on the on archival formalin-fixed paraffin-embedded sections. The methodology for IHC is described in the Materials and methods and with flow chart in Fig. S2. SCC, squamous cell carcinomas; BCC, basal cell carcinomas.
Figure 9
Figure 9
Quantitative analysis of nuclear receptor expression in SCC and BCC. (A) Quantitative comparison of immunostaining of VDR, RORα, RORγ and megalin in SCC (n=14), SCC in situ (n=22), BCC (n=12), normal (n=35) and peritumoral skin samples. Data are presented as mean values ± SD. Statistically significant differences were determined with ANOVA followed by Dunn's multiple comparisons test with *P<0.05, **P<0.01, with ***P<0.001, ****P<0.0001. The immunohistochemical stained archival formalin-fixed paraffin-embedded sections were used for quantifications as described in the Materials and methods. (B) Quantitative comparison of mRNA expression of RORA (probe 226682_at) and RORC (probe 228806_at) in SCC (n=11), BCC (n=15) and normal skin (n=4) was performed using data from the genomic repository (Gene Expression Omnibus, accession number GSE7553 http://www.ncbi.nlm.nih.gov/geo). Data are shown as means ± SD. Statistically significant differences were determined with the ANOVA followed by Dunn's multiple comparisons test with *P<0.05, **P<0.01. SCC, squamous cell carcinomas; BCC, basal cell carcinomas; ROR, retinoid-related orphan receptor; VDR, vitamin D receptor.
Figure 10
Figure 10
Proposed mechanism of action of novel vitamin D3 hydroxyderivatives. ROR, retinoid-related orphan receptor; VDR, vitamin D receptor.

References

    1. Slominski AT, Zmijewski MA, Plonka PM, Szaflarski JP, Paus R. How UV light touches the brain and endocrine system through skin, and why. Endocrinology. 2018;159:1992–2007. doi: 10.1210/en.2017-03230. - DOI - PMC - PubMed
    1. Brash DE. UV signature mutations. Photochem Photobiol. 2015;91:15–26. doi: 10.1111/php.12377. - DOI - PMC - PubMed
    1. Wondrak GT. Let the sun shine in: Mechanisms and potential for therapeutics in skin photodamage. Curr Opin Investig Drugs. 2007;8:390–400. - PubMed
    1. D'Orazio J, Jarrett S, Amaro-Ortiz A, Scott T. UV radiation and the skin. Int J Mol Sci. 2013;14:12222–12248. doi: 10.3390/ijms140612222. - DOI - PMC - PubMed
    1. Bickers DR, Athar M. Oxidative stress in the pathogenesis of skin disease. J Invest Dermatol. 2006;126:2565–2575. doi: 10.1038/sj.jid.5700340. - DOI - PubMed

MeSH terms