. 2022 Jul 1;132(13):e156994.
doi: 10.1172/JCI156994.

Lymph node fibroblastic reticular cells preserve a tolerogenic niche in allograft transplantation through laminin α4

Affiliations

Lymph node fibroblastic reticular cells preserve a tolerogenic niche in allograft transplantation through laminin α4

Lushen Li et al. J Clin Invest. .

Abstract

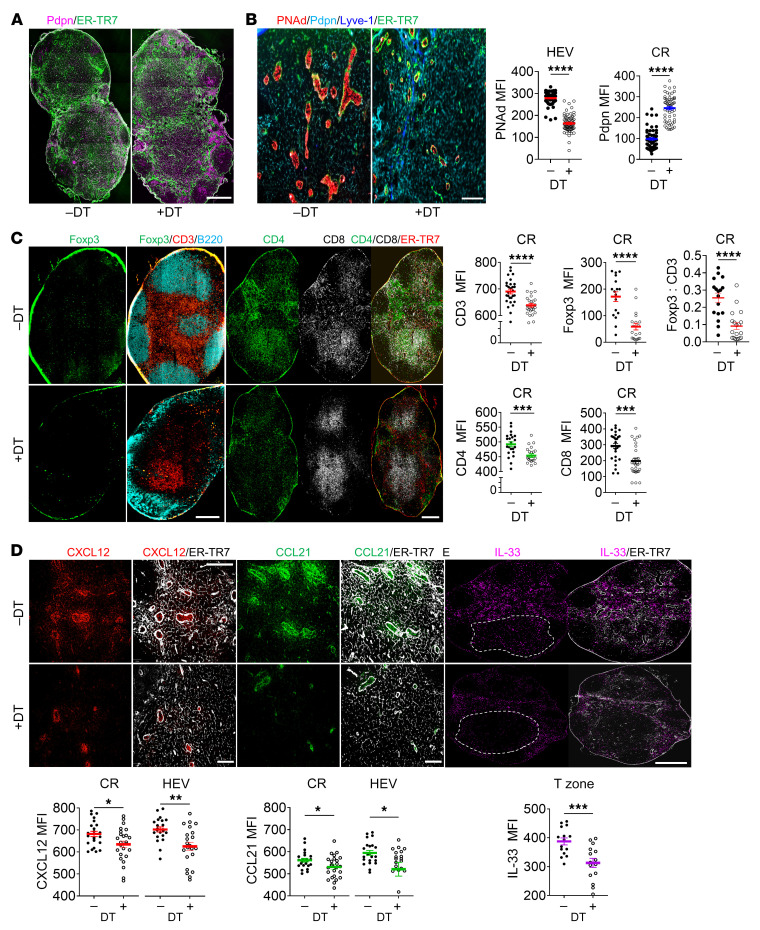
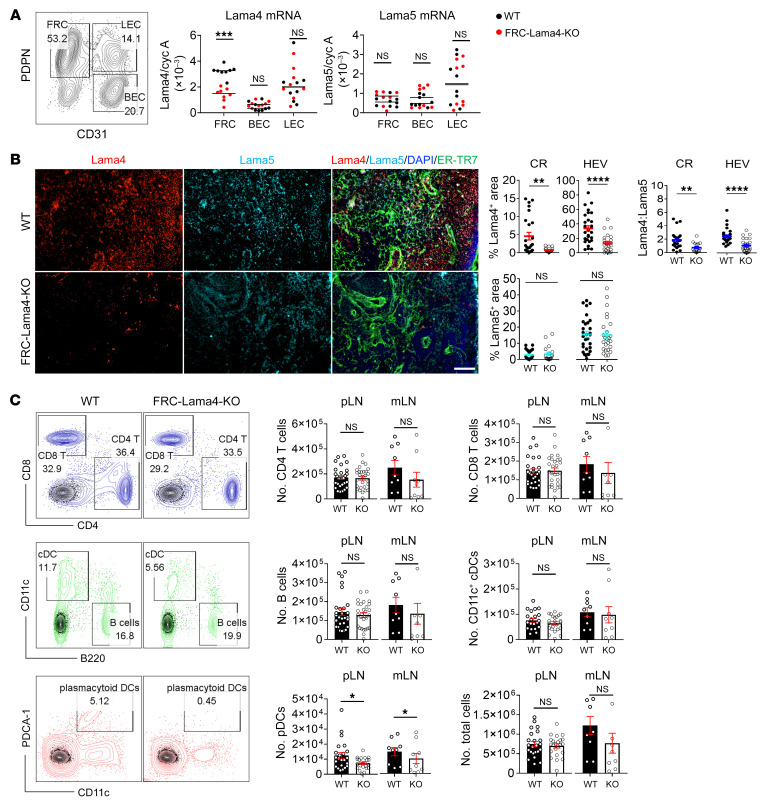
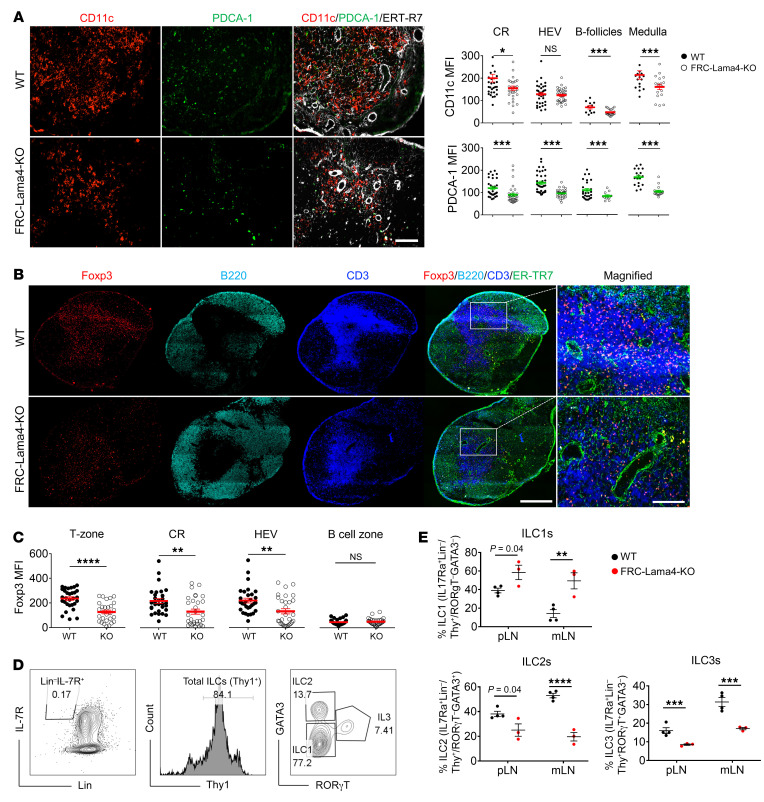
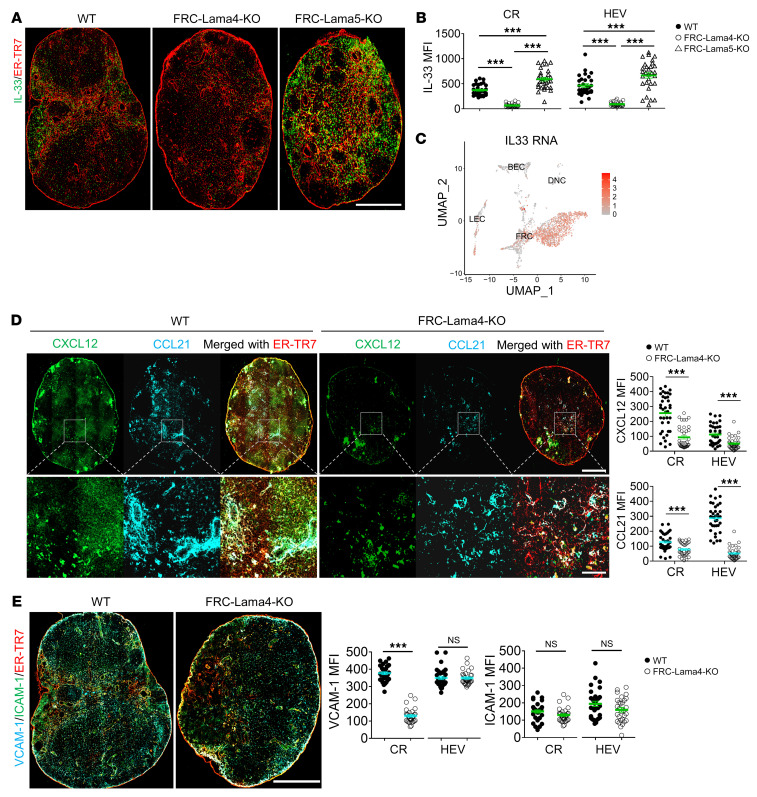
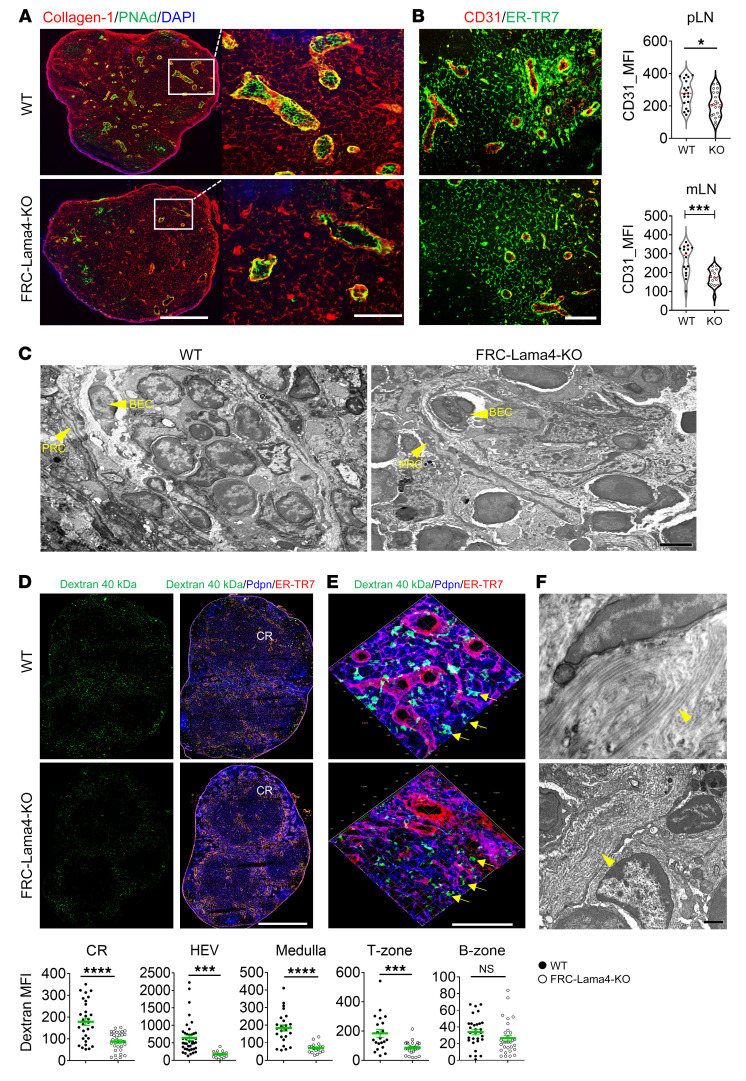
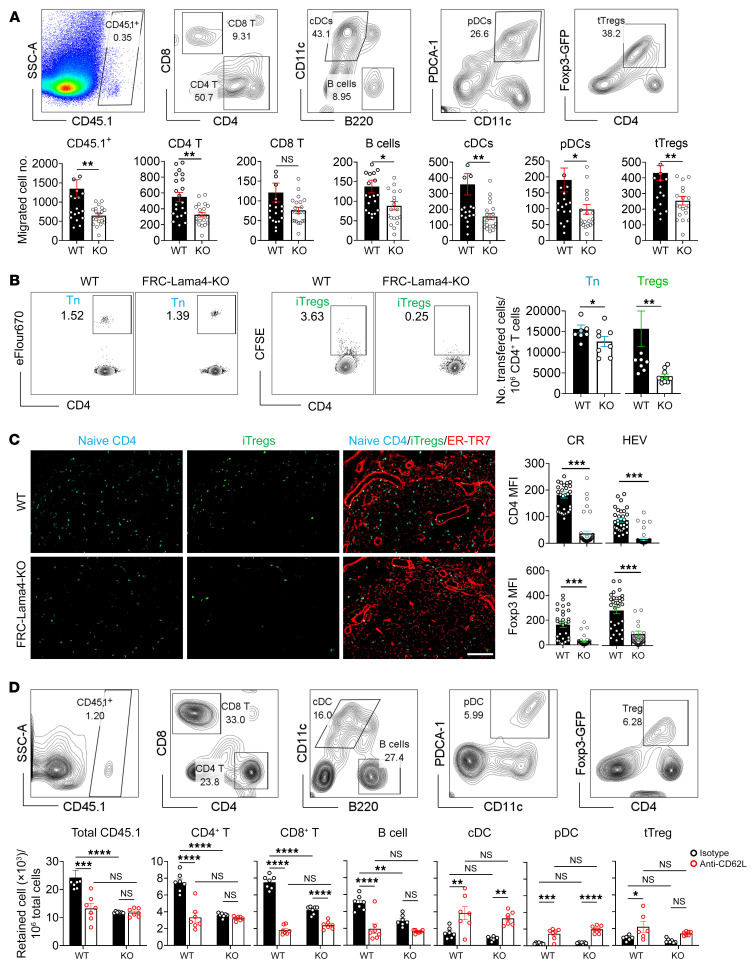
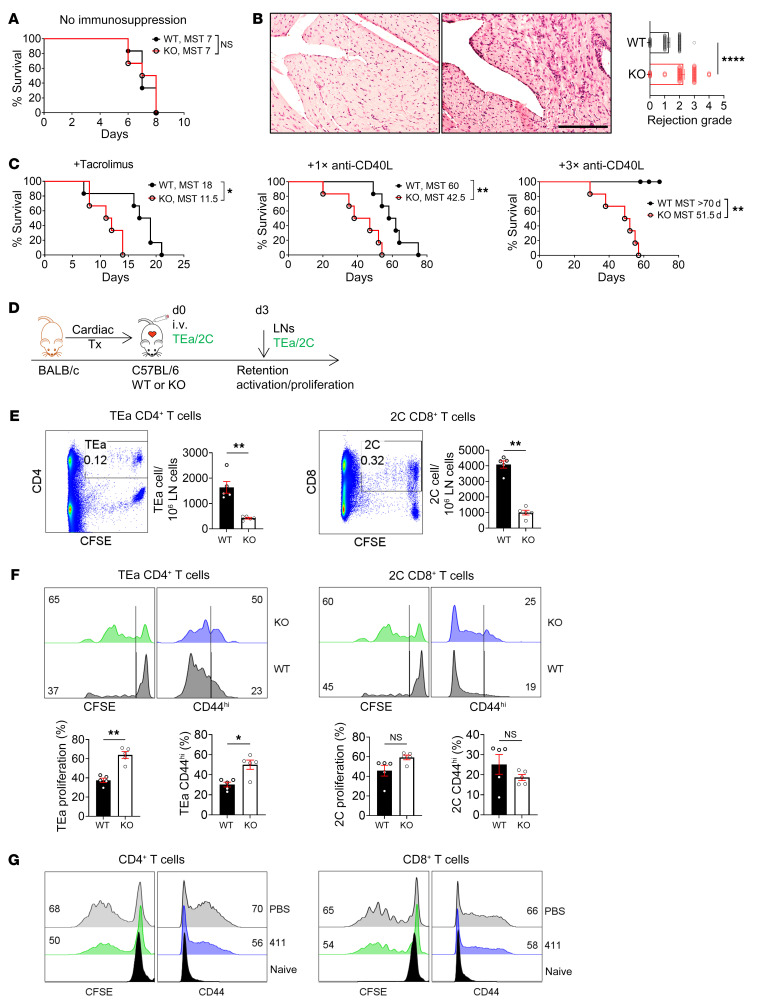
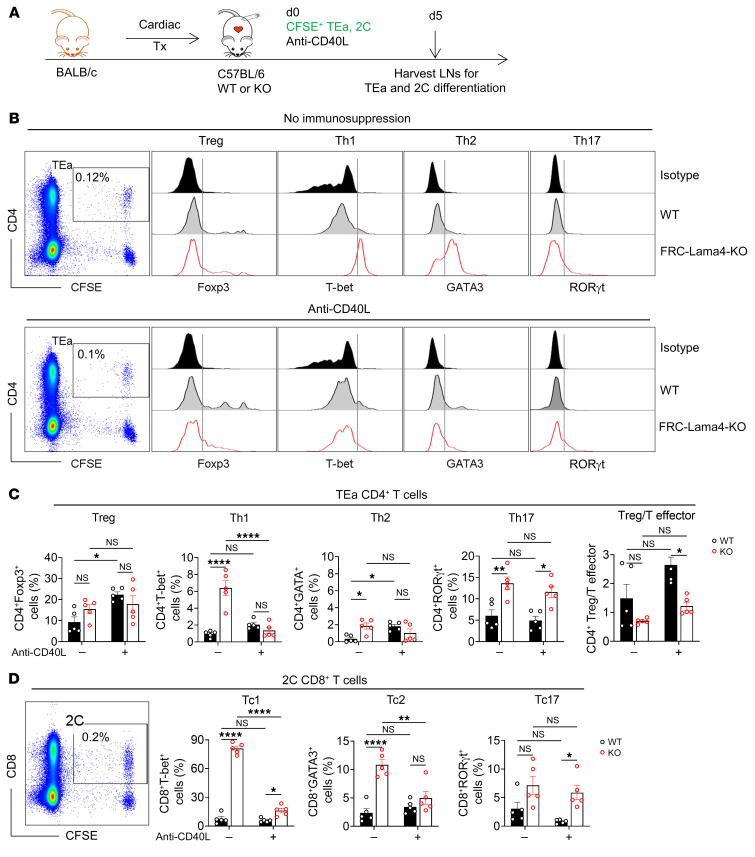
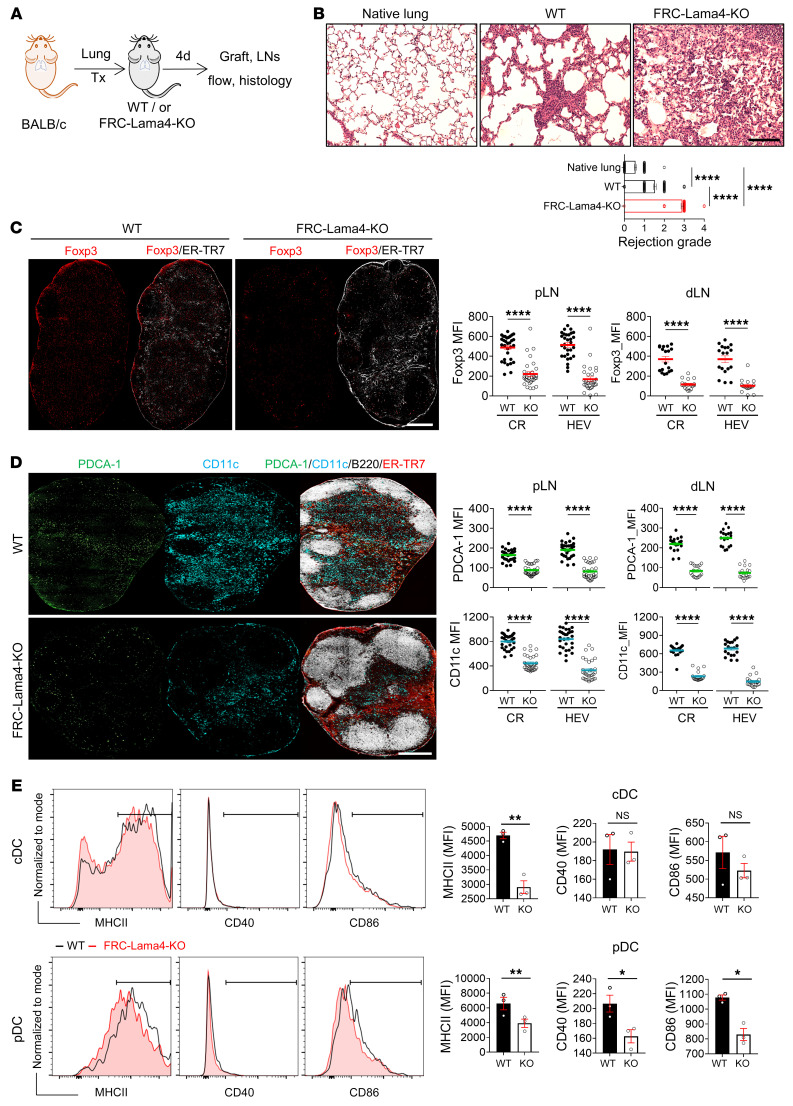
Lymph node (LN) fibroblastic reticular cells (FRCs) define LN niches and regulate lymphocyte homeostasis through producing diverse extracellular matrix (ECM) components. We examined the role of ECM laminin α4 (Lama4) using FRC-Lama4 conditional KO Pdgfrb-Cre-/- × Lama4fl/fl mice. Single-cell RNA-sequencing (scRNA-Seq) data showed the promoter gene Pdgfrb was exclusively expressed in FRCs. Depleting FRC-Lama4 reduced Tregs and dendritic cells, decreased high endothelial venules, impaired the conduit system, and downregulated T cell survival factors in LNs. FRC-Lama4 depletion impaired the homing of lymphocytes to LNs in homeostasis and after allografting. Alloantigen-specific T cells proliferated, were activated to greater degrees in LNs lacking FRC-Lama4, and were more prone to differentiate into effector phenotypes relative to the Treg phenotype. In murine cardiac transplantation, tolerogenic immunosuppression was not effective in FRC-Lama4 recipients, which produced more alloantibodies than WT. After lung transplantation, FRC-Lama4-KO mice had more severe graft rejection with fewer Tregs in their LNs. Overall, FRC-Lama4 critically contributes to a tolerogenic LN niche by supporting T cell migration, constraining T cell activation and proliferation, and promoting Treg differentiation. Hence, it serves as a therapeutic target for immunoengineering.

Keywords: Adaptive immunity; Cell Biology; Laminin; T cell development; Transplantation.


Conflict of interest statement

Conflict of interest: The authors have declared that no conflict of interest exists.

Figures

Figure 1
Figure 1. FRCs support LN structure and cellularity.
To deplete FRCs, CCL19/iDTR mice were treated with DT (i.p. 100 ng/d × 5 days). (A and B) Whole-mount scanning (A) and fluorescent images (B) of LN cryosections stained for ER-TR7, Pdpn, PNAd, and Lyve-1. Original magnification, ×20. Scale bars: 500 μm (A); 100 μm (B). Quantification of PNAd intensity in HEV areas and Pdpn intensity in CR. (C) Whole-mount scanning of LN cryosections stained for Foxp3, CD3, B220, CD4, CD8, and ER-TR7. Original magnification, ×20. Scale bars: 500 μm. Quantification of CD3, Foxp3, CD4, and CD8 intensity, and Foxp3/CD3 ratio in CR. (D) Representative fluorescent images of LN cryosections stained for CXCL12, CCL21, and ER-TR7. Scale bars: 100 μm. Quantification of intensity in CR and around HEVs. (E) Whole-mount scanning of LN cryosections stained for IL-33 and ER-TR7. Scale bar: 500 μm. Quantification of intensity in T-zone. (AE) Three independent experiments, 3 mice/group, 3 LNs/mouse, 3 sections/LN, 3 to 5 fields/section. Student’s unpaired, 2-tailed t test for 2-group comparisons. Data are represented as mean ± SEM. *P < 0.05; **P < 0.01; ***P < 0.001; ****P < 0.0001. P < 0.05 was considered significant.
Figure 2
Figure 2. FRC-Lama4 conditional KO mouse construction and characterization.
(A) Gating strategy for sorting FRCs, BECs, and LECs (left); values show percentages. Lama4 and Lama5 mRNA relative to cyclophilin A in FRCs, BECs, and LECs from FRC-Lama4–KO and littermate control (WT) LNs (right, qRT-PCR). (B) Lama4 and Lama5 protein in FRC-Lama4–KO and WT LNs. Representative images of LN cryosections stained for Lama4, Lama5, and ER-TR7. Original magnification, ×20. Scale bar: 100 μm. Quantification of Lama4- and Lama5-positive area percentages and Lama4/Lama5 ratios in the CR and around HEV. (C) Cellularity in FRC-Lama4–KO and WT LNs. Left: gating strategies for CD4+ T cells, CD8+ T cells, B cells, cDCs, and pDCs in WT LNs; values show percentage. Right: number of cells in each LN. Three independent experiments, 3 mice/group, 3 LNs/mouse, 3 sections/LN, and 3 to 5 fields/section. Student’s unpaired 2-tailed t test for 2-group comparisons. Data are represented as mean ± SEM. *P < 0.05; **P < 0.01; ***P < 0.001; ****P < 0.0001. P < 0.05 was considered significant.
Figure 3
Figure 3. FRC-Lama4 depletion coincides with decreased DCs and Tregs and altered ILCs.
(A) Fluorescent images of FRC-Lama4–KO and WT LN cryosections stained for CD11c, PDCA1, and ER-TR7. Original magnification, ×20. Scale bar: 100 μm. Quantification of CD11c and PDCA-1 intensity in indicated LN regions. (B) Whole-mount scanning of LN cryosections from FRC-Lama4–KO and WT mice, stained for Foxp3, B220, CD3, and ER-TR7. Original magnification, ×20. Scale bars: 500 μm (left); 100 μm (right). (C) Quantification of Foxp3 intensity in indicated LN regions. (D and E) Gating strategy (D) (values show percentages) and quantification (E) of ILC subsets in LNs. Representative of 3 independent experiments. (AE) Three independent experiments, 3 mice/group, 3 LNs/mouse, 3 sections/LN, and 3-5 fields/section. Student’s unpaired, 2-tailed t test for 2-group comparisons. Data are represented as mean ± SEM. *P < 0.05; **P < 0.01; ***P < 0.001; ****P < 0.0001. P < 0.05 was considered significant.
Figure 4
Figure 4. FRC-Lama4 depletion impairs chemokine and cytokine production.
(A) Whole-mount scanning of FRC-Lama4–KO, FRC-Lama5-KO, and WT mouse LN cryosections stained for IL-33 and ER-TR7. Original magnification, ×20. Scale bar: 500 μm. (B) Quantification of IL-33 intensity in LN CR and around HEVs. (C) IL-33 gene expression in LNSCs measured by scRNA-seq. (D) Whole-mount scanning of FRC-Lama4–KO and WT LN cryosections stained for CXCL12 and CCL21. Original magnification, ×20. Scale bars: 500 μm (upper); 100 μm (lower). Quantification of CXCL12 and CCL21 in LN CR and around HEVs. (E) Whole-mount scanning of FRC-Lama4–KO and WT LN cryosections stained for VCAM-1 and ICAM-1. Original magnification, ×20. Scale bar: 500 μm. Quantification of VCAM-1 and ICAM-1 in CR and around HEV. Representative of 3 independent experiments with 3 mice/group, 3 LNs/mouse, 3 sections/LN, and 3 to 5 fields/section. One-way ANOVA with Tukey’s multiple comparisons test for multiple group comparison (B). Student’s unpaired, 2-tailed t test for 2-group comparisons (D and E). Data are represented as mean ± SEM. ***P < 0.001. P < 0.05 was considered significant.
Figure 5
Figure 5. FRC-Lama4 depletion impairs LN vasculature.
(A) Whole-mount scanning of FRC-Lama4–KO and WT LN cryosections stained for collagen 1, PNAd, and DAPI. Original magnification, ×20. Scale bars: 500 μm (left); 100 μm (right). (B) Representative fluorescent images of LN cryosections stained for ER-TR7 and CD31. Scale bar: 100 μm. Quantification of CD31 in HEV areas of pLNs and mLNs. (C) TEM images showing HEVs in WT and FRC-Lama4–KO mouse LNs (longitudinal section). Original magnification, ×1100. Scale bar: 2 μm. (D and E) FRC-Lama4–KO and WT mice injected s.c. with 40 kDa dextran-FITC; draining inguinal LNs harvested 5 minutes later. Whole-mount scanning of LN cryosections stained for ER-TR7 and Pdpn. Original magnification, ×20. Scale bars: 500 μm. Quantification of dextran in various LN regions. (E) 3D confocal images of CR; arrows indicate conduits. Original magnification, ×40. Scale bar: 100 μm. (F) TEM images of WT and FRC-Lama4–KO mouse LNs (longitudinal section; arrowheads show collagen fibers). Original magnification, ×6500. Scale bar: 500 nm. Representative of 3 independent experiments with 3 mice/group, 3 LNs/mouse, 3 sections/LN, and 3 to 5 fields/section. Student’s unpaired, 2-tailed t test for 2-group comparisons. Data are represented as mean ± SEM. *P < 0.05; ***P < 0.001; ****P < 0.0001. P < 0.05 was considered significant.
Figure 6
Figure 6. FRC-Lama4 depletion affects lymphocyte entry into LNs.
(A) 107 CD45.1+ splenocytes transferred i.v. into CD45.2+ WT and FRC-Lama4–KO recipients. After 1 hour, LNs were harvested and total migrated CD45.1+ cells, and CD45.1+ CD4+ T, CD8+ T cells, B cells, cDCs, pDCs, and Foxp3-GFP+ tTregs were counted in each LN. Gating strategy (upper) and data summary (lower) of migrated cells. (B and C) 2 × 10⁶ CFSE+ iTregs and 2 × 10⁶ eFlour 670+ CD4+ T cells transferred i.v. to FRC-Lama4–KO and WT mice. After 16 hours, LNs were harvested and transferred cells measured. (B) Flow cytometry gating strategy (left, values show percentage); number of transferred naive CD4+ T cells and iTregs relative to 106 total CD4+ T cells in LNs. (C) LN cryosections for CD4+ and iTregs and ER-TR7. Original magnification, ×20. Scale bar: 100 μm. Quantification of naive CD4+ T cells and iTregs in CR and HEV. (D) 107 CD45.1+ splenocytes transferred i.v. into CD45.2+ WT and FRC-Lama4–KO recipients. Eighteen hours later, recipients received 100 μg anti-CD62L mAb or isotype i.v. After an additional 18 hours, transferred cells in LNs were analyzed. Gating strategy (upper) and data summary (lower) of migrated cell frequency in recipient LNs. (AD) Values in gating strategy show percentages. Representative of 3 independent experiments with 3 mice/group, 5 LNs/mouse, 3 sections/LN, and 3 to 5 fields/section. Student’s unpaired 2-tailed t test for 2-group comparisons. Two-way ANOVA with multiple comparisons test. Data are represented as mean ± SEM. *P < 0.05; **P < 0.01; ***P < 0.001; ****P < 0.0001. P < 0.05 was considered significant.
Figure 7
Figure 7. Ablation of FRC-Lama4 promotes T cell alloimmunity.
(AC) C57BL/6 WT and FRC-Lama4–KO received BALB/c cardiac allografts. Allograft survival (A) without immune suppression or (C) with tacrolimus (2 mg/kg/day s.c.), 1 dose (1×, 250 μg, i.v. day 0), or 3 doses (3×, 250 μg/dose, i.v. days 0, 4, 7) of anti-CD40L mAb; log-rank (Mantel-Cox) test for graft survival, median survival time (MST), 6 mice/group. (B) H&E staining of heart grafts in WT (left) and FRC-Lama4-KO recipient mice (right) 3 days after transplantation, and rejection grade. Scale bar: 100 μm. (DF) (D) Schematic of cardiac transplantation with adoptive transfer of alloantigen-specific TEa CD4+ and 2C CD8+ cells. CFSE-stained TEa plus 2C cells (each 2 × 10⁶) injected i. v. into WT and FRC-Lama4–KO recipients on day 0. Recipient LNs harvested on day 3 to assess TEa and 2C cell numbers and responses. (E) Number, (F) proliferation, and CD44 expression at day 3. (G) CFSE+, CD4+, and CD8+ T cells cocultured with coated laminin 411 (2 μg/mL) or PBS and activated by coated CD3 mAb (5 μg/mL) and soluble CD28 mAb (1 μg/mL). CFSE and CD44 analyzed 3 days after activation. (EG) Values show percentage. Data representative of 3 independent experiments; 3 mice/group. (B, E, and F) Student’s unpaired 2-tailed t test for 2-group comparisons. Data are represented as mean ± SEM. *P < 0.05; **P < 0.01; ****P < 0.0001. P < 0.05 was considered significant.
Figure 8
Figure 8. FRC-Lama4 regulates Treg versus T effector balance in cardiac transplants.
(A) Schematic of cardiac transplantation with immunosuppression and transfer of alloantigen-specific, TCR Tg TEa CD4+ T cells and 2C CD8+ T cells. On day 0, CFSE-stained TEa plus 2C cells (2 × 10⁶ each) with or without 250 μg anti-CD40L injected i.v. to WT or FRC-Lama4–KO recipients. LNs harvested on day 5 to assess TEa and 2C cell differentiation. (B) Representative gating of TEa CD4+ T cells and differentiation to Foxp3+Treg, T-bet+Th1, GATA3+Th2, and RORγt+Th17 cells from Foxp3 TEa cells. (C) Data summary of TEa differentiation and ratio of Treg/T effector cells (D) Gating of 2C cells and data summary of 2C differentiation (gating of T-bet+Tc1, GATA3+Tc2, and RORγt+Tc17 cells same as TEa effector cells in B). Data are representative of 3 independent experiments; 3 mice/group. Two-way ANOVA with multiple comparisons test for multiple comparisons of each group. Data are represented as mean ± SEM. *P < 0.05; **P < 0.01; ****P < 0.0001. P < 0.05 was considered significant.
Figure 9
Figure 9. FRC-Lama4 regulates alloreactivity in lung transplants.
(A) Schematic of lung transplantation. BALB/c donors, C57BL/6 WT, or FRC-Lama4–KO recipients. Grafts and LNs harvested 4 days after transplantation. (B) H&E staining of native lung from BALB/c mice, lung grafts in WT and FRC-Lama4–KO recipients. Scale bar: 100 μm. Evaluation of rejection grade. (C) Whole-mount scanning of recipient pLN cryosections stained for Foxp3 and ER-TR7. Original magnification, ×20. Scale bar: 500 μm. Quantification of Foxp3 intensity in CR and around HEVs in recipient pLNs and lung dLNs. (D) Whole-mount scanning of recipient pLN cryosections stained for PDCA-1, CD11c, ER-TR7, and B220. Original magnification, ×20. Scale bar: 500 μm. Quantification of PDCA-1 and CD11c intensity in CR and around HEVs in recipient pLNs and lung dLNs. (E) Gating and summary of MHCII, CD40, and CD86 on cDCs and pDCs in WT and FRC-Lama4–KO recipient pLNs. (E) Representative of 2 independent experiments with 3 mice/group, 3 LNs/mouse, 3 sections/LN, 3 to 5 fields/section. Student’s unpaired, 2-tailed t test for 2-group comparisons. Data are represented as mean ± SEM. *P < 0.05; **P < 0.01; ****P < 0.0001. P < 0.05 was considered significant.

References

    1. Fletcher AL, et al. Reproducible isolation of lymph node stromal cells reveals site-dependent differences in fibroblastic reticular cells. Front Immunol. 2011;2:1–15. - PMC - PubMed
    1. Malhotra D, et al. Transcriptional profiling of stroma from inflamed and resting lymph nodes defines immunological hallmarks. Nat Immunol. 2012;13(5):499–510. doi: 10.1038/ni.2262. - DOI - PMC - PubMed
    1. Malhotra D, et al. Stromal and hematopoietic cells in secondary lymphoid organs: partners in immunity. Immunol Rev. 2013;251(1):160–176. doi: 10.1111/imr.12023. - DOI - PMC - PubMed
    1. Roulois D, et al. Follicular lymphoma triggers phenotypic and functional remodeling of the human lymphoid stromal cell landscape Article Follicular lymphoma triggers phenotypic and functional remodeling of the human lymphoid stromal cell landscape. Immunity. 2021;54(8):1788–1806. doi: 10.1016/j.immuni.2021.05.019. - DOI - PubMed
    1. Rodda LB, et al. Single-Cell RNA sequencing of lymph node stromal cells reveals niche-associated heterogeneity. Immunity. 2018;48(5):1014–1028. doi: 10.1016/j.immuni.2018.04.006. - DOI - PMC - PubMed

Publication types