. 2022 Jul 1;132(13):e151666.
doi: 10.1172/JCI151666.

Reversal of viral and epigenetic HLA class I repression in Merkel cell carcinoma

Affiliations

Reversal of viral and epigenetic HLA class I repression in Merkel cell carcinoma

Patrick C Lee et al. J Clin Invest. .

Abstract

Cancers avoid immune surveillance through an array of mechanisms, including perturbation of HLA class I antigen presentation. Merkel cell carcinoma (MCC) is an aggressive, HLA-I-low, neuroendocrine carcinoma of the skin often caused by the Merkel cell polyomavirus (MCPyV). Through the characterization of 11 newly generated MCC patient-derived cell lines, we identified transcriptional suppression of several class I antigen presentation genes. To systematically identify regulators of HLA-I loss in MCC, we performed parallel, genome-scale, gain- and loss-of-function screens in a patient-derived MCPyV-positive cell line and identified MYCL and the non-canonical Polycomb repressive complex 1.1 (PRC1.1) as HLA-I repressors. We observed physical interaction of MYCL with the MCPyV small T viral antigen, supporting a mechanism of virally mediated HLA-I suppression. We further identify the PRC1.1 component USP7 as a pharmacologic target to restore HLA-I expression in MCC.

Keywords: MHC class 1; Oncology; Proteomics; Skin cancer.


Figures

Figure 1
Figure 1. Generation of patient-derived MCC lines that exhibit classic MCC features and recapitulate the low HLA-I expression of their corresponding tumors.
(A) IHC of 2 MCC lines stained for MCC markers SOX2 and CK20 (original magnification, ×20). (B) CoMut plot displaying the top 50 most frequently mutated genes across 7 MCC tumor and cell line pairs. (C) Unsupervised hierarchical clustering of RNA-Seq data from 9 MCC patient tumors and corresponding cell lines. Heatmaps were constructed using a distance matrix on variance-stabilizing (VS) transformed expression values. Top track: Quantification of transcript reads mapping to the MCPyV genome. (D) HLA-I flow cytometry in 11 MCC lines, both at baseline (pink bars) and in response to IFN-γ (red bars), compared with isotype control (white bars). The black line plot indicates the percentage of tumor cells positive for HLA-I by IHC of the original tumor. (E) IHC of MCC tumor archival samples. Left: Summary of the percentage of MCC cells that are HLA-I positive within available pretreatment (n = 6) and post-treatment (n = 9) tumor samples (see Table 1 for prior treatments). MCC cell lines were derived from post-treatment samples. Right: Representative IHC images of 2 HLA-I–low tumors, MCC-301 and MCC-336, stained for HLA class I (brown) with SOX2 costain (red) to identify MCC cells. Lymphocytes and endothelial cells served as internal controls that are SOX2 negative and HLA-I positive. Scale bar: 50 μm.
Figure 2
Figure 2. Transcriptional repression of multiple class I pathway genes and NLRC5 alterations underlie the loss of HLA-I surface expression in the panel of MCC lines.
(A) RNA-Seq heatmaps of class I antigen presentation gene expression. Middle heatmap: Unsupervised clustering by Euclidean distance of the MCC cell line panel, with and without IFN-γ treatment. Left: Reference heatmap of MCC lines MKL-1 and WaGa. Right: Reference heatmap of epidermal keratinocytes and dermal fibroblasts. (B) Unsupervised clustering by Euclidian distance of protein expression values for class I genes, with and without IFN-γ treatment. (C) scRNA-Seq data from MCC-336 (MCPyV+) and MCC-350 (MCPyV) fresh tumor samples. Right panel: UMAP (uniform manifold approximation and projection) visualization of all cells is displayed, colored by cluster (left) and by sample (right). Left panel: Expression levels of HLA-A, -B, and -C and B2M across all clusters (clusters 0–5, MCC cells; cluster 6, immune cells). (D) log2 copy number ratios for class I genes (left) and for chromosome 16 (right), where NLRC5 is located.
Figure 3
Figure 3. IFN-γ increases and alters the HLA peptidome in MCC.
(A) Number of detected peptides presented on HLA-I in MCC lines at baseline (gray bars) and after IFN-γ treatment (red bars). CL, cell line. (B) Correlation heatmap of peptide sequences between MCC lines at baseline and after IFN-γ treatment in motif space. (C) 9-mer motif changes between untreated and IFN-γ–treated samples for MCC-290 (MCPyV) and MCC-301 (MCPyV+) cell lines. (D) HLA allele distribution of presented peptides detected in cell lines at baseline and after IFN-γ treatment. Each HLA allele is represented by a different color. (E) Summary of changes in peptides presented per HLA gene upon IFN-γ treatment across all MCC lines analyzed for HLA-A (left), -B (middle), and -C (right). (F) Mass spectrum of a detected HLA-A–presented peptide derived from the MCPyV large T antigen (LT) in MCC-367. Red, blue, and green peaks represent y-, b-, and internal ions, respectively, confirming the peptide sequence. Internal ions are labeled with their respective amino acid sequences. MUR, Merkel cell virus T antigen unique region. OBD, origin-binding domain. (G) IFN-γ secretion by PBMCs from patient MCC-367 cocultured in an ELISPOT with DMSO, HIV-GAG negative control peptide, autologous MCC-367 tumor cells, or the LT-derived peptide identified in the MCC-367 HLA peptidome in F. Left: ELISPOT conditions. Right: Summary statistics (n = 3). P values were determined by 1-way ANOVA followed by post hoc Tukey’s multiple-comparison test.
Figure 4
Figure 4. MYCL identified as a regulator of HLA-I through a genome-scale ORF screen.
(A) Workflow and FACS gating strategy for the genome-scale ORF and CRISPR screens. (B) ORF screen results. Genes were ranked according to their log2(fold change) (LFC) enrichment in HLA-I–high versus –low populations. Inset: GSEA analysis of ORF positive hits. (C) HLA-I flow cytometry in MCC-301 (left) and MCC-277 (right) cells transduced with the indicated individual ORFs. Data visualized in log scale. (D) HLA-I flow cytometry in MKL-1 cells transduced with a doxycycline-inducible control shRNA, MYCL shRNA, or MYCL shRNA with rescue expression of MYCL. Top: Representative flow histograms. Middle: Normalized mean MFIs (n = 3). Bottom: Western blots for MYCL expression levels in each cell line. P values were determined by 1-way ANOVA followed by post hoc Tukey’s multiple-comparison test. Data visualized in log scale. (E and F) Volcano plots showing LFC expression in MKL-1 cells expressing shRNAs against MYCL (E) or in WaGa cells against both ST and LT (F), compared with control shRNA. Class I APM genes with Padj < 0.05 and LFC > 1 are highlighted in red; other notable class I genes are in black. (G) Copy number variations in MYC family genes. Copy number gains and losses are shown in red and blue, respectively. Gray indicates no copy number variation data available. (H) Unsupervised clustering by Euclidian distance of RNA-Seq expression values of class I pathway genes and MYC family genes across all cancer cell lines in the Cancer Cell Line Encyclopedia (44). Median values displayed for each cancer type. ALL, acute lymphoblastic leukemia; AML, acute myeloid leukemia; CML, chronic myelogenous leukemia; DLBCL, diffuse large B cell lymphoma; NSC, non–small cell; RPKM, reads per kilobase per million mapped reads.
Figure 5
Figure 5. The PRC1.1 complex implicated as a suppressor of HLA-I in a genome-wide CRISPR screen.
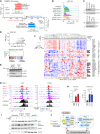
(A) Gene-level ranking of positive (left) and negative (right) CRISPR-KO screen hits, according to STARS, a gene-ranking algorithm for genetic screens (39). Inset: GSEA analysis of screen hits. (B) Flow cytometry for surface HLA-I in MCC-301 PRC1.1 KO lines (PCGF1, USP7, and BCORL1). Data visualized with biexponential scaling. (C) Western blot for PCGF1 (top) and USP7 (bottom) in WT MCC-301, a control sgRNA MCC-301 line, or the indicated knockout line. (D) Top: Volcano plot showing LFC in gene expression in an MCC-301 PCGF1-KO line compared with a control sgRNA line. Bottom: GSEA plot demonstrating enrichment of PRC2 target genes upon PCGF1 knockout. (E) Western blot of TAP1 in PCGF1-KO and control sgRNA lines at varying IFN-γ concentrations. (F) RNA-Seq analysis of HLA-I genes, PRC1.1, PRC2, and ST-MYCL-EP400 in a cohort of 51 MCC tumors. Left: Unsupervised hierarchical clustering heatmap by Euclidian distance. Top track: Tumor purity scores for each tumor, generated by ESTIMATE (53). Pearson’s correlation coefficients between each PRC2, PRC1.1, or ST-MYCL-EP400 component and each class I gene were calculated, and the bar charts (right) show the number of Pearson’s coefficients that were less than –0.3. (G) UCSC Genome Browser view of USP7 and PCGF1 with ChIP-Seq tracks for MAX (red), EP400 (blue), MCPyV ST antigen (pink), and activating histone marks H3K4me3 and H3K27ac (black). The “-1” and “-2” suffixes refer to 2 different antibodies used for each protein. (H) ChIP-qPCR targeting the USP7 and PCGF1 promoters, using MKL-1 chromatin immunoprecipitated with a MAX (left) or EP400 (right) antibody (n = 3). P values were calculated by 1-way ANOVA followed by post hoc Dunnett’s multiple-comparison test. (I) Protein expression of USP7, PCGF1, and MYCL in MKL-1 cells transduced with the indicated doxycycline-inducible shRNAs. (J) Schematic of putative interactions between MCPyV viral antigens and screen hits MYCL and PRC1.1.
Figure 6
Figure 6. Pharmacologic inhibition of PRC1.1 component USP7 upregulates HLA-I in MCPyV+ MCC.
(A) Dependency data from the Cancer Dependency Map (DepMap) (59, 60) were stratified based on TP53 mutation status (TP53-mut [n = 532] vs. TP53-WT [n = 235]). Left: Pearson’s correlation coefficients with corresponding P values and FDRs of the top genes that are codependent with USP7 in TP53-mutated lines, with PRC1.1 genes highlighted (see Supplemental Methods). Right: Graphical comparison of dependency of USP7 with PRC1.1 genes PCGF1 and RING1 in TP53-WT (blue) and TP53-mut cell lines (red). The x- and y-axes display gene effect scores determined by CERES, an algorithm which estimates gene-dependency levels from CRISPR-Cas9 survival screens” (60) (B) Flow cytometry experiments measuring surface HLA-I in MCC lines treated with USP7 inhibitor XL177A or control compound XL177B, performed in technical triplicate. One-way ANOVA was performed, followed by Welch’s 2-tailed t tests comparing XL177A and XL177B MFIs, normalized to DMSO (see Methods). *P < 0.05; **P < 0.01; NS, P ≥ 0.05. (C) HLA I flow cytometry to assess the effect of USP7 inhibitors in MKL-1 p53-WT control lines (left) or p53-KO lines (right; lines 1–3 refer to 3 different single-cell p53-KO clones). Cells were treated with 100 nM XL177A (red), XL177B (black), or DMSO (light gray). For statistical analysis, 2-way ANOVA was performed, followed by post hoc Tukey’s multiple-comparison tests (see Methods). (D) Heatmap of peptide abundances within the HLA-I–presented peptidomes of MCC-301 cells treated with XL177A (red) or XL177B (black), compared with untreated cells (gray) (n = 2 replicates). Only peptides that were significantly differentially expressed between any 2 treatment groups (determined by 2-sample, 2-tailed t test) are shown. (E) Frequency of peptides presented on each HLA allele in MCC-301 cells treated with XL177A or XL177B, compared with untreated cells.

References

    1. Chang CC, et al. Classical and nonclassical HLA class I antigen and NK cell-activating ligand changes in malignant cells: current challenges and future directions. Adv Cancer Res. 2005;93:189–234. - PubMed
    1. Nie Y, et al. DNA hypermethylation is a mechanism for loss of expression of the HLA class I genes in human esophageal squamous cell carcinomas. Carcinogenesis. 2001;22(10):1615–1623. doi: 10.1093/carcin/22.10.1615. - DOI - PubMed
    1. Shukla SA, et al. Comprehensive analysis of cancer-associated somatic mutations in class I HLA genes. Nat Biotechnol. 2015;33(11):1152–1158. doi: 10.1038/nbt.3344. - DOI - PMC - PubMed
    1. Zaretsky JM, et al. Mutations associated with acquired resistance to PD-1 blockade in melanoma. N Engl J Med. 2016;375(9):819–829. doi: 10.1056/NEJMoa1604958. - DOI - PMC - PubMed
    1. Rodig SJ, et al. MHC proteins confer differential sensitivity to CTLA-4 and PD-1 blockade in untreated metastatic melanoma. Sci Transl Med. 2018;10(450):eaar3342. doi: 10.1126/scitranslmed.aar3342. - DOI - PubMed

Publication types

MeSH terms

Substances