. 2022 Jul 1:11:e79143.
doi: 10.7554/eLife.79143.

Response to immune checkpoint blockade improved in pre-clinical model of breast cancer after bariatric surgery

Affiliations

Response to immune checkpoint blockade improved in pre-clinical model of breast cancer after bariatric surgery

Laura M Sipe et al. Elife. .

Abstract

Bariatric surgery is a sustainable weight loss approach, including vertical sleeve gastrectomy (VSG). Obesity exacerbates tumor growth, while diet-induced weight loss impairs progression. It remains unknown how bariatric surgery-induced weight loss impacts cancer progression or alters response to therapy. Using a pre-clinical model of obesity followed by VSG or diet-induced weight loss, breast cancer progression and immune checkpoint blockade therapy were investigated. Weight loss by VSG or weight-matched dietary intervention before tumor engraftment protected against obesity-exacerbated tumor progression. However, VSG was not as effective as diet in reducing tumor burden despite achieving similar weight and adiposity loss. Leptin did not associate with changes in tumor burden; however, circulating IL-6 was elevated in VSG mice. Uniquely, VSG tumors displayed elevated inflammation and immune checkpoint ligand PD-L1+ myeloid and non-immune cells. VSG tumors also had reduced T lymphocytes and markers of cytolysis, suggesting an ineffective anti-tumor microenvironment which prompted investigation of immune checkpoint blockade. While obese mice were resistant to immune checkpoint blockade, anti-PD-L1 potently impaired tumor progression after VSG through improved anti-tumor immunity. Thus, in formerly obese mice, surgical weight loss followed by immunotherapy reduced breast cancer burden. Finally, we compared transcriptomic changes in adipose tissue after bariatric surgery from patients and mouse models. A conserved bariatric surgery-associated weight loss signature (BSAS) was identified which significantly associated with decreased tumor volume. Findings demonstrate conserved impacts of obesity and bariatric surgery-induced weight loss pathways associated with breast cancer progression.

Keywords: PD-L1; breast cancer; cancer biology; immune checkpoint; immunosuppression; immunotherapy; metabolic surgery; mouse; obesity; sleeve gastrectomy.

Plain language summary

As the number of people classified as obese rises globally, so do obesity-related health risks. Studies show that people diagnosed with obesity have inflammation that contributes to tumor growth and their immune system is worse at detecting cancer cells. But weight loss is not currently used as a strategy for preventing or treating cancer. Surgical procedures for weight loss, also known as ‘bariatric surgeries’, are becoming increasingly popular. Recent studies have shown that individuals who lose weight after these treatments have a reduced risk of developing tumors. But how bariatric surgery directly impacts cancer progression has not been well studied: does it slow tumor growth or boost the anti-tumor immune response? To answer these questions, Sipe et al. compared breast tumor growth in groups of laboratory mice that were obese due to being fed a high fat diet. The first group of mice lost weight after undergoing a bariatric surgery in which part of their stomach was removed. The second lost the same amount of weight but after receiving a restricted diet, and the third underwent a fake surgery and did not lose any weight. The experiments found that surgical weight loss cuts breast cancer tumor growth in half compared with obese mice. But mice who lost the same amount of weight through dietary restrictions had even less tumor growth than surgically treated mice. The surgically treated mice who lost weight had more inflammation than mice in the two other groups, and had increased amounts of proteins and cells that block the immune response to tumors. Giving the surgically treated mice a drug that enhances the immune system’s ability to detect and destroy cancer cells reduced inflammation and helped shrink the mice’s tumors. Finally, Sipe et al. identified 54 genes which were turned on or off after bariatric surgery in both mice and humans, 11 of which were linked with tumor size. These findings provide crucial new information about how bariatric surgery can impact cancer progression. Future studies could potentially use the conserved genes identified by Sipe et al. to develop new ways to stimulate the anti-cancer benefits of weight loss without surgery.


Conflict of interest statement

LS, MC, EK, HJ, ML, BC, UT, JH, JC, NJ, DD, TM, MB, RS, AP, BT, JC, DH, MD, KC, JP, LM No competing interests declared

Figures
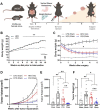
Figure 1.
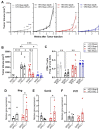
Figure 1.. Surgical and dietary weight loss interventions reduced tumor progression and burden compared to obese mice.
(A) Schematic of diet-induced obesity, weight loss intervention, and breast cancer cell injection in female C57BL/6J mice. Mice were fed obesogenic diets or kept lean for 16 weeks. At 20 weeks of age, mice were subjected to bariatric surgery or dietary intervention and sham surgery to stably reduce weights, while control high fat diet (HFD) and low fat diet (LFD) fed mice received sham surgery to remain obese or lean, respectively. E0771 breast cancer cells were injected at 22 weeks of age when weight loss stabilized. Tumor progression was quantified, and mice were sacrificed at endpoint 3 weeks later. (B) Weekly body weights are shown as diet-induced obesity (DIO) is established over 16 weeks on HFD compared to lean control mice fed LFD (n=15). (C) Body weights were measured biweekly after DIO mice were subjected to either bariatric surgery or dietary weight loss interventions. Four groups include: HFD-fed and vertical sleeve gastrectomy (HFD-VSG, red) and weight-matched (WM) caloric restricted HFD-fed and sham (WM-Sham, blue) to mirror weight loss in VSG group. These interventions were compared to controls continuously HFD-fed and sham (HFD-Sham, black) or continuously LFD-fed and sham (LFD-Sham, gray). (D) Tumor volume quantified over 3 weeks. (C–D) Two-way ANOVA Fisher’s LSD test for individual comparisons with *p<0.05, and **p<0.01 signifying HFD-Sham compared to all other groups and detailed in Supplementary file 1a and b, respectively. (E) Tumor volume and (F) tumor weight at endpoint. (E–F) Mean ± SEM one-way ANOVA with Fisher’s LSD test. (B–F) n=15 LFD-Sham, n=17 HFD-Sham, n=14 HFD-VSG, and n=13 WM-Sham. Mean ± SEM *p<0.05, **p<0.01, and ***p<0.001.
Figure 2.
Figure 2.. Bariatric surgery reduced adiposity similarly to weight-matched controls yet increased inflammation in mammary fat pad.
(A) Fat mass was measured by EchoMRI. Mean ± SEM is shown. Two-way ANOVA with Fisher’s LSD test, *p<0.05 all other groups compared to high fat diet (HFD)-Sham. (B) Mammary fat pad and (C) gonadal adipose weights were measured at endpoint. (A–C) Mean ± SEM is shown. n=15 low fat diet (LFD)-Sham, n=17 HFD-Sham, n=14 HFD-vertical sleeve gastrectomy (VSG), and n=13 weight-matched sham (WM-Sham). (D) Adipocyte diameter along the longest length was measured in hematoxylin and eosin sections of uninjected contralateral mammary fat pad. Violin plot with median (solid line) and quartiles (dashed line) is shown. Representative images at 20× are shown with 200 µm represented by scale bar. N=5–7, n=50 adipocytes/sample. (E) Circulating leptin concentration in plasma was measured at endpoint after 4 hr of fasting by Luminex assay. N=13–15. (F) Row mean centered gene expression of Lep encoding for Leptin in uninjected contralateral mammary fat pad was quantified by RNA sequencing (RNA-seq). Box and whiskers shown mean, min, and max. N=6–8. (B–E). One-way ANOVA with Fisher’s LSD test. *p<0.05, **p<0.01, ***p<0.001, and ****p<0.0001. (G) Database for annotation, visualization, and integrated discovery (DAVID) analysis of regulated inflammatory pathways in mammary fat pads of HFD-VSG mice compared to WM-Sham mice. FDR: false discovery rate. (H) Heat map of row mean centered gene expression in uninjected contralateral mammary fat pad by RNA-seq of genes contributing to the significantly regulated Inflammatory response pathway (GO:0006954) determined by DAVID analysis. N=6–8.
Figure 3.
Figure 3.. The tumor microenvironment displayed increased inflammation and immune checkpoint ligand expression following bariatric surgery.
(A) Database for annotation, visualization, and integrated discovery (DAVID) analysis of regulated pathways and false discovery rate (FDR) for high fat diet (HFD)-vertical sleeve gastrectomy (VSG) (red) and weight-matched sham (WM-Sham) (blue) relative to tumors from HFD-Sham mice is shown. N=6–8. (B) Heat map of row mean centered gene expression in tumor by RNA sequencing (RNA-seq) of genes contributing to significantly regulated inflammatory response pathway (GO:0006954) and response to hypoxia pathway (GO:0001666) determined by DAVID analysis. N=6–8. (C) Flow cytometric analysis of CD45 negative (CD45−) PD-L1+ non-immune cells in tumor is plotted as frequency of total live cells. (D) Mean fluorescent intensity (MFI) of PD-L1 on CD45− PD-L1+ cells in tumor is shown. N=4–5. (E) Circulating IL-6 concentration in plasma was measured at endpoint after 4 hr of fasting by Luminex. N=8–14. (F) Flow cytometric analysis of PD-L1 MFI in E0771 breast cancer cells after treatment with recombinant mouse IL-6 (200 pg/mL) for 4 hr. Mean ± SEM is shown. One-way ANOVA with Fisher’s LSD test. *p<0.05, **p<0.01, and ***p<0.001. (G) Gene set enrichment analysis (GSEA) of the hallmark pathway for IL6/JAK/STAT3 gene set from the Molecular Signatures Database of the Broad Institute is reported in HFD-VSG tumors compared to WM-Sham controls. The normalized enrichment score (NES) and FDR are shown.
Figure 4.
Figure 4.. Vertical sleeve gastrectomy (VSG) reduced CD8+ tumor T lymphocyte frequency and markers of T cell activation demonstrating impaired anti-tumor immunity.
(A–B) Flow cytometric analysis of tumor (A) CD3+ T cells and (B) CD8+ T cells is shown as frequency of total live cells. N=8–12. (C) Analysis of tumor CD8+ T cell content from RNA sequencing (RNA-seq) data using the cell-type identification estimating relative subsets of RNA transcripts (CIBERSORT)-Abs algorithm in TIMER2.0. N=6–8. (D) Database for annotation, visualization, and integrated discovery (DAVID) analysis of regulated pathways for low fat diet (LFD)-Sham (gray), high fat diet (HFD)-VSG (red), and weight-matched sham (WM-Sham) (blue) relative to tumors from HFD-Sham mice. N=6–8. (E) Heat map of row mean centered gene expression in tumor by RNA-seq of genes contributing to the significantly regulated T cell signaling pathway (mmu04660 and false discovery rate [FDR] 6.83) and (F) cytolysis (GO:0019835 and FDR 1.25) as determined by DAVID analysis. N=6–8. (G) Flow cytometric analysis of tumor PD-L1+ monocytic myeloid derived suppressor cells (M-MDSC) shown as frequency of total M-MDSC. N=5. (H) Flow cytometric analysis of tumor PD-L1+ macrophages shown as frequency of total macrophages. N=5. (A–C and G–H) Mean ± SEM are shown. One-way ANOVA with Fisher’s LSD test *p<0.05, **p<0.01, ***p<0.001, and ****p<0.0001.
Figure 4—figure supplement 1.
Figure 4—figure supplement 1.. CD3+ and CD8+ T cell frequencies and CD3+ PD-1 expression by MFI were unchanged in tumor draining lymph node (TdLN) and tumors.
Flow cytometric analysis of TdLN and tumor adjacent mammary fat pad (MFP) tissue (A) CD3+ T cells and (B) CD8+ T cells are shown as frequency of total live cells. Mean fluorescent intensity (MFI) of PD-1 on CD3+ T cells in (C) TdLN and tumor adjacent MFP and in (D) tumor is shown. (A–D) Mean ± SEM N=5. One-way ANOVA with Fisher’s LSD test.
Figure 5.
Figure 5.. Immune checkpoint blockade re-invigorated the anti-tumor immune response in mice after bariatric surgery.
Diet-induced obesity (DIO) mice were subjected to either surgical or dietary weight loss interventions and compared to lean or obese controls similar to Figure 1A. After weight stabilization at 2 weeks, mice were injected with E0771 cells, as above. Mice were either treated with anti-PD-L1 or IgG2b isotype control every 3 days until sacrifice at 3 weeks after cell injection. (A) Mean tumor growth in each diet group treated with anti-PD-L1 or IgG2b isotype control is shown. (B) Tumor volume at endpoint. (C) Flow cytometric analysis of CD8+ T cells as frequency of total live cells in tumor. (D) Relative gene expression normalized to 18S of Ifng (E), Gzmb, and (F) Prf1 in tumors. (A–F) Mean ± SEM. N=5–8. Two-way ANOVA with Fisher’s LSD test. Only relevant statistical comparisons are shown for clarity. *p<0.05, **p<0.01, ***p<0.001, and ****p<0.0001.
Figure 5—figure supplement 1.
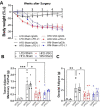
Figure 5—figure supplement 1.. Immune checkpoint blockade did not alter body weight or adiposity.
(A) Percent body weight change in mice after weight-loss interventions is reported until endpoint. (B) Tumor adjacent mammary fat pad and (C) gonadal adipose weight at endpoint are reported. Mean ± SEM. N=5–8. Two-way ANOVA with Fisher’s LSD test. *p<0.05, **p<0.01, and ***p<0.001.
Figure 6.
Figure 6.. Conserved adipose bariatric surgery-associated weight loss signature associated with tumor volume.
(A) Venn diagram of differentially expressed genes (DEGs) from obese and lean patient subcutaneous adipose tissue before and 3 months after bariatric surgery, respectively, compared to obese high fat diet (HFD)-Sham and lean HFD-vertical sleeve gastrectomy (VSG) mammary fat pad. (B) Database for annotation, visualization, and integrated discovery (DAVID) pathways enriched in the overlapping DEG are indicated. (C) A tumor bariatric surgery-associated weight loss signature (T-BSAS) signature was identified as a subset of BSAS genes that significantly correlated to tumor volume. Heat map of row mean centered expression of T-BSAS genes in the mammary fat pad by RNA sequencing (RNA-seq). (D) Tumor volume compared to unaffected mammary fat pad (MFP) gene expression of Ido1 is plotted. Simple linear regression (red line) for HFD-Sham and HFD-VSG groups is shown (R2=0.31 and p=0.026).

References

    1. Adeshakin AO, Adeshakin FO, Yan D, Wan X. Regulating Histone Deacetylase Signaling Pathways of Myeloid-Derived Suppressor Cells Enhanced T Cell-Based Immunotherapy. Frontiers in Immunology. 2022;13:781660. doi: 10.3389/fimmu.2022.781660. - DOI - PMC - PubMed
    1. Ahn CH, Choi EH, Lee H, Lee W, Kim J-I, Cho YM. Vertical sleeve gastrectomy induces distinctive transcriptomic responses in liver, fat and muscle. Scientific Reports. 2021;11:2310. doi: 10.1038/s41598-021-81866-5. - DOI - PMC - PubMed
    1. Alalwan AA, Friedman J, Park H, Segal R, Brumback BA, Hartzema AG. US national trends in bariatric surgery: A decade of study. Surgery. 2021;170:13–17. doi: 10.1016/j.surg.2021.02.002. - DOI - PubMed
    1. Alvarez R, Ridelman E, Rizk N, White MS, Zhou C, Chan H-P, Varban OA, Helvie MA, Seeley RJ. Assessment of mammographic breast density after sleeve gastrectomy. Surgery for Obesity and Related Diseases. 2018;14:1643–1651. doi: 10.1016/j.soard.2018.07.024. - DOI - PMC - PubMed
    1. Aminian A, Wilson R, Al-Kurd A, Tu C, Milinovich A, Kroh M, Rosenthal RJ, Brethauer SA, Schauer PR, Kattan MW, Brown JC, Berger NA, Abraham J, Nissen SE. Association of Bariatric Surgery With Cancer Risk and Mortality in Adults With Obesity. JAMA. 2022;327:2423–2433. doi: 10.1001/jama.2022.9009. - DOI - PMC - PubMed

Publication types

Substances