. 2022 Jul 22;50(13):7310-7325.
doi: 10.1093/nar/gkac542.

Regulation of both transcription and RNA turnover contribute to germline specification

Affiliations

Regulation of both transcription and RNA turnover contribute to germline specification

Kun Tan et al. Nucleic Acids Res. .

Abstract

The nuanced mechanisms driving primordial germ cells (PGC) specification remain incompletely understood since genome-wide transcriptional regulation in developing PGCs has previously only been defined indirectly. Here, using SLAMseq analysis, we determined genome-wide transcription rates during the differentiation of embryonic stem cells (ESCs) to form epiblast-like (EpiLC) cells and ultimately PGC-like cells (PGCLCs). This revealed thousands of genes undergoing bursts of transcriptional induction and rapid shut-off not detectable by RNAseq analysis. Our SLAMseq datasets also allowed us to infer RNA turnover rates, which revealed thousands of mRNAs stabilized and destabilized during PGCLC specification. mRNAs tend to be unstable in ESCs and then are progressively stabilized as they differentiate. For some classes of genes, mRNA turnover regulation collaborates with transcriptional regulation, but these processes oppose each other in a surprisingly high frequency of genes. To test whether regulated mRNA turnover has a physiological role in PGC development, we examined three genes that we found were regulated by RNA turnover: Sox2, Klf2 and Ccne1. Circumvention of their regulated RNA turnover severely impaired the ESC-to-EpiLC and EpiLC-to-PGCLC transitions. Our study demonstrates the functional importance of regulated RNA stability in germline development and provides a roadmap of transcriptional and post-transcriptional regulation during germline specification.


Figures

Figure 1.
Figure 1.
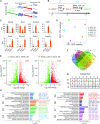
Genome-wide mRNA steady-state level kinetics during the process of PGCLC specification. (A) Steady-state mRNA levels are dictated by both RNA synthesis (transcription) and turnover rates. A low transcription rate coupled with high turnover rate yields low mRNA steady-state level (depicted as one transcript), while high transcription rate coupled with low turnover rate yields high mRNA steady-state level (depicted as seven transcripts). An intermediate RNA steady-state level (depicted as three transcripts) can be achieved by either high transcription rate coupled with high RNA turnover rate or the inverse. (B) Schematic illustration of the PGCLC specification model. mESC cells cultured under 2i condition are treated with different growth factors, as indicated, to induce their differentiation into EpiLC and PGCLC cells. Before collecting samples for our experiments, cells were given a pulse of s4U for 1 h. (C) The relative expression level (log2[TPM + 1]) of pluripotency factor genes (Sox2 and Nanog), epiblast marker genes (Fgf5 and Dnmt3b), and PGC-enriched genes (Prdm1, Prdm14, Nanos3, and Dnd1). Their fold-changes across these three cell stages are shown in Supplementary Table S1. (D) PCA of the indicated SLAMseq samples. SS, steady-state RNA; TU, transcription rate. (E) Volcano plot showing the steady-state levels of DETs when comparing EpiLCs with mESCs (T1) or PGCLCs with EpiLCs (T2). q < 0.01, |log2FC|>1. (F) Overlap amongst DETs defined in panel (E). (G) The number of transcripts in each of the transcript classes (from panel F). (H) The most statistically significant gene ontology (GO) terms for each transcript class (defined in G).
Figure 2.
Figure 2.
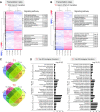
Transcriptionally-regulated genes. (A) Left, transcripts undergoing different rates of transcription between mESCs with EpiLCs (q < 0.01, |log2FC| > 0.5). Three biological replicates from each are shown. Right, most enriched signaling pathways, with P value shown. (B) Left, transcripts undergoing different rates of transcription between EpiLCs and PGCLCs, determined as in panel (A). Right, most enriched signaling pathways, with P value shown. (C) Overlap of transcripts undergoing changes in steady-state level (SS) and transcription rate (TU). Up, upregulated; down, downregulated. (D) Most enriched gene ontology (GO) biological function terms for the transcript classes defined in panel (C).
Figure 3.
Figure 3.
The relationship of RNA synthesis and turnover during PGCLC specification. (A) Global RNA turnover rate of all transcripts during PGCLC specification, as inferred from SLAMseq analysis (Supplementary Table S2). The average degree of RNA stabilization is indicated with a solid line; upper quartile and lower quartile RNA turnover rates are indicated with dotted lines. The blue arrow indicates the overall shift in RNA turnover rate, with the upward arrow indicative of a decrease in global RNA turnover as ESCs progress to form EpiLCs and then PGCLCs. (B) Shift in RNA turnover rates of the indicated classes of transcripts during the T1 transition, depicted as described in panel A. The first and second terms are the shift in steady-state mRNA level and transcription rate, respectively. Up, upregulated; Down, downregulated; –, no significant change. (C) Shift in RNA turnover rates of the indicated classes of transcripts during the T2 transition, depicted as described in panels (A) and (B). **P < 0.01; ****P < 0.0001.
Figure 4.
Figure 4.
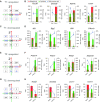
Transcripts stratified by whether they are up- or down-regulated at the steady-state level at the T1 and T2 transitions. (A, C, E and G) The number of up and down-regulated transcripts exhibiting changes in transcription (TU) and RNA turnover (Rd) during the T1 and T2 transitions. Numbers in blue refer to transcripts regulated by RNA turnover and/or transcription whose steady-state levels change in the same direction. (B, D, F and H) Representative transcripts showing their changes in synthesis, turnover rate, and steady-state level at the stages indicated.
Figure 5.
Figure 5.
Cdne1, Klf2, and Sox2 transcripts undergo regulated RNA turnover during PGCLC specification. (A) Transcripts stabilized and destabilized during both the mESC-EpiLC (T1) and EpiLC-PGCLC (T2) transitions. (B) Transcription rate, RNA turnover rate, and steady-state level, as determined by SLAMseq analysis. (C) Alternative scheme to determine RNA turnover rates using a plasmid encoding xrRNA sequences that resist 5′ to 3′ exonuclease turnover (e.g. via XRN1). RNA turnover intermediates (generated as a result of 5′ to 3′ exonuclease turnover) harbor a free monophosphate at the 5′ end, which is ligated with an RNA linker to permit detection by qPCR. (D) Constructs were generated comprised of genomic sequences from the indicated genes inserted into a vector containing the EF1α promoter and xrRNA sequences downstream. Of note, the polyadenylation site of these three genes was not included in the 3′UTR cloned, forcing usage of the polyadenylation site in the vector (indicted as ‘AAAA’). (E) qPCR analysis of RNA turnover intermediates in cells at the indicated stages transiently transfected with the indicated constructs depicted in panel D. Constructs lacking the xrRNA sequence were transfected as a negative control. A co-transfected β-globin construct (whose expression was detected by a primer pair specific for β-globin) served as an internal control. Different letters (a, b, c) denote statistically significant differences between different groups (P < 0.05).
Figure 6.
Figure 6.
Regulated RNA turnover is critical for PGCLC specification. (A) The expression of the indicated genes (steady-state mRNA levels) during the ESC-to-EpiLC transition, as determined by SLAMseq analysis. All values were normalized to expression in ESCs, which was given a value of ‘1.’ (B) qPCR analysis of EpiLCs induced from ESCs that were transduced at the ESC stage with the indicated shRNA vectors or expression vectors, respectively. Ccne1-KD, Ccne1 shRNA; Ctrl-KD, negative control (scrambled) shRNA; Klf2-EV, Klf2-expression vector; Sox2-EV, Sox2-expression vector; Ctrl-EV, empty expression vector. (C) The expression of the indicated genes (steady-state mRNA levels) during the EpiLC-to-PGCLC transition, as determined by SLAMseq analysis. All values were normalized to expression in EpiLCs, which was given a value of ‘1.’ (D) qPCR analysis of PGCLCs induced from EpiLCs that were transduced at the EpiLC stage with the indicated shRNA vectors or expression vectors. Ccne1-EV, Ccne1-expression vector; Ctrl-EV, empty expression vector; Klf2-KD, Klf2 shRNA; Sox2-KD, Sox2 shRNA; Ctrl-KD, negative control (scrambled) shRNA. Statistical significance for panels B and D was determined using the Student's t test (n = 3). *P < 0.05. (E) FACS analysis of the proportion of PGCLCs generated under the indicated conditions (defined in panel D). The cells were stained with an antibody against mouse ITGB3 conjugated to PE and an antibody against mouse SSEA1 conjugated to APC. Q2 contains the double-positive (ITGB3+ SSEA1+) PGCLCs (7).

Similar articles

Cited by

References

    1. Gunesdogan U., Magnusdottir E., Surani M.A.. Primordial germ cell specification: a context-dependent cellular differentiation event [corrected]. Philos. Trans. R. Soc. Lond B. Biol. Sci. 2014; 369:20130543. - PMC - PubMed
    1. Hackett J.A., Zylicz J.J., Surani M.A.. Parallel mechanisms of epigenetic reprogramming in the germline. Trends Genet. 2012; 28:164–174. - PubMed
    1. Hancock G.V., Wamaitha S.E., Peretz L., Clark A.T.. Mammalian primordial germ cell specification. Development. 2021; 148:dev189217. - PMC - PubMed
    1. Ginsburg M., Snow M.H., McLaren A.. Primordial germ cells in the mouse embryo during gastrulation. Development. 1990; 110:521–528. - PubMed
    1. O’Connor M.D., Kardel M.D., Iosfina I., Youssef D., Lu M., Li M.M., Vercauteren S., Nagy A., Eaves C.J.. Alkaline phosphatase-positive colony formation is a sensitive, specific, and quantitative indicator of undifferentiated human embryonic stem cells. Stem Cells. 2008; 26:1109–1116. - PubMed

Publication types