. 2022 Nov 1;206(9):1081-1095.
doi: 10.1164/rccm.202202-0309OC.

Mucins MUC5AC and MUC5B Are Variably Packaged in the Same and in Separate Secretory Granules

Affiliations

Mucins MUC5AC and MUC5B Are Variably Packaged in the Same and in Separate Secretory Granules

Oanh N Hoang et al. Am J Respir Crit Care Med. .

Abstract

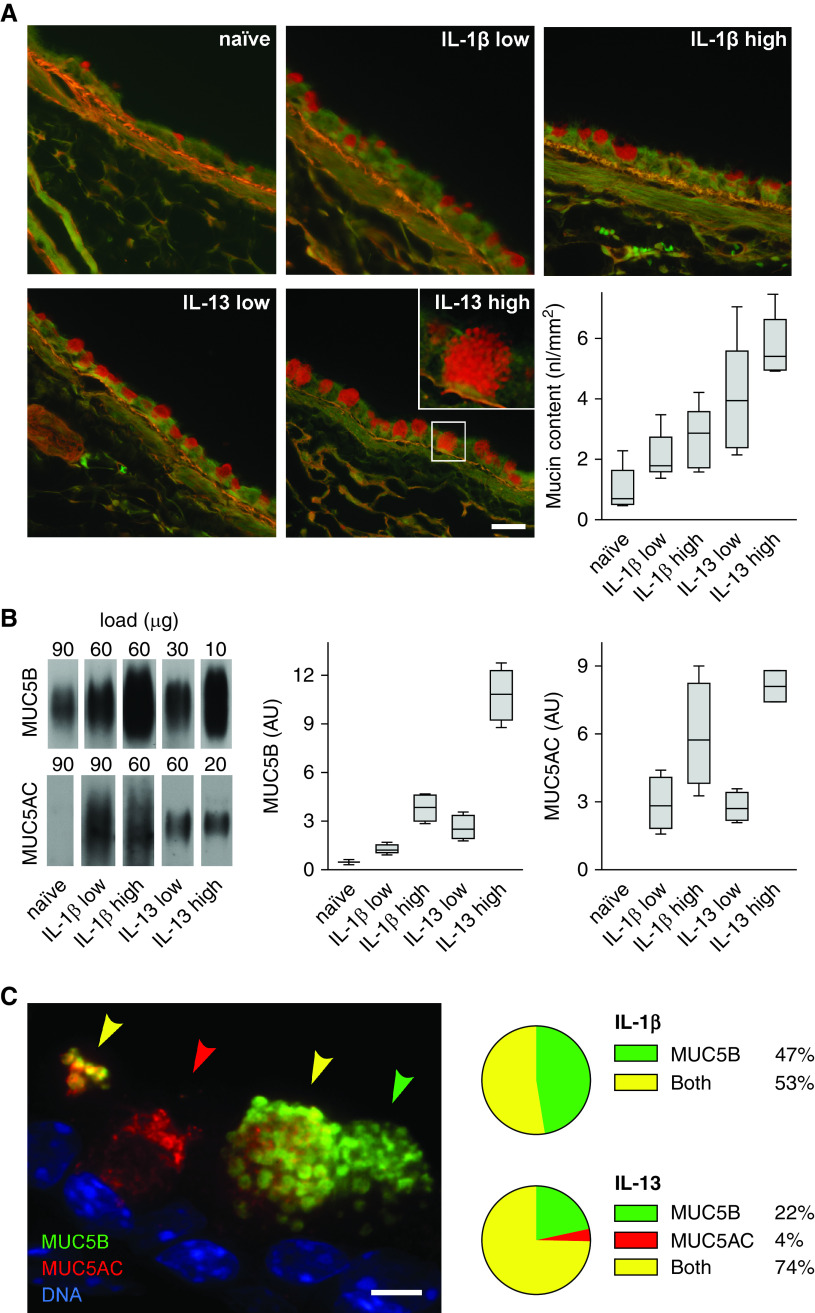
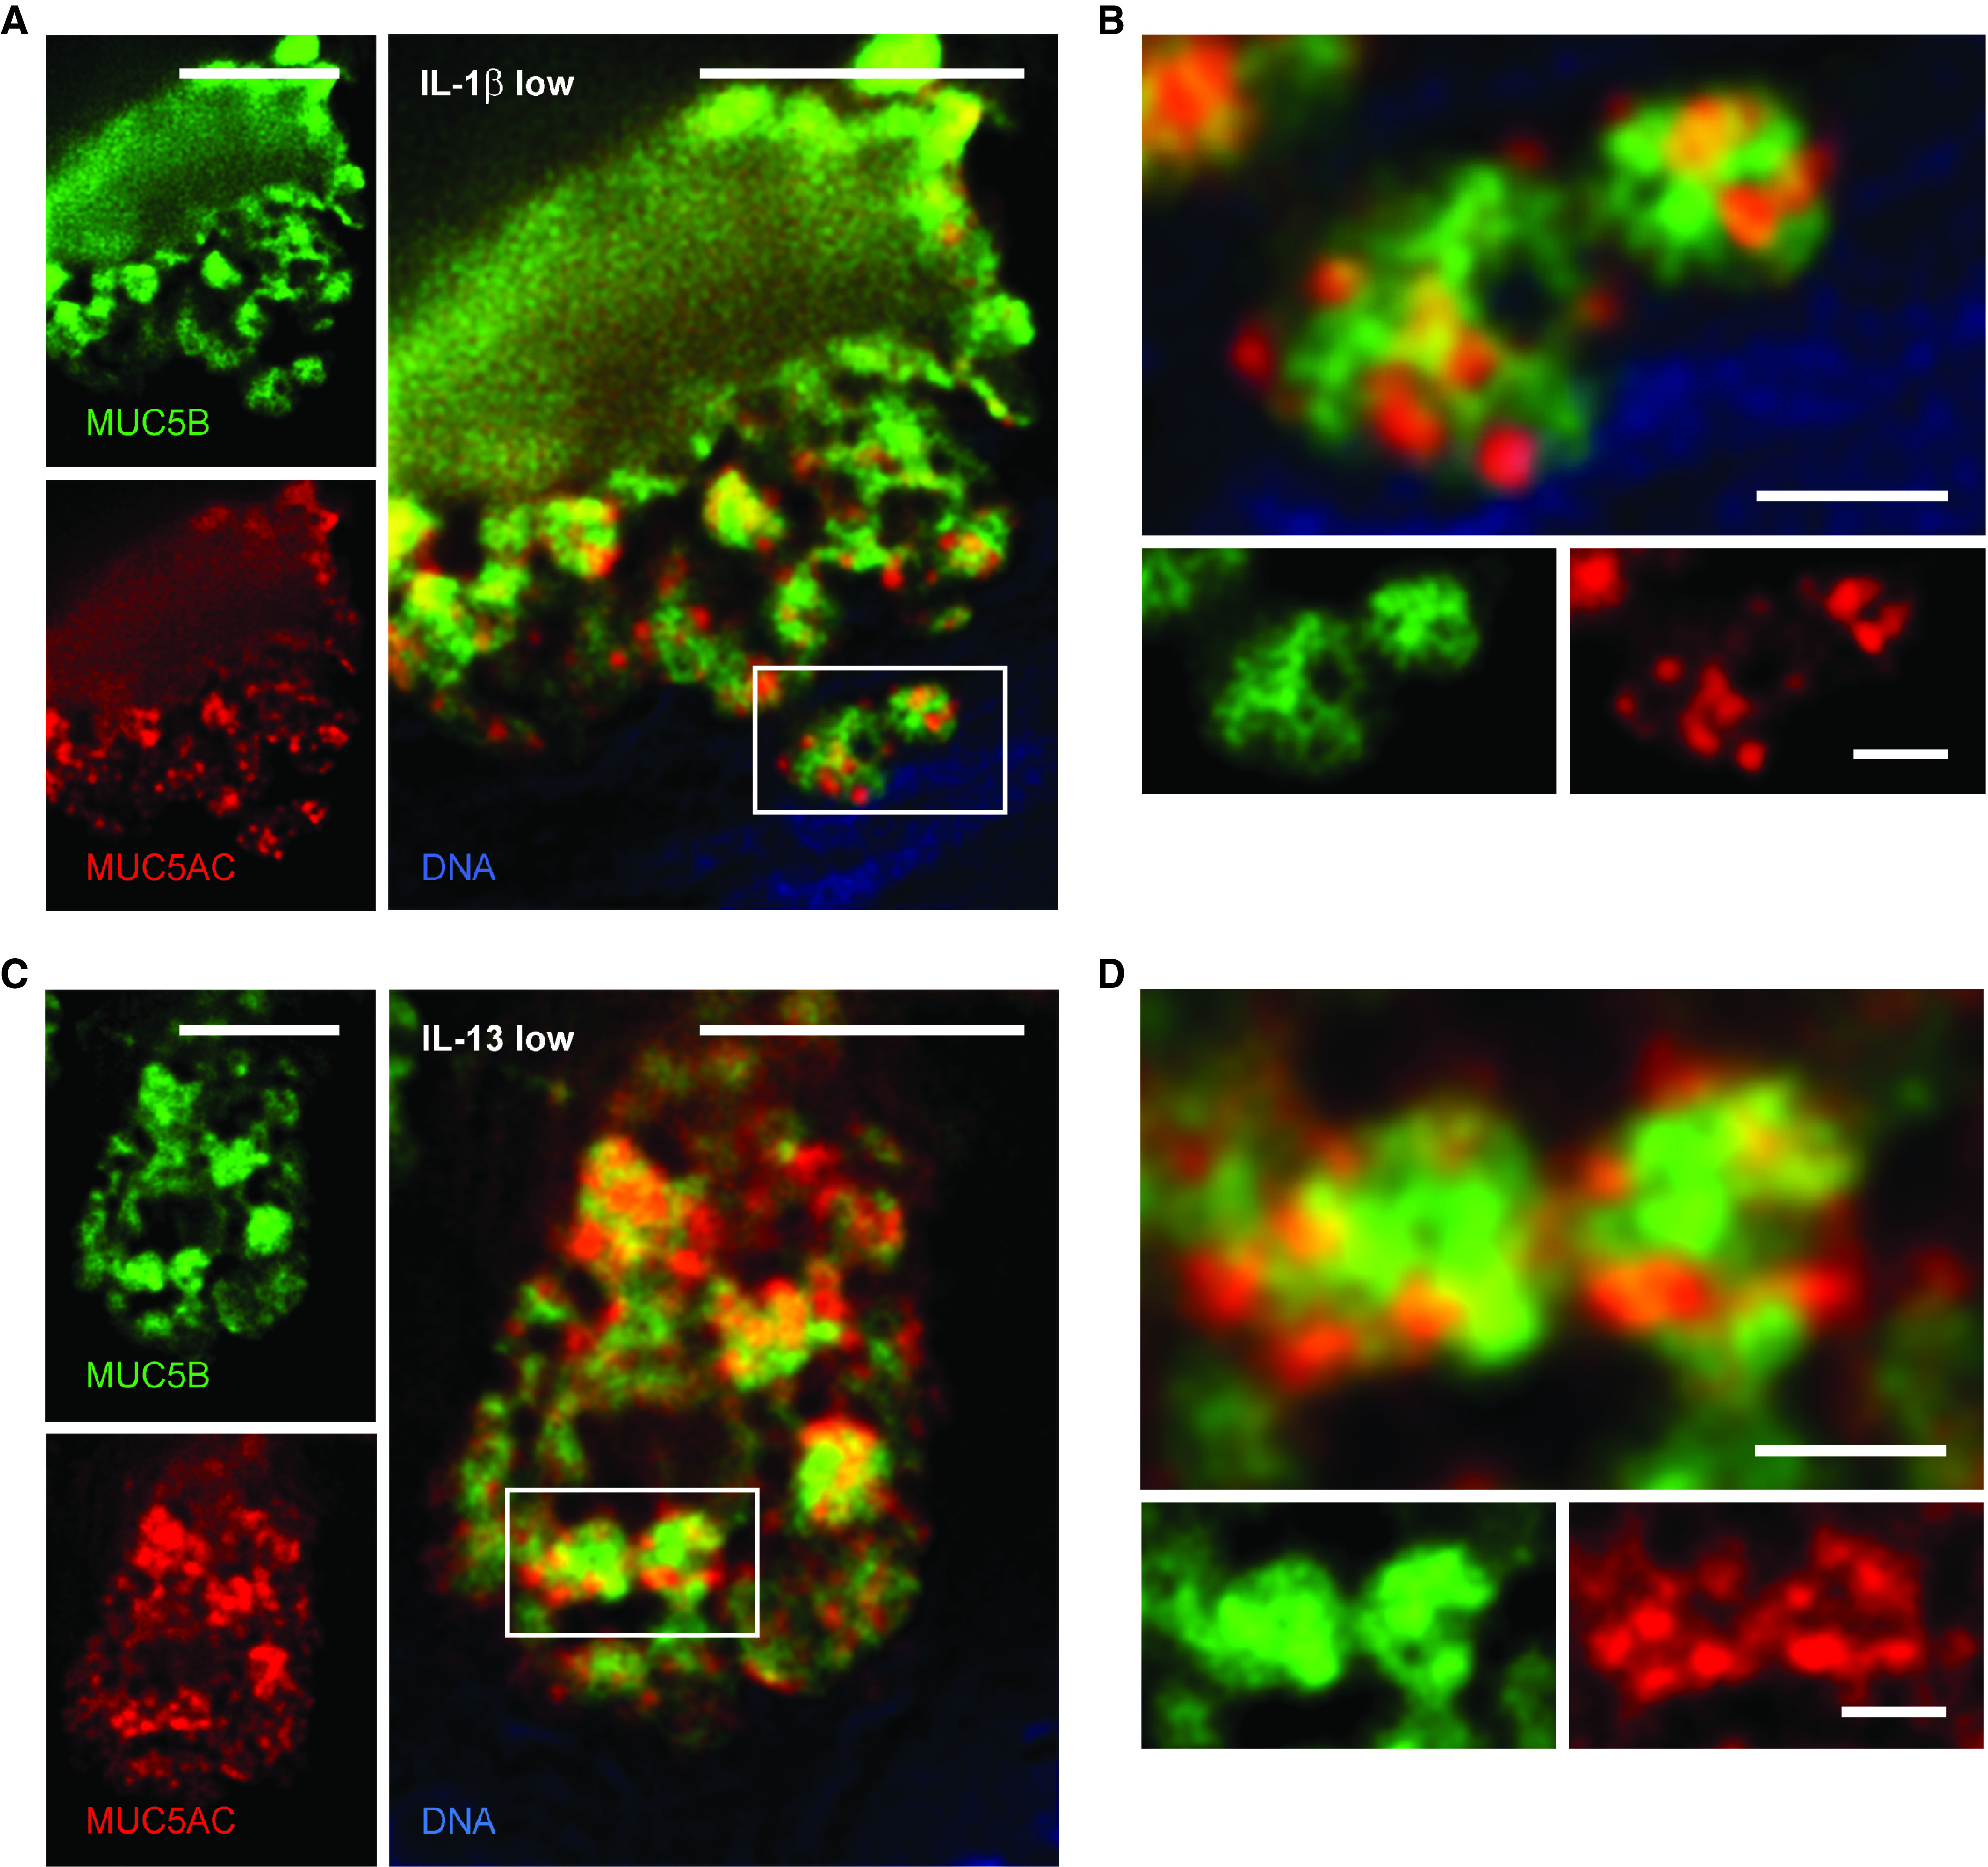
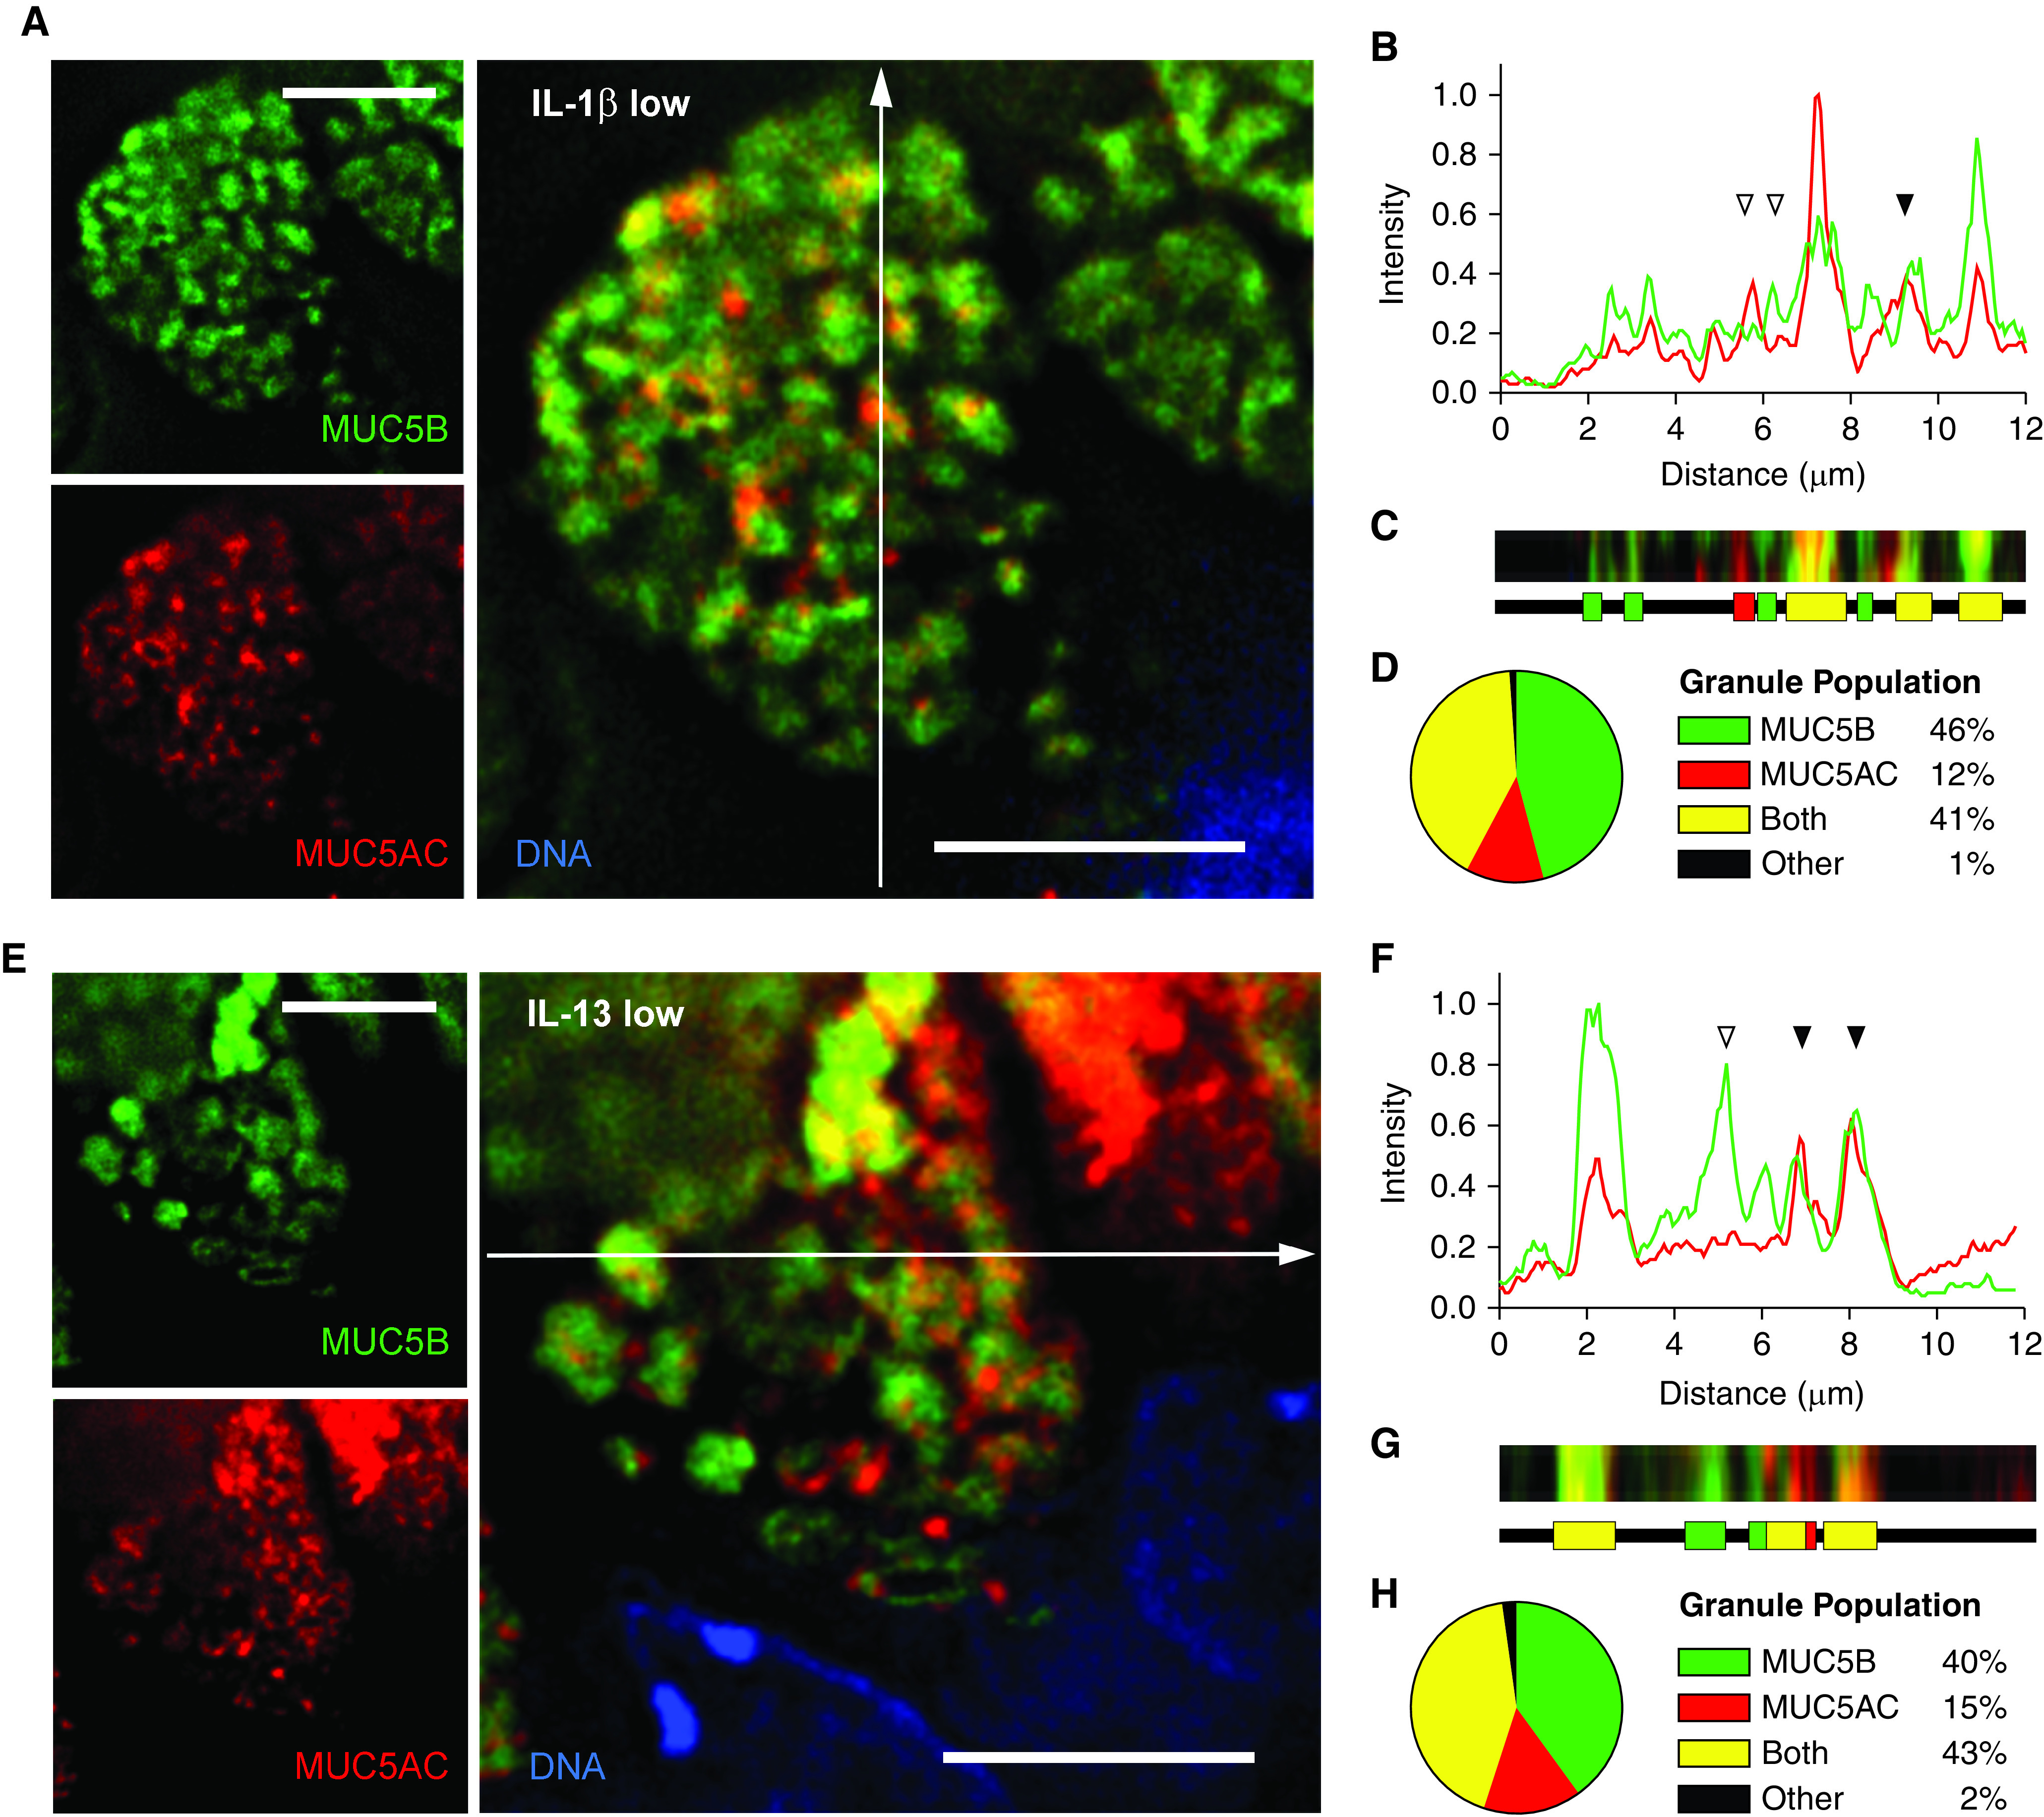
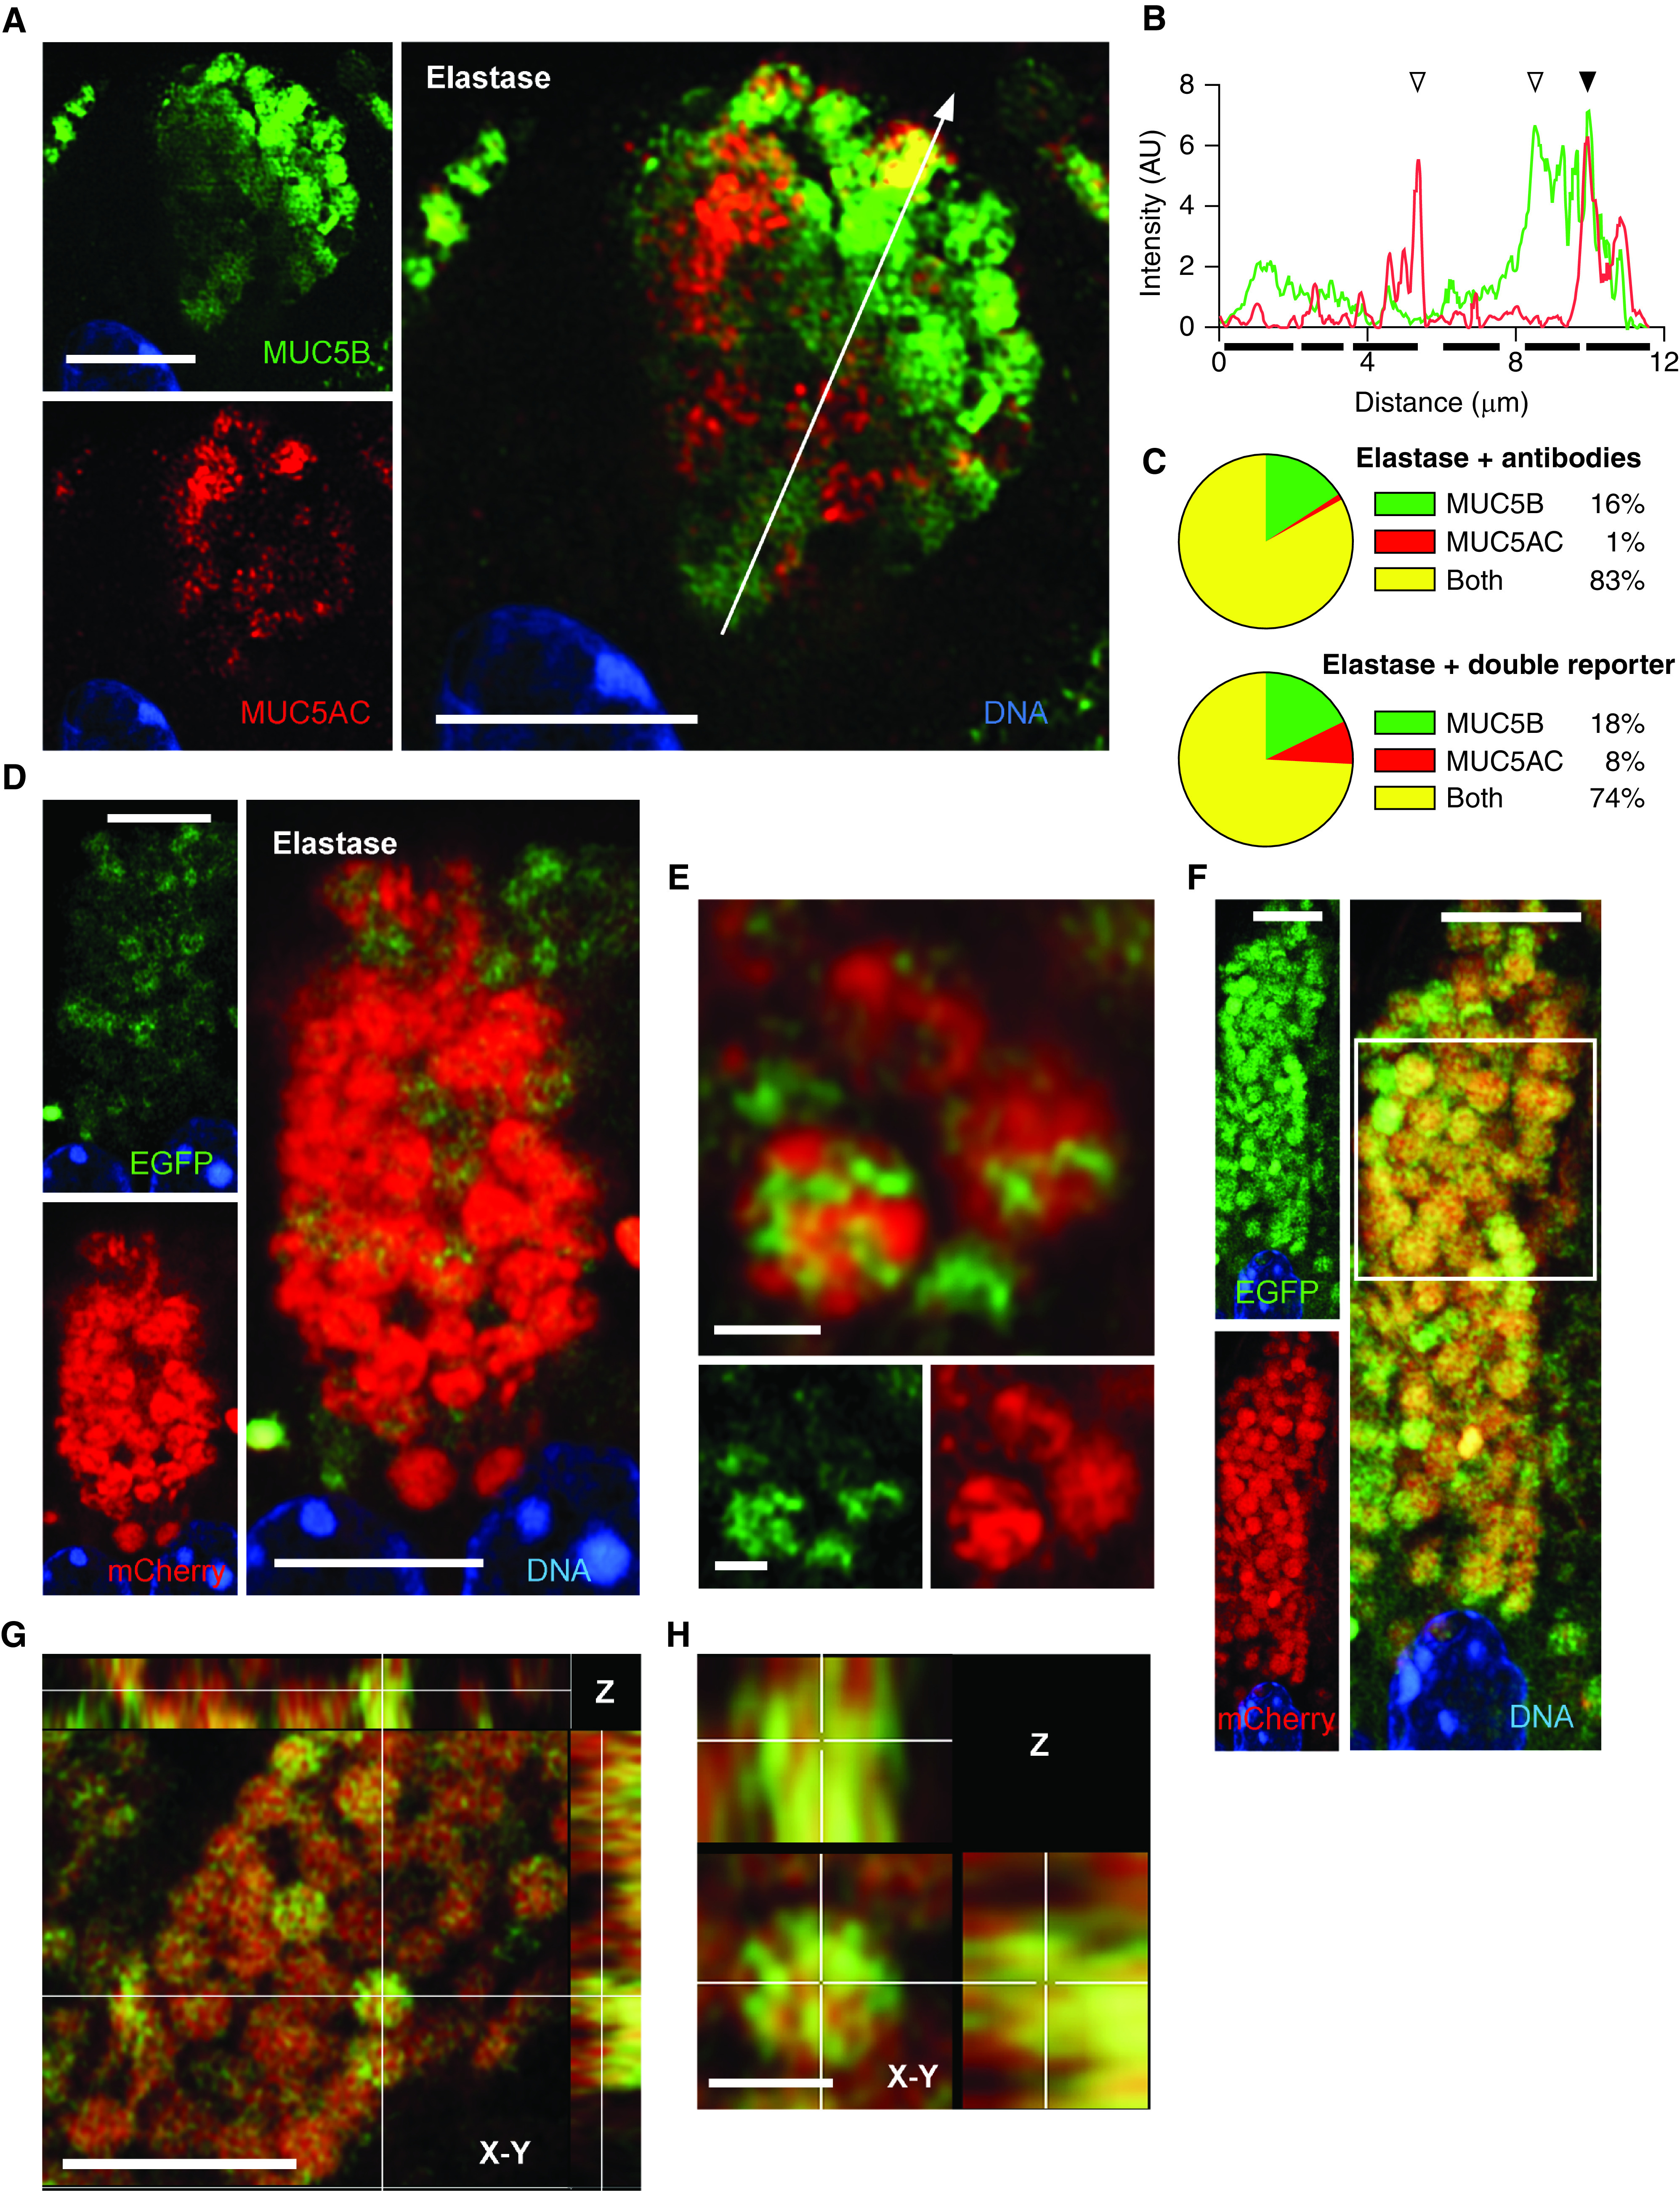
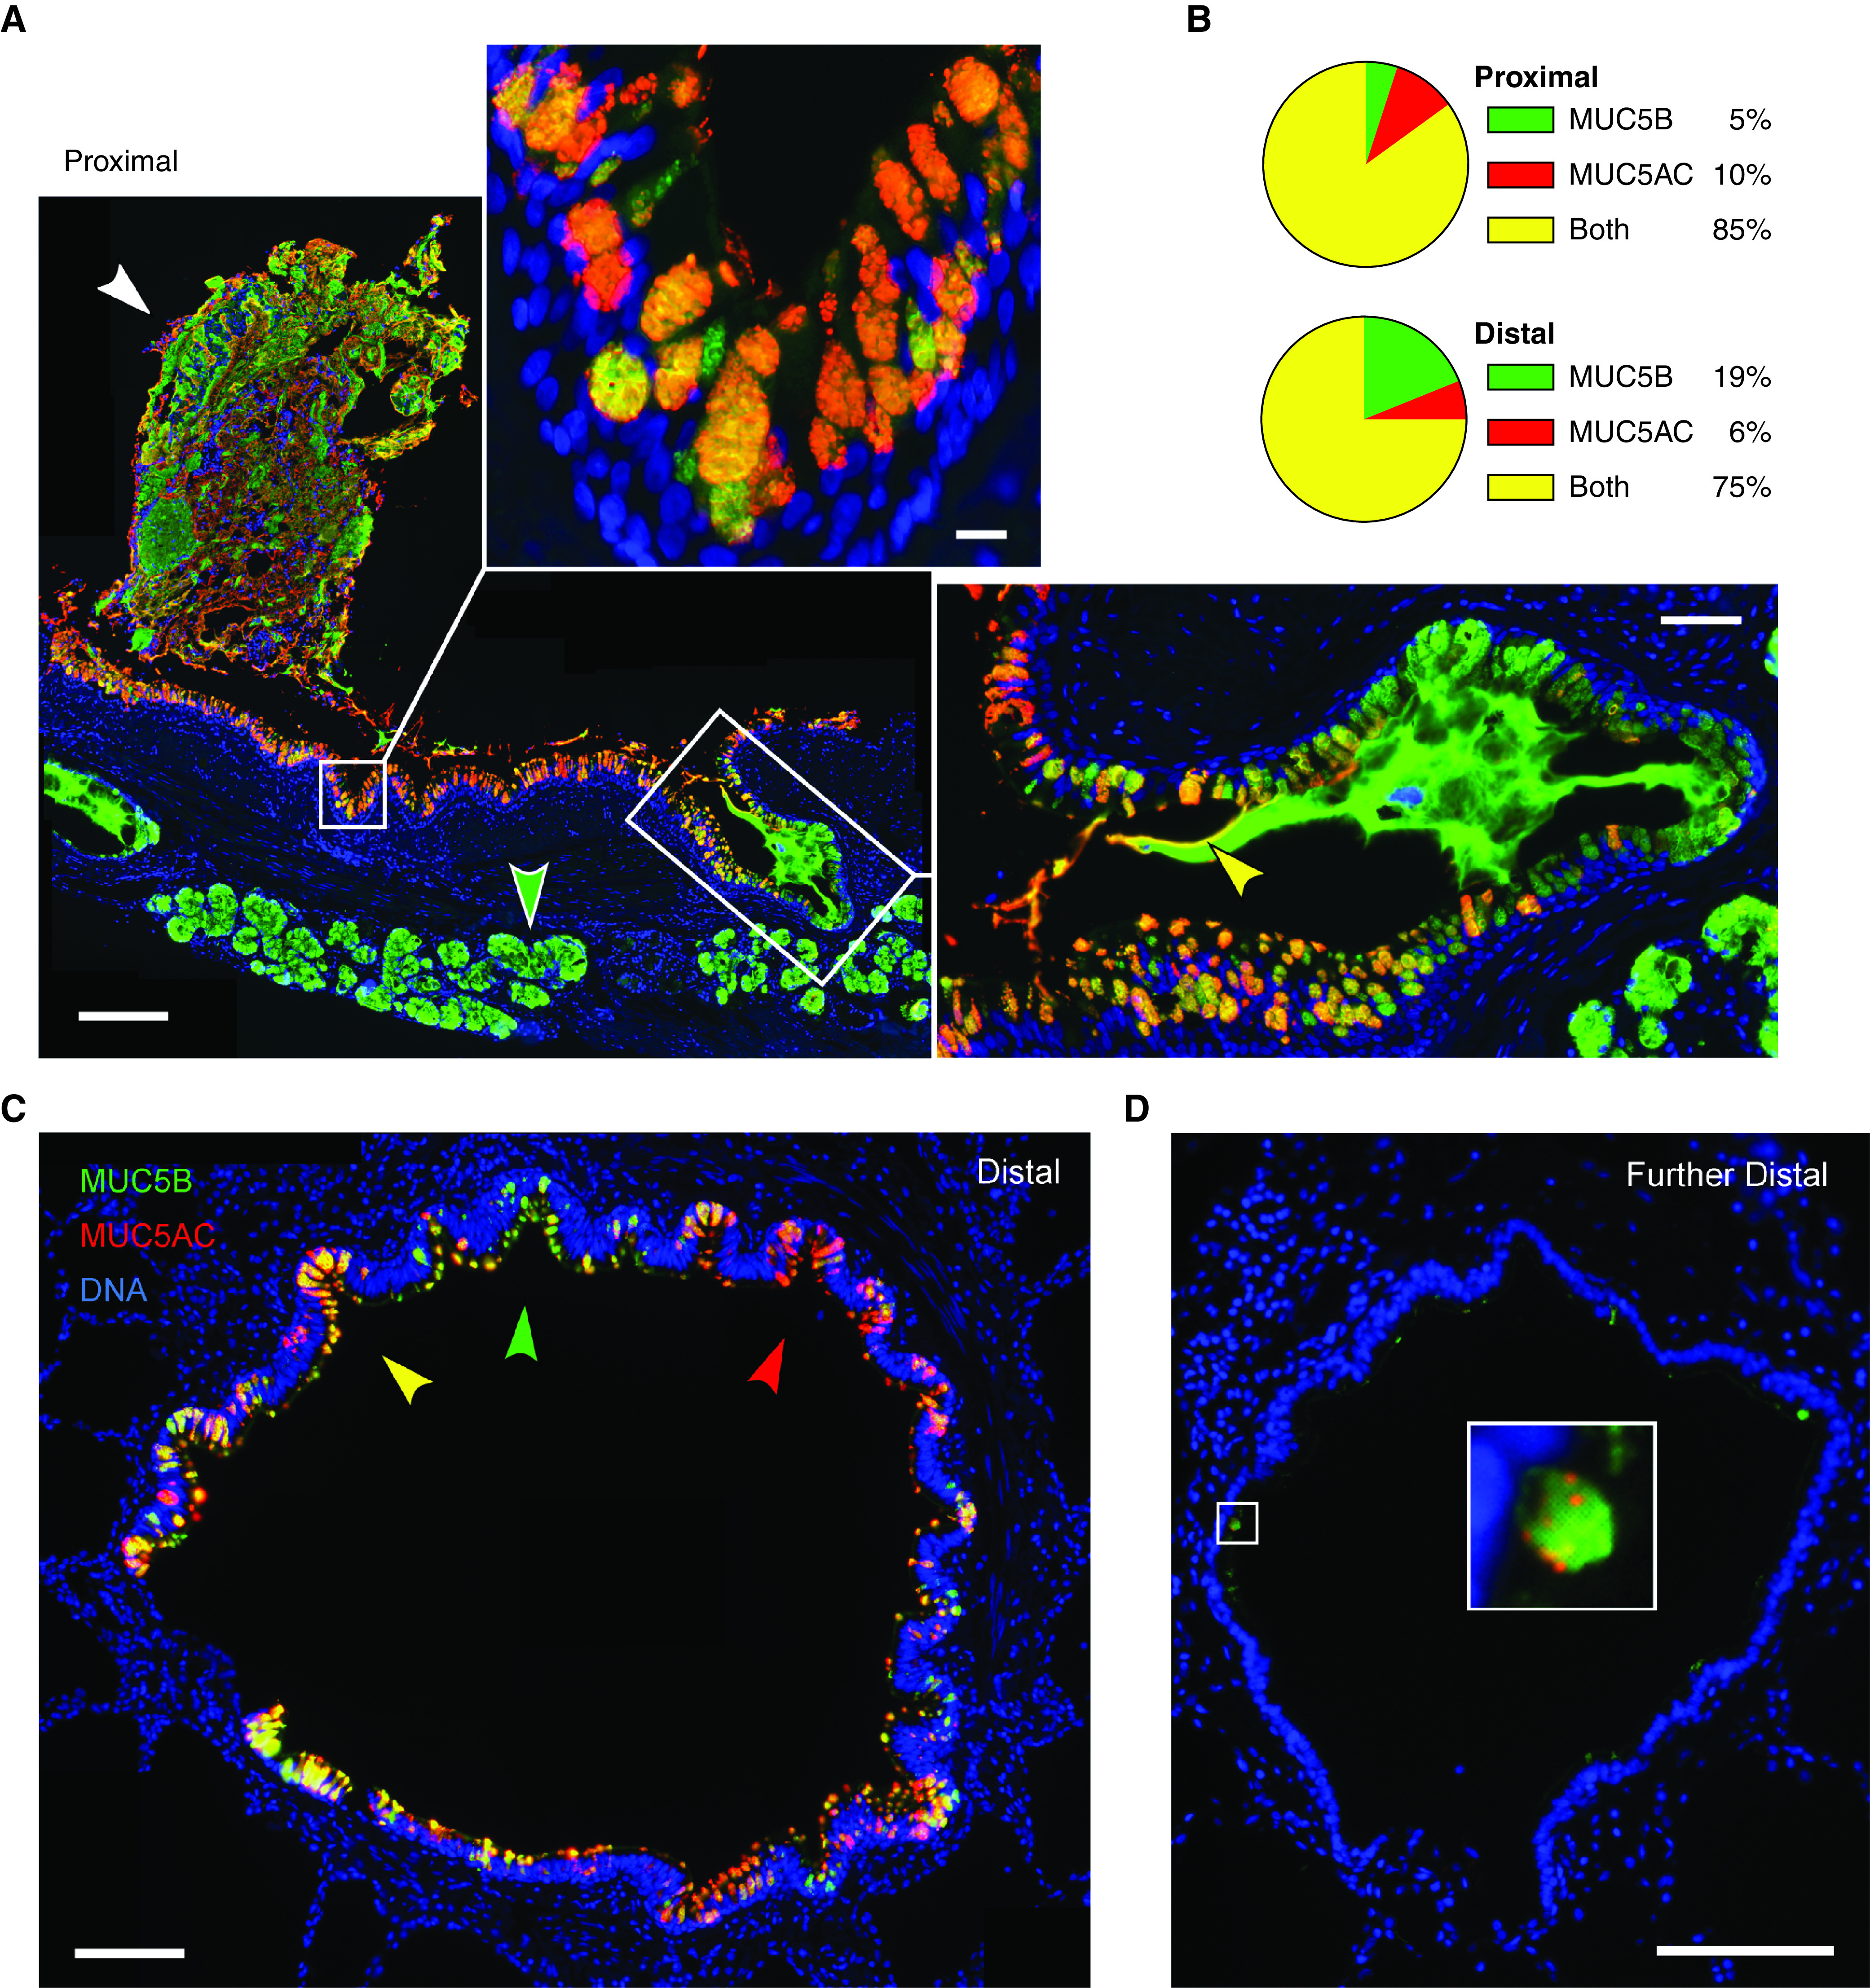
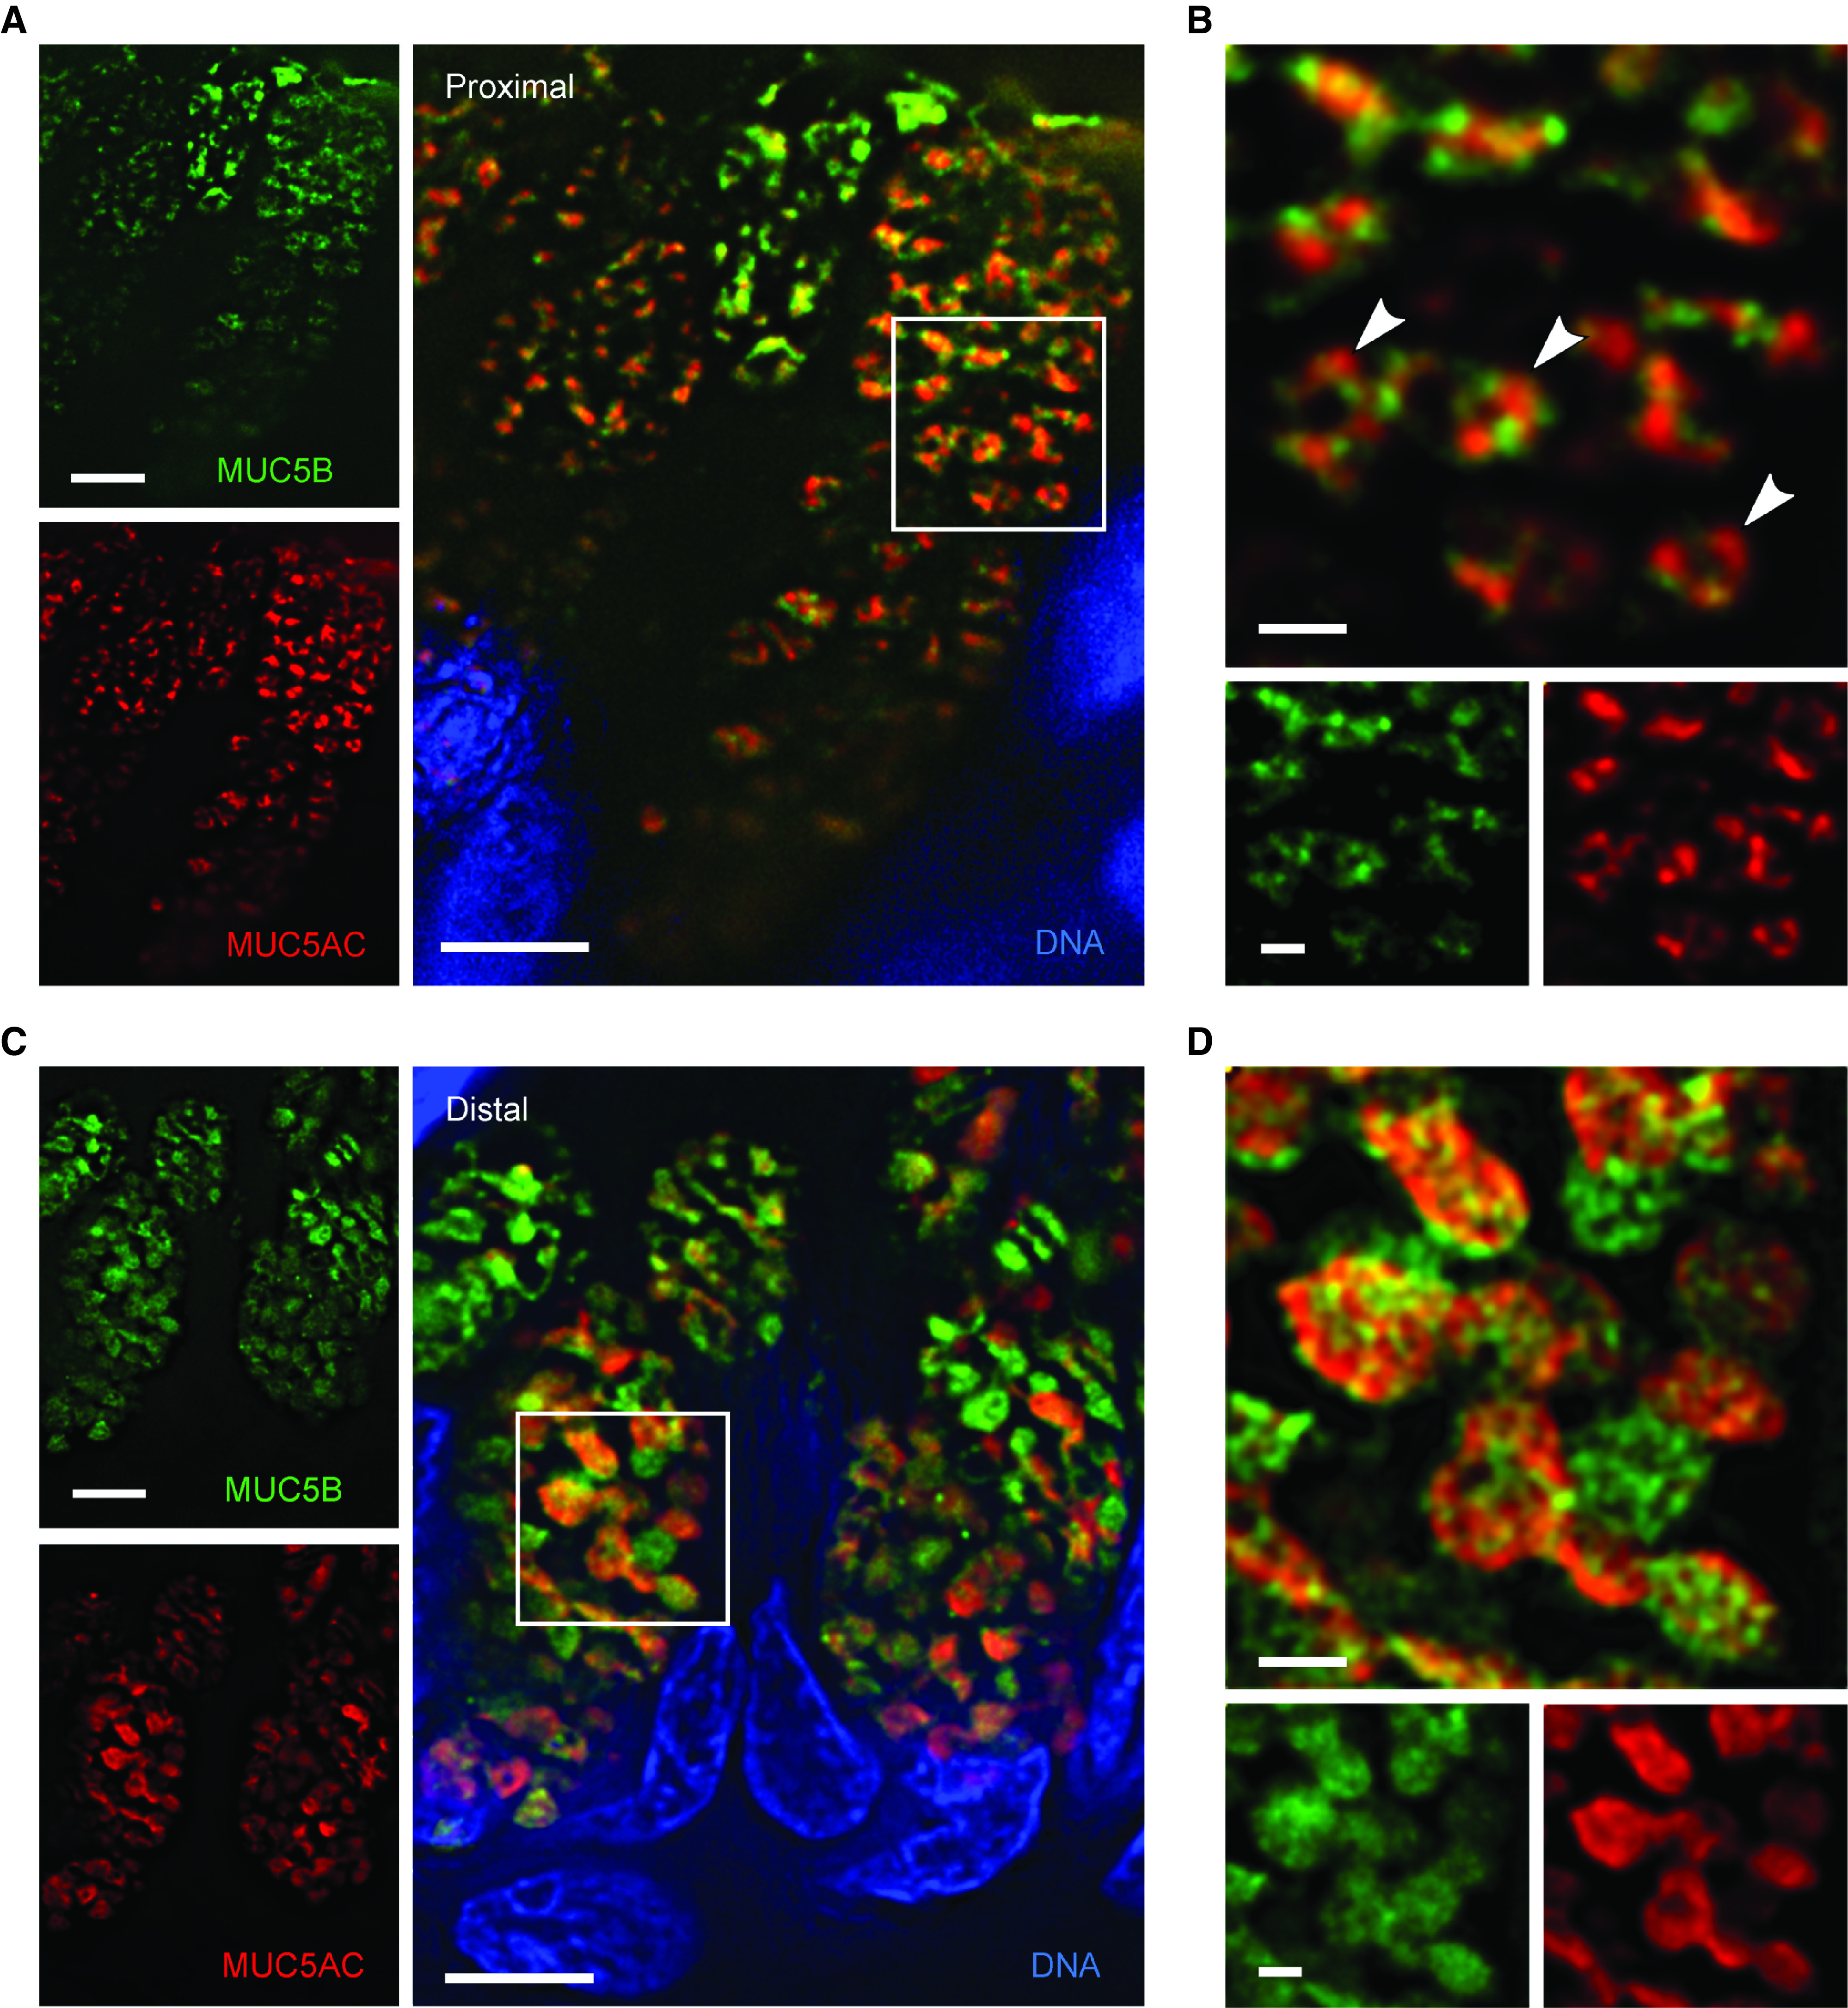
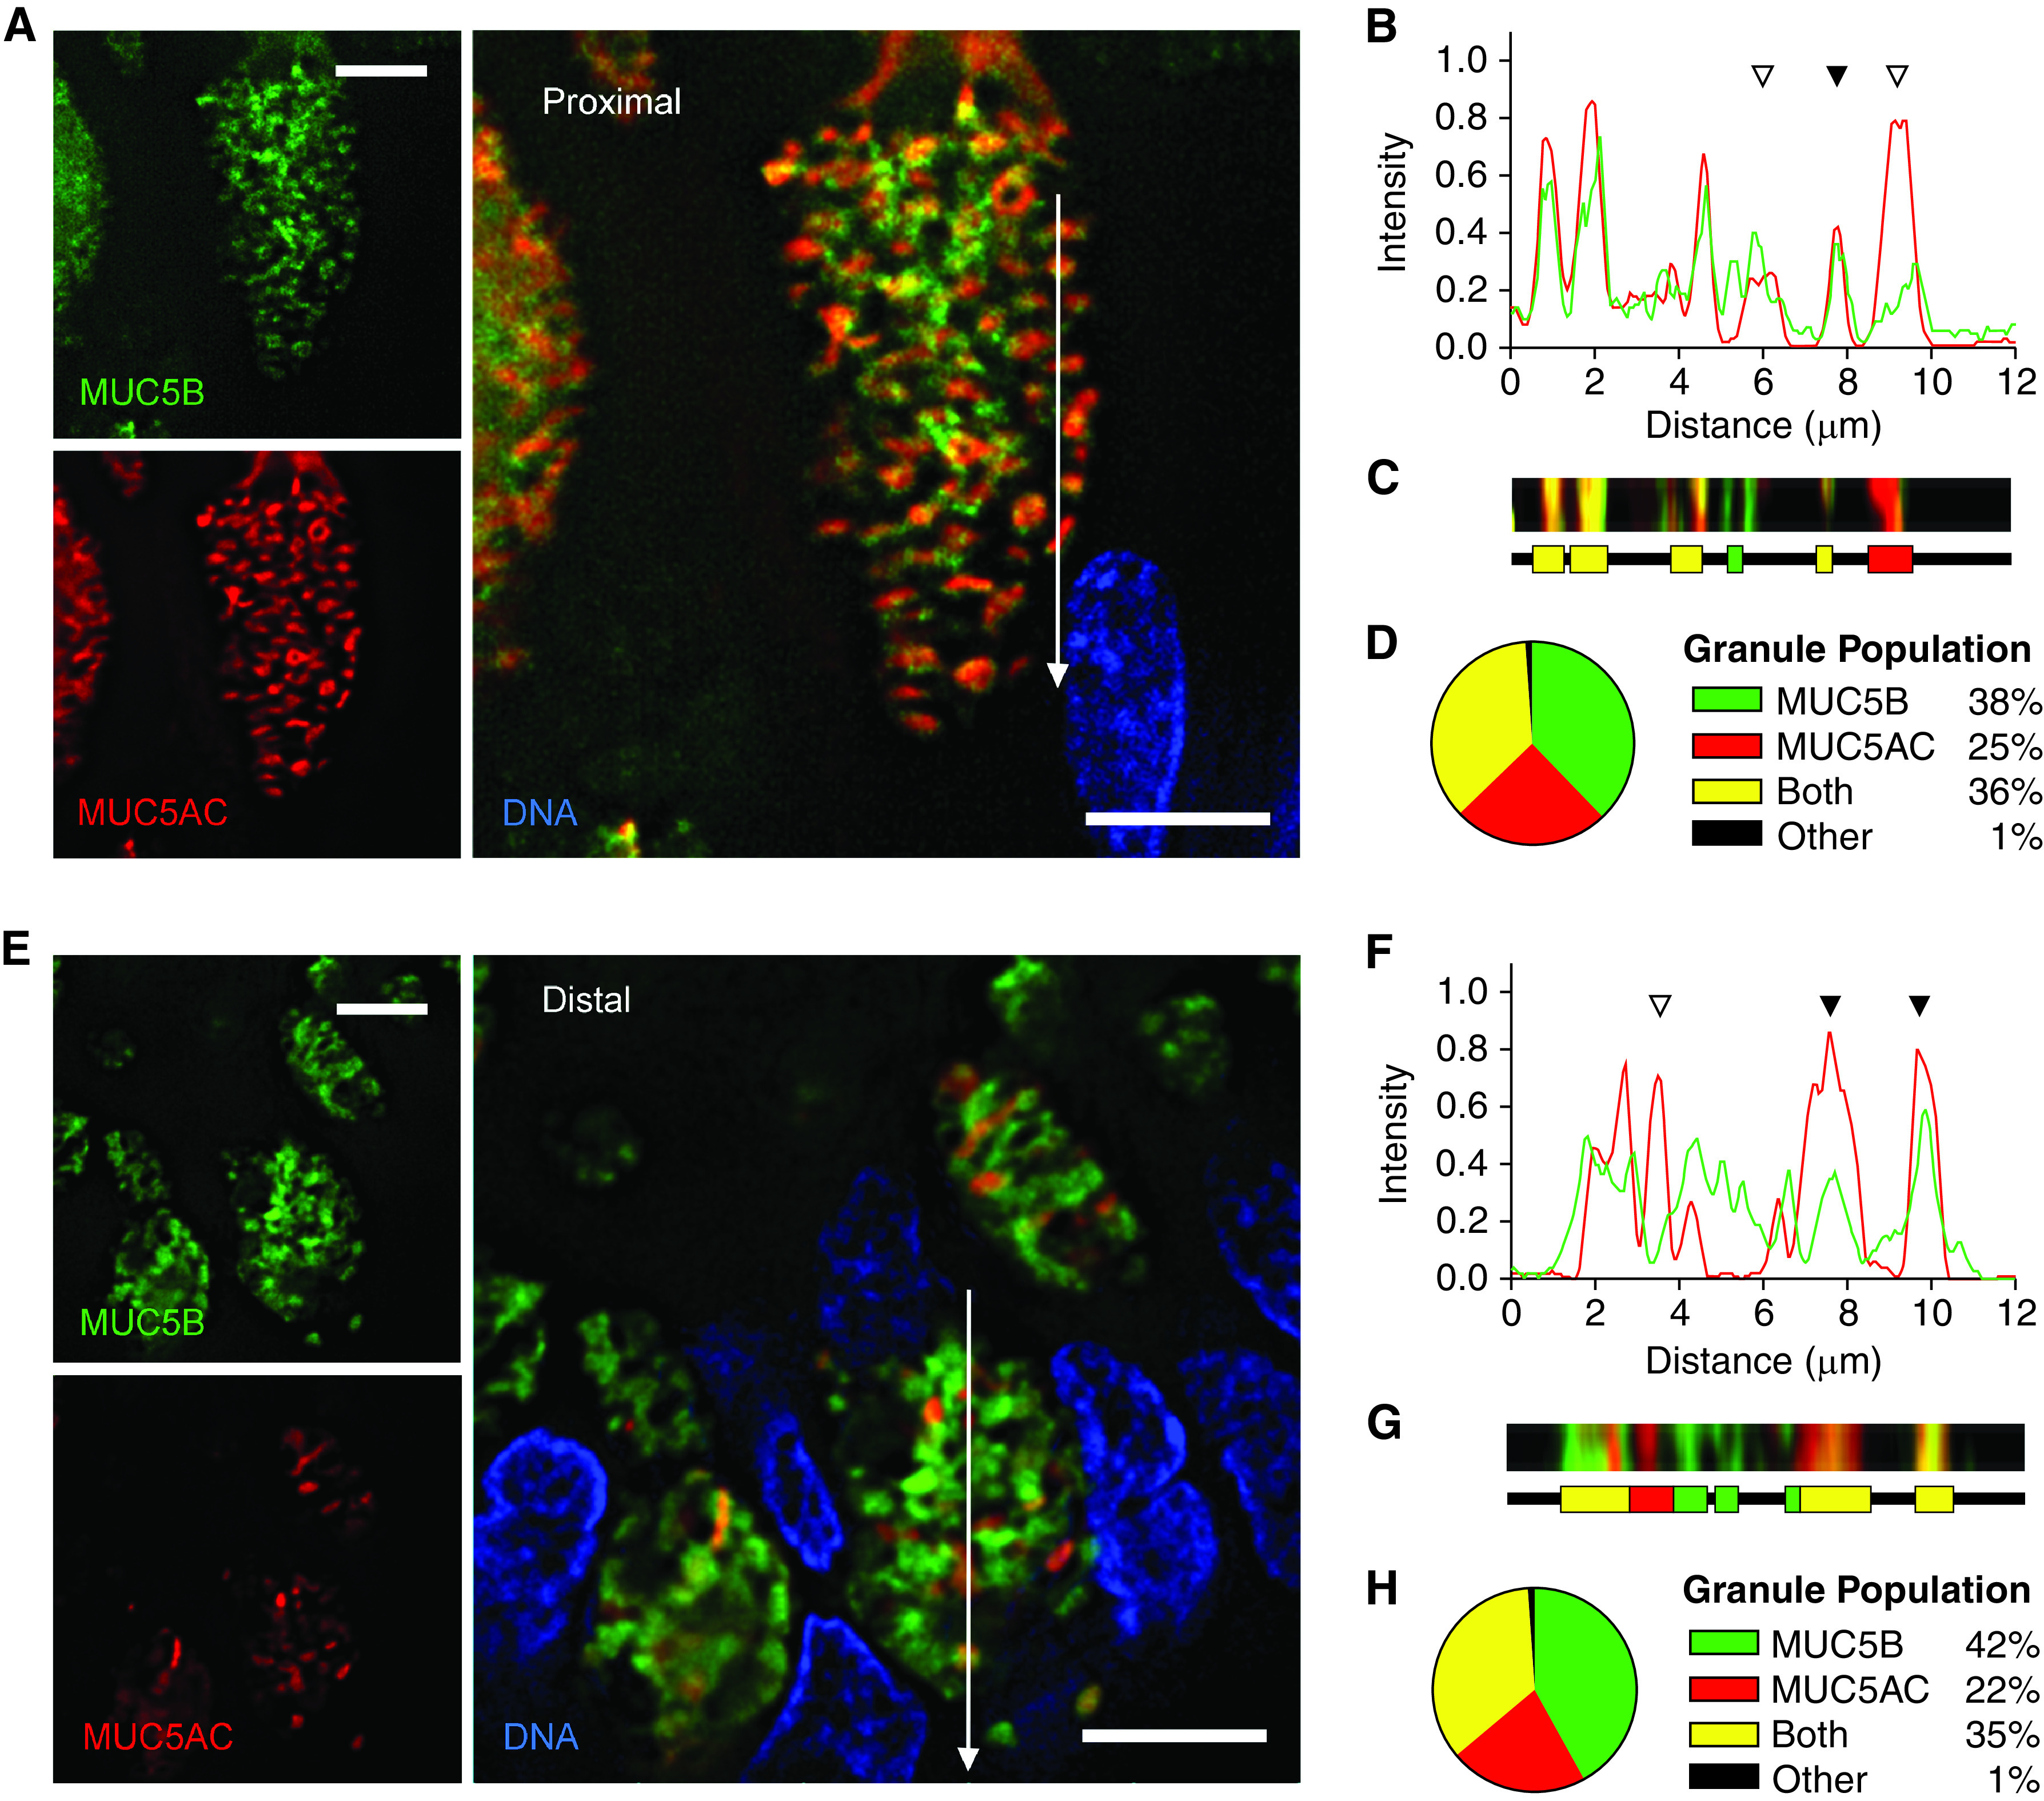
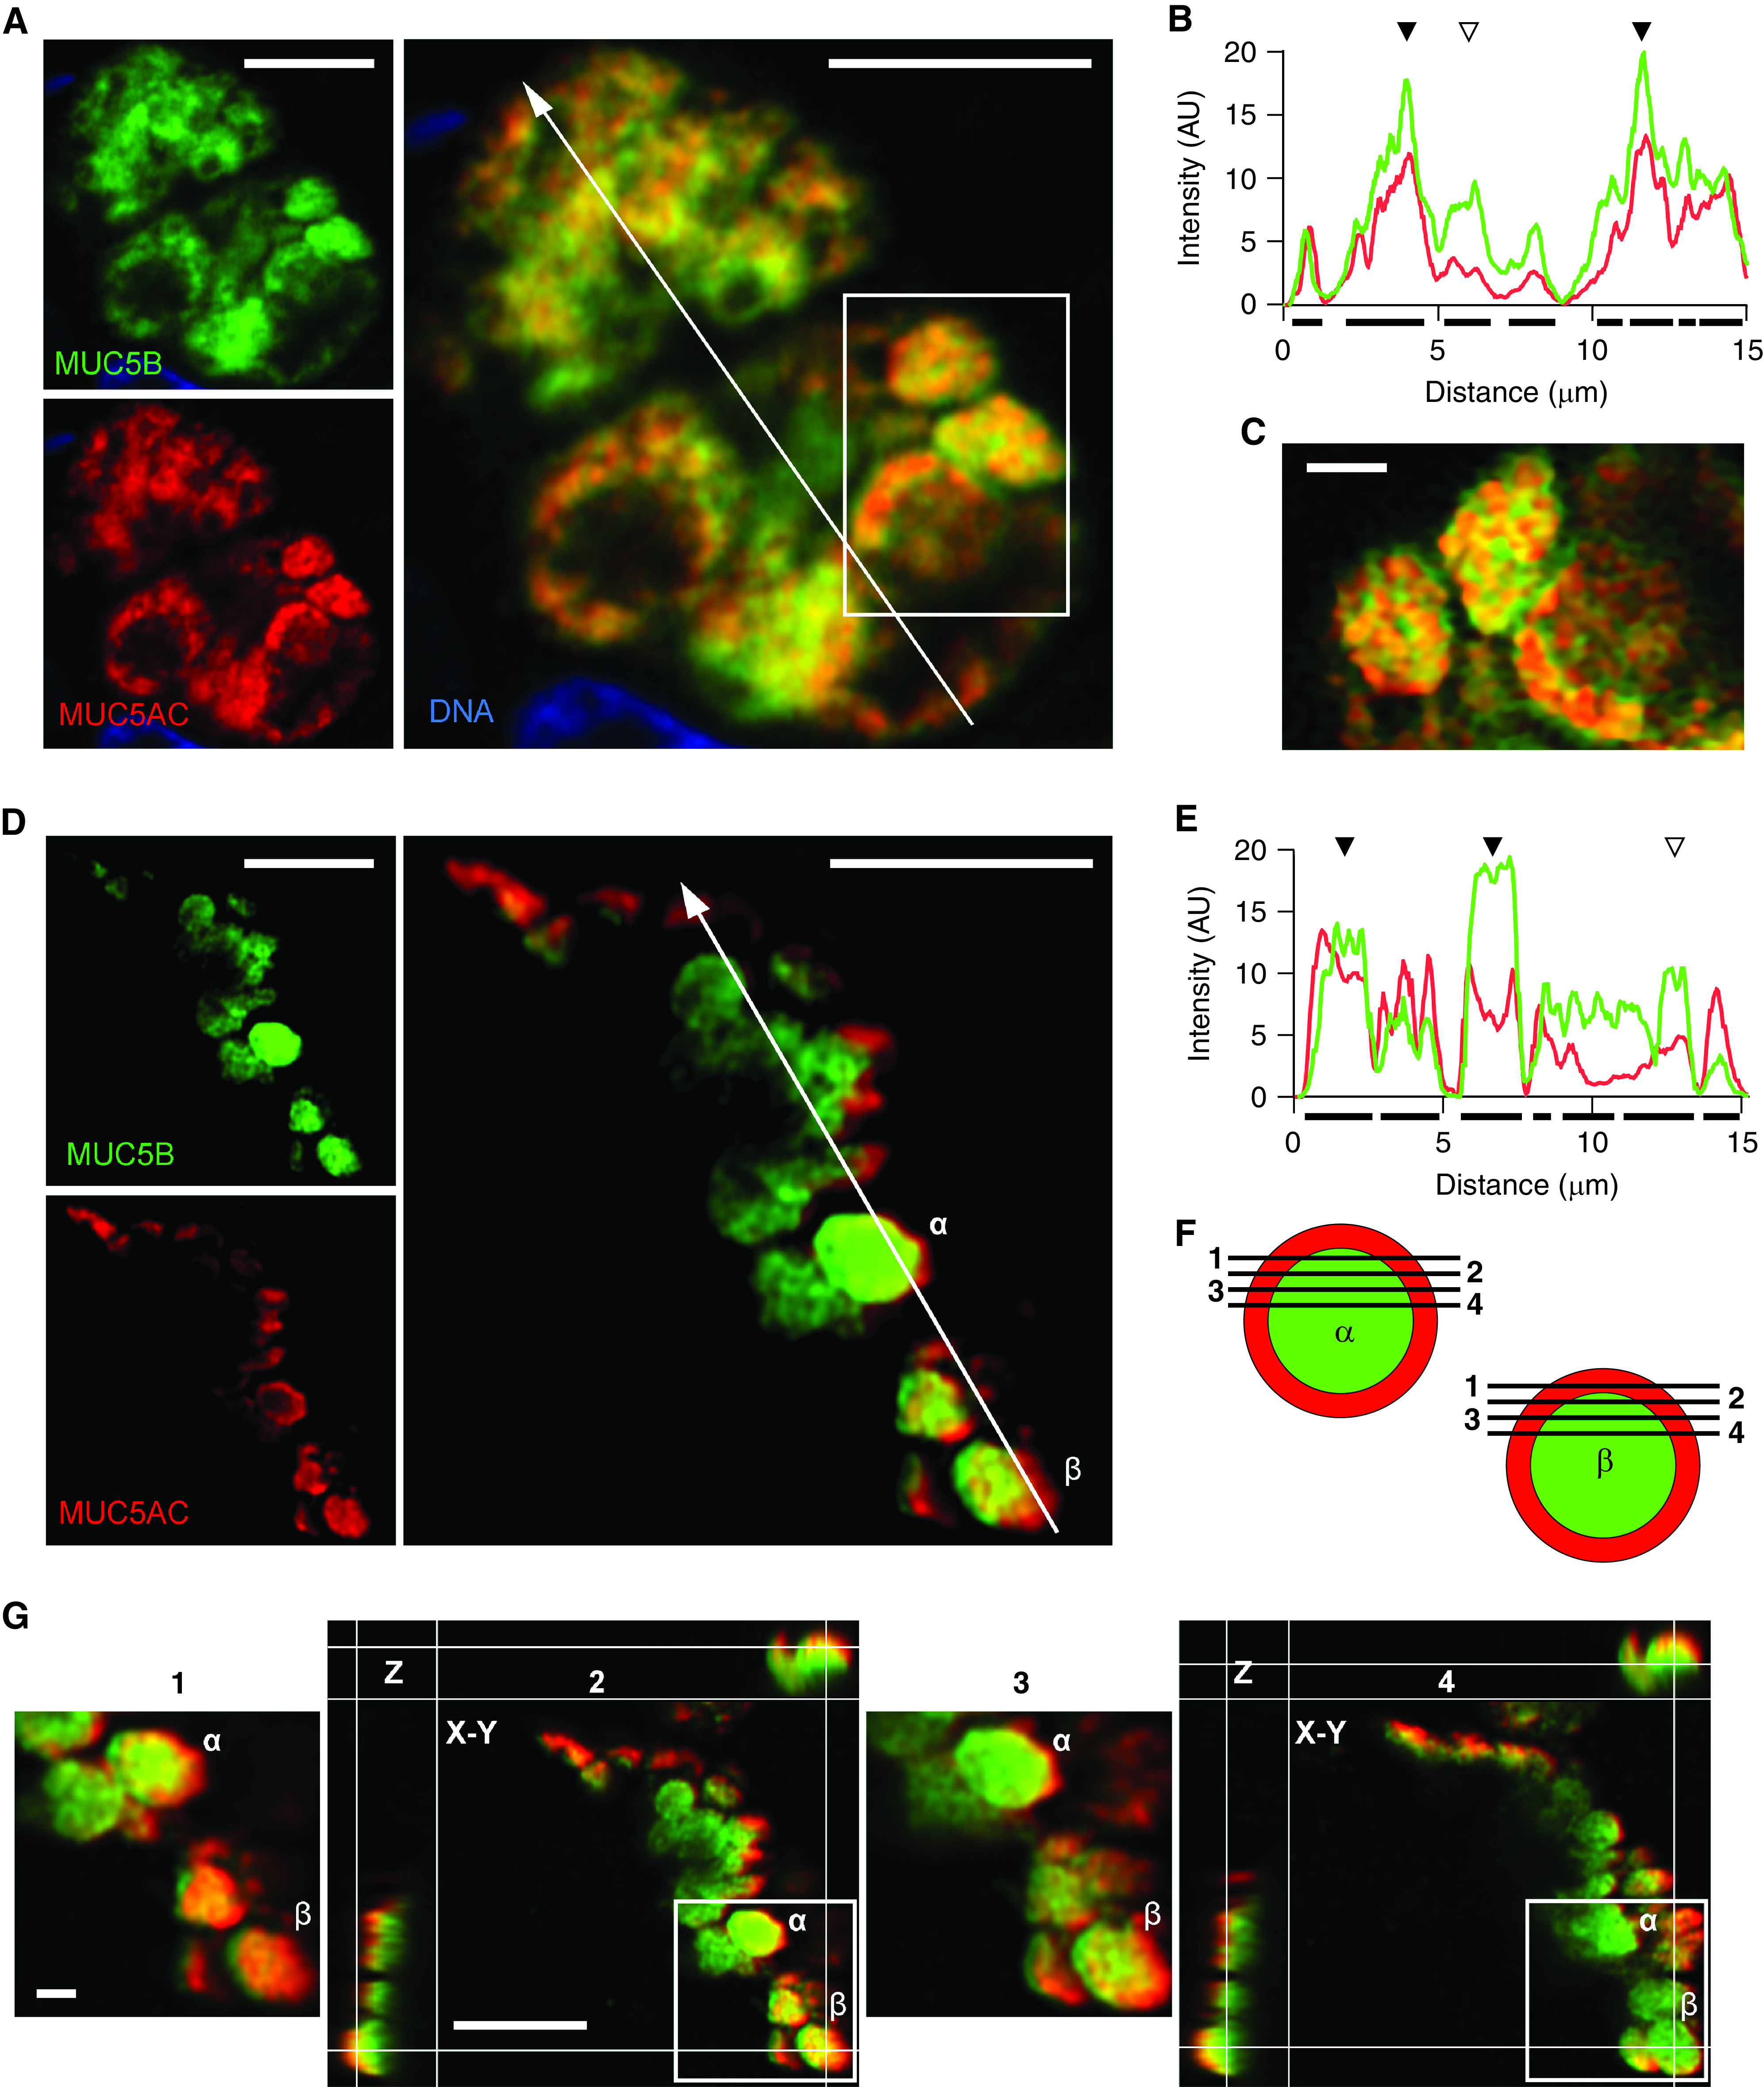
Rationale: MUC5AC (mucin 5AC, oligomeric gel-forming) and MUC5B (mucin 5B, oligomeric gel-forming) are the predominant secreted polymeric mucins in mammalian airways. They contribute differently to the pathogenesis of various muco-obstructive and interstitial lung diseases, and their genes are separately regulated, but whether they are packaged together or in separate secretory granules is not known. Objectives: To determine the packaging of MUC5AC and MUC5B within individual secretory granules in mouse and human airways under varying conditions of inflammation and along the proximal-distal axis. Methods: Lung tissue was obtained from mice stimulated to upregulate mucin production by the cytokines IL-1β and IL-13 or by porcine pancreatic elastase. Human lung tissue was obtained from donated normal lungs, biopsy samples of transplanted lungs, and explanted lungs from subjects with chronic obstructive pulmonary disease. MUC5AC and MUC5B were labeled with antibodies from different animal species or, in mice only, by transgenic chimeric mucin-fluorescent proteins and imaged using widefield deconvolution or Airyscan fluorescence microscopy. Measurements and Main Results: In both mouse and human airways, most secretory granules contained both mucins interdigitating within the granules. Smaller numbers of granules contained MUC5B alone, and even fewer contained MUC5AC alone. Conclusions: MUC5AC and MUC5B are variably stored both in the same and in separate secretory granules of both mice and humans. The high fraction of granules containing both mucins under a variety of conditions makes it unlikely that their secretion can be differentially controlled as a therapeutic strategy. This work also advances knowledge of the packaging of mucins within secretory granules to understand mechanisms of epithelial stress in the pathogenesis of chronic lung diseases.

Keywords: MUC5AC; MUC5B; airway mucins; club cells; mucus.


Figures

Figure 1.
Figure 1.
Mucin expression in mouse airways stimulated with cytokines. (A) Representative fields of periodic acid fluorescent Schiff (PAFS)-stained bronchial airways from naive (uninflamed) mice or mice stimulated with low or high doses of IL-1β or IL-13 to increase mucin production. Scale bars: main images, 25 μm; inset, 7 μm. Box plots show quantification of the intracellular mucin volume density (nl mucin/mm2 basement membrane) in the left axial bronchus (boxes show median and interquartile range, and whiskers show fifth and 95th percentiles; for IL-1β low vs. IL-13 low, P = 0.127; for IL-1β high vs. IL-13 high, P = 0.006; n = 5 mice per group). (B) Representative immunoblots of right lung lysates from the same mice as in A probed for MUC5AC (mucin 5AC, oligomeric gel-forming) and MUC5B (mucin 5B, oligomeric gel-forming). The total protein loaded for each sample was different to avoid saturation. Box plots show densitometric analyses of the immunoblots derived from standard curves for each probe (for MUC5B, IL-1β low vs. IL-13 low, P = 0.35; for MUC5B, IL-1β high vs. IL-13 high, P < 0.001; for MUC5AC, IL-1β low vs. IL-13 low, P = 0.99; for MUC5AC, IL-1β high vs. IL-13 high, P = 0.197; n = 5 mice per group). (C) Image of a mouse airway after a low dose of IL-13 and stained with antibodies against MUC5AC (red) and MUC5B (green). Arrowheads indicate secretory cells containing MUC5AC only (red), MUC5B only (green), or both mucins (yellow). Scale bar, 5 μm. Pie charts indicate fraction of mucin-containing cells in the axial bronchus that have MUC5AC only, MUC5B only, or both mucins after a low dose of IL-1β (618 cells, four mice) or IL-13 (808 cells, four mice). Statistical comparison is provided in Figure E1 for this and all subsequent pie charts except Figures 4C and E9. AU = arbitrary units.
Figure 2.
Figure 2.
High-resolution deconvolution immunofluorescence microscopy of mucin granules in mouse airways stimulated with cytokines. (A) Deconvolved image of a mouse airway secretory cell after IL-1β challenge and staining with antibodies against MUC5AC (red) and MUC5B (green). Scale bar, 5 μm. (B) Higher magnification of mucin granules from box in A containing both mucins. Scale bar, 1 μm. (C) Image of a mouse airway secretory cell after IL-13 challenge and stained with the same antibodies. Scale bar, 5 μm. (D) Higher magnification of mucin granules from box in C containing both mucins. Scale bar, 1 μm. MUC5AC = mucin 5AC, oligomeric gel-forming; MUC5B = mucin 5B, oligomeric gel-forming.
Figure 3.
Figure 3.
Quantitation of MUC5AC (mucin 5AC, oligomeric gel-forming) and MUC5B (mucin 5B, oligomeric gel-forming) colocalization within granules of mouse airways stimulated with cytokines. (A and E) Representative images of mouse airway secretory cells stimulated with IL-1β (A) or IL-13 (E), stained with antibodies against MUC5B (green) and MUC5AC (red), and imaged using deconvolution immunofluorescence microscopy. White lines indicate the area of measured pixel intensities plotted in B and F. Scale bar, 5 μm. (B and F) Line-scan analyses of pixels in the white lines in A and E are plotted as MUC5AC (red) and MUC5B (green) proportional fluorescence intensity (y-axis) versus the lengths of the white lines (x-axis). Fluorescence intensities were normalized for each image analyzed. Correspondence of the peaks for each line indicates colocalization of the mucins (solid triangles), whereas lack of correspondence indicates no colocalization (open triangles). (C and G) Color strips (top) correspond to the white lines but are three pixels wide and smoothed in Photoshop (Adobe) for visibility. Color ribbons (bottom) are generated after discarding the lowest third of pixel intensities in B and F to minimize background noise. Each color segment represents a counted granule. (D and H) Populations of all granules counted in the line-scan analyses. For IL-1β-treated mice: 730 granules, 83 cells, five mice; for IL-13 treated mice: 666 granules, 73 cells, five mice.
Figure 4.
Figure 4.
MUC5AC (mucin 5AC, oligomeric gel-forming) and MUC5B (mucin 5B, oligomeric gel-forming) colocalization in mouse airways stimulated with elastase. (A) Representative Airyscan image of a mouse airway secretory cell after elastase challenge and staining with antibodies against MUC5AC (red) and MUC5B (green). White line indicates the area of measured pixel intensities plotted in B. Scale bar, 5 μm. (B) Line-scan analysis of image in A is plotted as MUC5AC (red) and MUC5B (green) fluorescence intensity (y-axis) versus the length of the line (x-axis). Correspondence of the peaks for each line indicates colocalization of the mucins (solid triangles), whereas lack of correspondence indicates no colocalization (open triangles). Solid bars under the graph indicate individual granules. For additional examples, see Figure E4. (C) Populations of all granules counted in the line-scan analyses in samples stained with antibodies (top) or from reporter mice (bottom). Samples stained with antibodies: 440 granules, 44 cells, four mice; samples from reporter mice: 70 granules, seven cells, three mice; for samples stained with antibodies versus reporter mice, P < 0.001 by chi-square test. The complete data set of frequency distribution for granules imaged by immunofluorescence is shown in Figure E5. (D) Representative Airyscan image of an airway from a transgenic double-reporter mouse (EGFP-MUC5B/mCherry-MUC5AC) after elastase challenge. Scale bar, 5 μm. (E) High-magnification image of mucin granules from the same sample as D. Scale bars, 1 μm. (F) Another cell from a double-transgenic reporter mouse. White outline indicates area of higher magnification in G. Scale bar, 5 μm. (G) Higher magnification of the granules framed in F as well as the Z-plane reconstruction. Top panel, X-Z plane; right panel, Y-Z plane. Scale bar, 5 μm. (H) High magnification of a single granule from G showing X, Y, and Z planes. Scale bar, 1 μm. AU = arbitrary units; EGFP = enhanced green fluorescent protein.
Figure 5.
Figure 5.
MUC5AC (mucin 5AC, oligomeric gel-forming) and MUC5B (mucin 5B, oligomeric gel-forming) expression in human airways. (A) Representative image of a human proximal airway stained with antibodies against MUC5AC (red) and MUC5B (green), depicting adherent mucus (white arrowhead), surface airway epithelium (top inset), and submucosal glands (green arrowhead and right inset). Scale bar, 200 μm. Top inset shows a higher magnification image of surface airway epithelium; scale bar, 10 μm. Right inset shows a submucosal gland duct opening into the airway with MUC5B-predominant luminal mucus and a thin coating of MUC5AC proximally (yellow arrowhead); scale bar, 50 μm. (B) Pie charts indicate fractions of mucin-containing cells in the proximal and distal airways that have MUC5AC only, MUC5B only, or both mucins. Proximal airways: 1,021 cells, eight subjects; distal airways: 1,687 cells, nine subjects. (C) Distal airway (∼600 μm diameter) depicting furrows with epithelial cells containing predominantly MUC5AC (red arrowhead), MUC5B (green arrowhead), or both (yellow arrowhead). Scale bar, 100 μm. (D) A more distal airway (∼400 μm diameter) containing little intracellular mucin but with scattered cells expressing both mucins. Scale bars: image, 100 μm; inset, 15 μm.
Figure 6.
Figure 6.
High-resolution deconvolution immunofluorescence microscopy of mucin granules in human airways. (A) Deconvolved image of secretory cells in a human proximal airway stained with antibodies against MUC5AC (red) and MUC5B (green). Scale bar, 5 μm. (B) Higher magnification of the boxed region in A showing mucin granules containing both mucins and a central lucency (white arrowheads). Scale bar, 1 μm. (C) Deconvolved image of secretory cells in a human distal airway stained with the same antibodies. Scale bar, 5 μm. (D) Higher magnification of the boxed region in C. Scale bar, 1 μm. MUC5AC = mucin 5AC, oligomeric gel-forming; MUC5B = mucin 5B, oligomeric gel-forming.
Figure 7.
Figure 7.
Quantitation of MUC5AC (mucin 5AC, oligomeric gel-forming) and MUC5B (mucin 5B, oligomeric gel-forming) colocalization within granules of human airways. (A and E) Representative deconvolved images of human proximal (A) and distal (E) airways stained with antibodies against MUC5AC (red) and MUC5B (green). White lines indicate the area of measured pixel intensities plotted in B and F. Scale bars, 5 μm. (B and F) Line-scan analyses of pixels in the white lines in A and E are plotted as MUC5AC (red) and MUC5B (green) proportional fluorescence intensity (y-axis) versus the lengths of the white lines (x-axis). Fluorescence intensities were normalized for each image. Correspondence of the peaks for each line indicates colocalization of the mucins (solid triangles), whereas lack of correspondence indicates no colocalization (open triangles). (C and G) Color strips (top) correspond to the white lines but are three pixels wide and smoothed in Photoshop (Adobe) for visibility. Color ribbons (bottom) are generated after discarding the lowest third of pixel intensities in B and F to minimize background noise. Each color segment represents a counted granule. (D and H) Populations of all granules counted in the line-scan analyses. For human proximal airways: 4,988 granules, 360 cells, eight subjects; for human distal airways: 1,138 granules, 106 cells, nine subjects.
Figure 8.
Figure 8.
MUC5AC (mucin 5AC, oligomeric gel-forming) and MUC5B (mucin 5B, oligomeric gel-forming) colocalization in human airways imaged by Airyscan immunofluorescence microscopy. (A) Representative Airyscan image of a bronchial biopsy from a lung transplanted into a patient with cystic fibrosis, stained with antibodies against MUC5AC (red) and MUC5B (green). White line indicates the area of measured pixel intensities plotted in B. Scale bar, 5 μm. (B) Line-scan analysis of A is plotted as MUC5B (green) and MUC5AC (red) fluorescence intensity (y-axis) versus the length of the line (x-axis). Correspondence of the peaks for each line indicates colocalization of the mucins (solid triangles), whereas lack of correspondence indicates no colocalization (open triangles). Solid bars under the graph indicate localization of granules. (C) Higher magnification of mucin granules from box in A containing both mucins. Scale bar, 1 μm. (D) Representative Airyscan image of a bronchial biopsy from a lung transplanted into a patient with chronic obstructive pulmonary disease stained with the same antibodies. White line indicates the area of measured pixel intensities plotted in E. Two granules (α and β) are further analyzed in F and G. Scale bar, 5 μm. (E) Line-scan analysis of D is plotted as in B. Correspondence of the peaks for each line indicates colocalization of the mucins (solid triangles), whereas lack of correspondence indicates no colocalization (open triangles). (F) Schematic drawing of the separation of MUC5AC (red) and MUC5B (green) in the Z-plane (planes 1–4) of the two granules (α and β) in D. (G) Detailed analysis of the selected granules (α and β) at four different Z-planes (planes 1–4). Planes 2 and 4 show additional X-Z and Y-Z reconstruction. The granules show predominant MUC5AC staining (red) at their periphery and predominant MUC5B staining (green) in the center. Scale bar, 1 μm. AU = arbitrary units.

Comment in

References

    1. Fahy JV, Dickey BF. Airway mucus function and dysfunction. N Engl J Med . 2010;363:2233–2247. - PMC - PubMed
    1. Knowles MR, Boucher RC. Mucus clearance as a primary innate defense mechanism for mammalian airways. J Clin Invest . 2002;109:571–577. - PMC - PubMed
    1. Thornton DJ, Rousseau K, McGuckin MA. Structure and function of the polymeric mucins in airways mucus. Annu Rev Physiol . 2008;70:459–486. - PubMed
    1. Boucher RC. Muco-obstructive lung diseases. N Engl J Med . 2019;380:1941–1953. - PubMed
    1. Rose MC, Voynow JA. Respiratory tract mucin genes and mucin glycoproteins in health and disease. Physiol Rev . 2006;86:245–278. - PubMed

Publication types