. 2022 Jul 5;119(27):e2111262119.
doi: 10.1073/pnas.2111262119. Epub 2022 Jul 1.

C16orf72/HAPSTR1 is a molecular rheostat in an integrated network of stress response pathways

Affiliations

C16orf72/HAPSTR1 is a molecular rheostat in an integrated network of stress response pathways

David R Amici et al. Proc Natl Acad Sci U S A. .

Abstract

All cells contain specialized signaling pathways that enable adaptation to specific molecular stressors. Yet, whether these pathways are centrally regulated in complex physiological stress states remains unclear. Using genome-scale fitness screening data, we quantified the stress phenotype of 739 cancer cell lines, each representing a unique combination of intrinsic tumor stresses. Integrating dependency and stress perturbation transcriptomic data, we illuminated a network of genes with vital functions spanning diverse stress contexts. Analyses for central regulators of this network nominated C16orf72/HAPSTR1, an evolutionarily ancient gene critical for the fitness of cells reliant on multiple stress response pathways. We found that HAPSTR1 plays a pleiotropic role in cellular stress signaling, functioning to titrate various specialized cell-autonomous and paracrine stress response programs. This function, while dispensable to unstressed cells and nematodes, is essential for resilience in the presence of stressors ranging from DNA damage to starvation and proteotoxicity. Mechanistically, diverse stresses induce HAPSTR1, which encodes a protein expressed as two equally abundant isoforms. Perfectly conserved residues in a domain shared between HAPSTR1 isoforms mediate oligomerization and binding to the ubiquitin ligase HUWE1. We show that HUWE1 is a required cofactor for HAPSTR1 to control stress signaling and that, in turn, HUWE1 feeds back to ubiquitinate and destabilize HAPSTR1. Altogether, we propose that HAPSTR1 is a central rheostat in a network of pathways responsible for cellular adaptability, the modulation of which may have broad utility in human disease.

Keywords: network; signaling; stress.


Conflict of interest statement

The authors declare no competing interest.

Figures
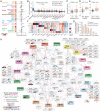
Fig. 1.
Fig. 1.
Deconvolution of cancer stress phenotypes to illuminate a global stress response network in human cells. (A) Essentiality score distributions of master stress response regulators across 739 cancer cell lines. Higher score indicates the gene is more essential for cellular fitness, where 1 is the average of genes considered essential for cell growth. TPM, transcripts per million; CNS, central nervous system. (B) Selective essentiality of ER stress factor XBP1 in secretory plasma cells. Each dot represents a cell line. (C–E) Oxidized (ox) glutathione levels, clear cell renal cell carcinoma (ccRCC) lineage, and proteasome (PSMD2) mutations associated with differential essentiality of oxidative, hypoxic, and proteotoxic master regulators, respectively. More examples in SI Appendix, Fig. S1B–Q. Mann–Whitney U test. (F) Specialized and general transcriptional responses to stress revealed by transcriptional profiling of MDA-MB-231 cells exposed to five distinct stressors. One example gene labeled per cluster. Log2 fold change (L2FC) versus vehicle (VEH)/DMSO. CPA, cyclophosphamide; CoCl2, cobalt chloride; SS, serum starvation; HS, heat shock; 2DG, 2-deoxyglucose. (G) Genes coessential with at least two stress master regulators (n = 146) are more likely to be dynamically regulated at the transcript level (differential [Diff.] expression, false discovery rate < 0.01) by acute stress. Two-tailed KS test. Stressors as in F. (H) Integrating stress-transcriptomic data with coessentiality data reveals a global stress response network in human cells. Note legend in lower left. All 21 master regulators in A and 146 stress-coessential genes in G are included. Canonical signaling modules form outside of the network, and crosstalk genes link modules. Positive and negative correlates on exterior of network are grouped and labeled with +/−. Download the network for interactive exploration at https://mendillolab.org/stressnet. DMSO, dimethyl sulfoxide; UPR, unfolded protein response.
Fig. 2.
Fig. 2.
Example of signaling relationships extracted from the global stress response network. Discussion of each highlighted pathway is present in either the main text or SI Appendix, Supplemental Discussion. (A) Examples of upstream regulators and downstream targets of specialized stress response pathways. OH, hydroxyl; Ub, ubiquitin. (B) Examples of crosstalk factors located in the center of the network, which have known roles in the integration of specialized stress responses. CoCl2, cobalt chloride; L2FC, Log2 fold change; UPR, unfolded protein response.
Fig. 3.
Fig. 3.
Analysis of putative stress network hubs identifies the conserved and multistress-inducible protein C16orf72/HAPSTR1. (A) The stress phenotype of cancer cells reflected in relative essentiality of the indicated stress response master regulators. Example cell lines on Right. Polar graph radius indicates the line’s relative dependence on the indicated stress response factors (versus average cell line). Range −3 to +3 SDs. Project Achilles data. (B) Filtering the stress network for genes with central hub characteristics (essential in 2+ stress contexts from Fig. 1H; multistress inducible based on transcription in 1 h and combinatorial stress dose–response based on A nominates C16orf72/HAPSTR1. (C) HAPSTR1 contains a conserved domain of unknown function (DUF4588), including a particularly conserved region (highlighted), as well as a C-terminal NLS. (D) HAPSTR1 essentiality increases with the number of stress dependencies of a given cell line, as in A. Pearson P value. (E) HAPSTR1 induction by stress (MDA-MB-231). CPA, 100 µM; SS, 0% FBS; HS, 42 °C × 1 h; 2DG: 10 mM. RNA-seq, ***FDR < 0.005. Mean ± SEM. (F) HAPSTR1 overexpression in tumors versus matched normal tissue (multivariate ANOVA). PAAD, pancreatic adenocarcinoma; GBM, glioblastoma; LGG, low-grade glioma; ESCA, esophageal carcinoma; STAD, stomach adenocarcinoma. **FDR < 0.005, *FDR < 0.05. Data from GEPIA2. (G) siRNAs targeting one or both HAPSTR1 isoforms validate the protein expression of two HAPSTR1 isoforms (long [L] and short [S]). ns, nonspecific. Immunoblot, 293T. (H) Estimated HAPSTR1 protein abundance (both isoforms) in nontumorigenic (MCF10A) and tumorigenic (all other) cell lines (SI Appendix, Fig. S5 A–D). (I) Stress-dynamicity of HAPSTR1 protein. Representative of n > 3; 16-h treatments: ATRi, AZD6738 1 µM; SS, 0% serum; PQ, paraquat 1 µM; CPA, 100 µM; NAEi, MLN4924 500 nM; MG132, 1 µM. CoCl2, cobalt chloride 250 µM; DMSO, dimethyl sulfoxide; L2FC, Log2 fold change.
Fig. 4.
Fig. 4.
HAPSTR1 confers resilience to diverse stressors in vitro and in vivo. (A) Transcriptomic consequences of HAPSTR1 siRNA (siHAPSTR1), log2 fold change (L2FC) vs. nontargeting control siRNA (siNT), in three cell lines with varying HAPSTR1 essentiality scores (shown below line name; SI Appendix, Fig. S6A and B). Gene set enrichment analysis terms (false discovery rate < 1e-5) are highlighted in each cluster. K-means, K = 6. Any gene differentially expressed in any line included. (B) HAPSTR1 confers multistress resilience to breast cancer cells. Viability assessed by CellTiterGlo luminescence in arbitrary units (Lum AU). Drugs sorted by mean effect difference across doses. ActD, actinomycin D. (C) Live cell imaging traces of WT and HAPSTR1-depleted cells after exposure to stressors; n = 3, two-tailed t test of area under curve values. CoCl2, 250 µM, redox stress; cyclophosphamide, 50 µM, genotoxic stress; SS, 0% serum, nutrient and ER stress. (D) HAPSTR1 is a hit in many recent whole-genome CRISPR-Cas9 sensitization screens (–25). Bottom line indicates genome-wide ranked list of genes whose loss protects (KO Most Protected; left of line) to genes whose loss sensitizes (KO Most Sensitized; right of line) in a particular screen condition. The rank of HAPSTR1 in each screening condition is indicated. That is, HAPSTR1 loss sensitizes cells to most stressors/agents shown but promotes fitness in the context of Mycobacterium tuberculosis (MTB) infection. (E and F) Normal reproduction and size of HAPSTR1/haps-1 KO C. elegans. (G–J) haps-1 KO nematodes have reduced survival, adaptability, and reproductive success after exposure to stressors. Log-rank (H) or two-tailed t test. *P < 0.05, **P < 0.01; ns: not significant (P ≥ 0.05). CPT, camptothecin 70 μM × 6 h. NAEi: MLN4924, 100 μM × 24 h. Paraquat, 8 mM × duration indicated. CoCl2, cobalt chloride; Cyclophos, cyclophosphamide; DMSO, dimethyl sulfoxide (VEH); L2FC, Log2 fold change. Error bars represent SEM.
Fig. 5.
Fig. 5.
HAPSTR1 oversees cell-autonomous and paracrine stress signaling. (A) Effect of HAPSTR1 depletion on canonical stress response proteins in different stress contexts. Note: HAPSTR1 siRNA (siHAPSTR1) #3 depletes long and short HAPSTR1 isoforms, whereas #4 depletes only the long isoform. U2OS. After 48 h of siRNA, 16-h drug treatments. SS, 0% FBS; CPA, 100 µM; Heat, 43C × 2 h; CoCl2, (cobalt chloride 250 µM); ATRi, AZD6738 1 µM; NAEi, MLN4924 500 nM. Blots sliced between CoCl2 and Heat to facilitate antibody incubation but are the same gel/membrane/image exposure. Pathways (Left): ISR, DDR, DNA damage response; UPR, unfolded protein response. Relative quantitation shown, with “-” indicated where no confident band could be detected even at high exposures. (B–D) HAPSTR1 depletion rewires the transcriptomic response to three stressors. MDA-MB-231. Red text: stressor-specific changes. Data normalized to “nonstressed” nontargeting siRNA (siNT) and vehical (DMSO; VEH). I.e., the siNT samples [leftmost columns in each heatmap] indicate the “normal” response of the gene to that stressor). Gene set enrichment analysis terms indicated enriched at false discovery rate < 1e-5. AA, amino acid; carb, carbohydrate; EMT, epithelial to mesenchymal transition. (E and F) Examples of stressor-specific cell-autonomous (E) and broadly regulated chemokine (F) transcripts. ***FDR < 1e-5. (G and H) Chemokine abundance in conditioned media from HAPSTR1-depleted MDA-MB-231 (G) or HeLa (H) as quantified by array. All cells kept in serum-free media for 36 h, with indicated HeLa cells also treated with CoCl2, 250 μΜ. FBS, fetal bovine serum. (I) Transient transfection of the model chemokine PPIA-FLAG causes its secretion in WT but not HAPSTR1-depleted HeLa cell. (J) Effect of conditioned media (CM) from WT or HAPSTR1-depleted cells on the migration of cells across a scratch wound in serum-free media, MDA-MB-231; two-tailed t test, *P < 0.05, **P < 0.01, ***P < 0.005. DMSO, dimethyl sulfoxide; IL, interleukin; L2FC, Log2 fold change. Bar graphs are mean ± SEM.
Fig. 6.
Fig. 6.
A conserved interaction between HAPSTR1 and HUWE1 promotes HAPSTR1 polyubiquitination and degradation. (A) HUWE1 is the dominant HAPSTR1 interacting protein by IP-MS in nonstress (DMSO) and stress (proteasome inhibitor MG132, 5 µM × 6 h) contexts. (B) Reciprocal coimmunoprecipitation (co-IP) of endogenous HUWE1 and HAPSTR1-FLAG. (C) Purified MBP-HAPSTR1 isolates HUWE1 from HeLa whole cell lysates (WCL). (D) HAPSTR1’s yeast ortholog, YJR056C, was found to be the top interacting partner for yeast HUWE1/TOM1 in a recent proteomic study (27). (E) Endogenous HUWE1 co-IPs are enriched for endogenous HAPSTR1 long (L) and short (S) isoforms but not the nonspecific (ns) species recognized on input immunoblots. (F) Long and short HAPSTR1 isoform co-IPs demonstrate that both can independently bind HUWE1 and that the isoforms can oligomerize. 293T, transient transfections. (G) HAPSTR1 domain mapping experiments summarized (SI Appendix, Fig. S8). Domains and mutated residues color highlighted. (H) Highly conserved residues within HAPSTR1 mediate HUWE1 binding and oligomerization. 293T. L, long isoform. (I) Predicted structure of HAPSTR1 as a dimer using AlphaFold2 (28, 29). Key residues highlighted. Note that certain disordered/low-confidence regions (represented by stringlike appearance) continue just out of frame (SI Appendix, Fig. S8D). (J) Domain schematic of HUWE1 (30) and identification of a HAPSTR1-binding interface on HUWE1 by reciprocal co-IP (SI Appendix, Fig. S8). (K) HUWE1 siRNA (siHUWE1) does not control HAPSTR1 mRNA. (L) HUWE1 destabilizes HAPSTR1 protein. Representative experiment of n > 3. CHX, cycloheximide 40 µg/mL. (M), Quantification of HAPSTR1 stability in cells with or without HUWE1. (N) HUWE1 promotes ubiquitination of HAPSTR1-FLAG (HAPSTR1-F) in vivo. Denaturing co-IP, 10 μM MG132 × 6 h, 293T. (O) Transient expression of active site mutant (C4341S) HUWE1 causes a dominant-negative (dn) effect stabilizing HAPSTR1 and canonical HUWE1 substrates DDIT4 and MCL1. (P) HAPSTR1 mutants are protected from HUWE1-mediated destabilization in a manner aligned with their ability to bind HUWE1. Stable HAPSTR1-HA 293T cell lines, 72-h siRNA. DMSO, dimethyl sulfoxide; GFP, green fluorescent protein; Ig, immunoglobulin; IP, immunoprecipitation; L2FC, Log2 fold change.
Fig. 7.
Fig. 7.
HAPSTR1 cooperates with HUWE1 to control stress signaling. (A and B) HUWE1 is the most coessential gene for HAPSTR1 (A), and this relationship is markedly strong compared with all other correlations (Corr) in the genome (B). (C) Phenotypic convergence based on differentially expressed gene (DEG) overlap of HAPSTR1 and HUWE1 knockdown RNA-seq data in 231 cells. Gene set enrichment analysis terms shown (false discovery rate [FDR] < 1e-5). K-means clustering, K = 7. (D) HUWE1 depletion recapitulates the effects of HAPSTR1 loss on model signaling proteins, despite increasing HAPSTR1 levels. U2OS. L, long; S, short. *PPIA-FLAG (PPIA-F) was transfected in separate experiments. Representative blots, n ≥ 3. (E) For five model signaling proteins, quantification of the effect of HAPSTR1 or HUWE1 depletion in cells chronically depleted of the other factor, as in SI Appendix, Fig. S9B, compared with acute knockdown in WT cells. *P < 0.05, **P < 0.005, two-tailed t test. ns, not significant. (F) Genes differentially expressed (RNA-seq FDR < 0.05) in 293T cells 24 h after transient overexpression of HAPSTR1 are not regulated by HAPSTR1 overexpression in cells lacking HUWE1. (G) Schematic model of the HAPSTR1–HUWE1 pathway. GFP, green fluorescent protein; L2FC, Log2foldchange.

References

    1. Fulda S., Gorman A. M., Hori O., Samali A., Cellular stress responses: Cell survival and cell death. Int. J. Cell Biol. 2010, 214074 (2010). - PMC - PubMed
    1. Costa-Mattioli M., Walter P., The integrated stress response: From mechanism to disease. Science 368, eaat5314 (2020). - PMC - PubMed
    1. Galluzzi L., Yamazaki T., Kroemer G., Linking cellular stress responses to systemic homeostasis. Nat. Rev. Mol. Cell Biol. 19, 731–745 (2018). - PubMed
    1. Luo J., Solimini N. L., Elledge S. J., Principles of cancer therapy: Oncogene and non-oncogene addiction. Cell 136, 823–837 (2009). - PMC - PubMed
    1. Tsherniak A., et al. , Defining a cancer dependency map. Cell 170, 564–576.e16 (2017). - PMC - PubMed

Publication types