. 2022 Jul 1;17(7):e0267248.
doi: 10.1371/journal.pone.0267248. eCollection 2022.

Integration of bioassay and non-target metabolite analysis of tomato reveals that β-carotene and lycopene activate the adiponectin signaling pathway, including AMPK phosphorylation

Affiliations

Integration of bioassay and non-target metabolite analysis of tomato reveals that β-carotene and lycopene activate the adiponectin signaling pathway, including AMPK phosphorylation

Shinsuke Mohri et al. PLoS One. .

Abstract

Adiponectin, an adipokine, regulates glucose metabolism and insulin sensitivity through the adiponectin receptor (AdipoR). In this study, we searched for metabolites that activate the adiponectin signaling pathway from tomato (Solanum lycopersicu). Metabolites of mature tomato were separated into 55 fractions by liquid chromatography, and then each fraction was examined using the phosphorylation assay of AMP-protein kinase (AMPK) in C2C12 myotubes and in AdipoR-knockdown cells by small interfering RNA (siRNA). Several fractions showed AMPK phosphorylation in C2C12 myotubes and siRNA-mediated abrogation of the effect. Non-targeted metabolite analysis revealed the presence of 721 diverse metabolites in tomato. By integrating the activity of fractions on AMPK phosphorylation and the 721 metabolites based on their retention times of liquid chromatography, we performed a comprehensive screen for metabolites that possess adiponectin-like activity. As the screening suggested that the active fractions contained four carotenoids, we further analyzed β-carotene and lycopene, the major carotenoids of food. They induced AMPK phosphorylation via the AdipoR, Ca2+/calmodulin-dependent protein kinase kinase and Ca2+ influx, in addition to activating glucose uptake via AdipoR in C2C12 myotubes. All these events were characteristic adiponectin actions. These results indicated that the food-derived carotenoids, β-carotene and lycopene, activate the adiponectin signaling pathway, including AMPK phosphorylation.


Conflict of interest statement

In this study, the authors received funding by KAGOME CO., LTD. This does not alter the authors adherence to PLOS ONE policies on sharing data and materials.

Figures

Fig 1
Fig 1. Assessment of adiponectin-like activity of tomato extract.
(A) Effect of the hydrophilic tomato extract on AMPK phosphorylation in C2C12 myotubes. (B) Effect of the hydrophobic tomato extract on AMPK phosphorylation in C2C12 myotubes. (C) Effect of the hydrophobic tomato extract on AMPK phosphorylation in the presence and absence of AdipoR siRNA. In (A)–(C), C2C12 myotubes were incubated with the extract for 10 min, then total protein was extracted from cell lysates of the treated C2C12 myotubes and analyzed by western blotting. Data are presented as mean ± standard error of the mean (SEM) from independent experiments (n = 4–5/group). **p < 0.01 vs. control. #p < 0.05 vs. hydrophobic extract alone. pAMPK, phosphorylated AMPK; AMPK, total AMPK; ext, extract; siRNA, AdipoR siRNA.
Fig 2
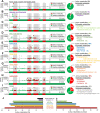
Fig 2. Assessment of the adiponectin-like activity of tomato-derived fractions.
(A) Effect of the HPLC fractions of the hydrophobic tomato extract on AMPK phosphorylation in C2C12 myotubes. The HPLC fractions (no. 1–55) were separated using the same analytical conditions as those typically used for metabolomics (see details in the Methods section). (B) Effect of the selected HPLC fractions on AMPK phosphorylation in C2C12 myotubes in the absence and presence of AdipoR siRNA. (C) Heatmap of the AMPK phosphorylation ratio from Fig 2A. The phosphorylation ratios were calculated using the following equation: [(ratio for treated sample/ratio for control sample) × 100] –100. AMPK phosphorylation was normalized to the amount of AMPK. (D) Heatmap of the inhibition ratio of AMPK phosphorylation in Fig 2B. The inhibition ratio by AdipoR siRNA was calculated using the following equation: 100 –[(ratio for cells transfected with AdipoR siRNA/ratio for mock-transfected cells) × 100]. AMPK phosphorylation was normalized to the amount of AMPK. (E) Selected retention times (shown in red) for the primary target ranges of the fractions containing metabolites that activate adiponectin signaling pathway. Cont, control; pAMPK, phosphorylated AMPK; AMPK, total AMPK.
Fig 3
Fig 3. Screening for metabolites possessing adiponectin-like activity by the integration of the biological assay and non-targeted metabolite analysis.
(A) Metabolome of the hydrophobic tomato extract. Left: Plot of the intensity and retention time of the annotated metabolites in the hydrophobic tomato extract. Each dot colour indicates the metabolite category. Right: The number of annotated metabolites in the hydrophobic tomato extract. Each colour indicates the metabolite category (For further details of annotated metabolites, see S1 Table). (B) Screening of the tomato metabolome targeting adiponectin-like activity by the integrated approach. Top: Plot of the intensity and retention time of the tomato metabolites. Grey zones correspond to retention times with adiponectin-like activity, and the red and green dots indicate active and inactive metabolites, respectively. Bottom: The range of retention times exhibiting adiponectin-like activity. The heatmap shows the active (red) or inactive (green) retention time ranges. Right: The number of screened active and inactive metabolites.
Fig 4
Fig 4. Screening for metabolites possessing adiponectin-like activity by the integration of the biological assay and non-targeted metabolite analysis in each structural category.
(A)–(I) Left: Integration of the biological assay and non-targeted metabolite analysis in each structural category; (A), amino acids, sugars and nucleic acids; (B), alkaloids and flavonoids; (C), free fatty acids (FFAs); (D), diacylglycerols (DGs), triacylglycerols (TGs) and phospholipids (PLs); (E), isoprenoids; (F), other lipids; (G), sterol lipids; (H), carotenoids and (I), others. Right: The number of screened active and inactive metabolites. The proportion of active metabolites and representative estimated metabolites annotated by non-targeted metabolite analysis are provided (see S1 Table for further details). (J) The proportion and number of active metabolites for each structure category.
Fig 5
Fig 5. Profiling of screened tomato carotenoids in terms of their metabolic pathway and chemical nature.
(A) The biosynthesis pathway of carotenoids based on the KEGG database. The carotenoids denoted in red font are metabolites annotated in tomato extract by screening. Carotenoids denoted by asterisks were selected for further analysis. (B) Structures of the carotenoids chosen for detailed screening based on the biosynthesis pathway of carotenoids. (C) Chemical properties of the selected carotenoids for further analysis. Left: Heatmap of the peak intensity of carotenoids in the tomato metabolome. The peak intensity of the selected carotenoids is denoted by asterisks. Right: The exact mass, predicted molecular formula and estimated metabolite corresponding to each peak on the heatmap on the left. Bottom: Heatmap of the retention time range with adiponectin-like activity. Red, active ranges; green, inactive ranges. (D) The active carotenoids screened for further analysis. Top: Plot of the intensity and retention time of the tomato carotenoids. Grey zones denote retention times exhibiting adiponectin-like activity. Red dots denote active metabolites. Green dots denote inactive metabolites. White dots with compound names indicate carotenoids selected for further analysis.
Fig 6
Fig 6. Identification of metabolite that activate adiponectin signaling pathway in tomato.
(A) Effect of screened carotenoids on AMPK phosphorylation in C2C12 myotubes. Geranylgeraniol and retinol were examined as a precursor and degradation product of carotenoids, respectively. C2C12 myotubes were incubated with each carotenoid (1 μM), geranylgeraniol (1 μM) or retinol (1 μM) for 10 min. Total cell protein was extracted from the treated C2C12 myotubes and analyzed by western blotting. (B)–(F) Extracted ion chromatograms of (B) phytoene (m/z = 545.508), (C) phytofluene (m/z = 543.492), (D) β-carotene (m/z = 537.445), (E) torulene (m/z = 535.429) and (F) lycopene (m/z = 537.445). Data are presented as mean ± SEM from independent experiments (n = 6/group). *p < 0.05, **p < 0.01 vs. control. pAMPK, phosphorylated AMPK; AMPK, total AMPK.
Fig 7
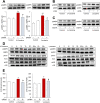
Fig 7. Evaluation of the effect of identified carotenoids on the adiponectin signaling pathway.
(A)(C) Effect of β-carotene or lycopene on AMPK phosphorylation in C2C12 myotubes in the presence and absence of (A) AdipoR siRNA, (B) ST-609 and (C) EGTA. C2C12 myotubes were pre-incubated for 6 h with STO-609 (1 μg/mL) or for 20 min with EGTA (5 mM), and subsequently treated for 10 min with β-carotene (1 μM) or lycopene (1 μM). The total cell protein was extracted from C2C12 myotubes and analyzed by western blotting. (D) Effect of β-carotene or lycopene on AMPK, ACC, and p38 phosphorylation in C2C12 myotubes. The C2C12 myotubes were incubated for the indicated times with β-carotene (1 μM) or lycopene (1 μM). (E) Effect of β-carotene or lycopene on the glucose uptake of C2C12 myotubes in the presence and absence of AdipoR siRNA. The C2C12 myotubes were incubated with β-carotene (1 μM) or lycopene (1 μM) for 10 min. See experimental details in the Methods section. Data are presented as mean ± SEM from independent experiments (n = 4–6/group). *p < 0.05, **p < 0.01 vs. control. #p < 0.05 vs. carotenoid alone. pAMPK, phosphorylated AMPK; AMPK, total AMPK; pACC, phosphorylated ACC; ACC, total ACC; pp38, phosphorylated p38; p38, total p38; STO, STO-609.

Similar articles

Cited by

References

    1. Yamauchi T, Kadowaki T. Adiponectin receptor as a key player in healthy longevity and obesity-related diseases. Cell Metab. 2013; 17(2):185–96. doi: 10.1016/j.cmet.2013.01.001 - DOI - PubMed
    1. Ng M, Fleming T, Robinson M, Thomson B, Graetz N, Margono C, et al.. Global, regional, and national prevalence of overweight and obesity in children and adults during 1980–2013: a systematic analysis for the Global Burden of Disease Study 2013. Lancet. 2014;384(9945):766–81. doi: 10.1016/S0140-6736(14)60460-8 - DOI - PMC - PubMed
    1. Miranda PJ, DeFronzo RA, Califf RM, Guyton JR. Metabolic syndrome: definition, pathophysiology, and mechanisms. Am Heart J. 2005;149(1):33–45. - PubMed
    1. Grundy SM. Metabolic syndrome: connecting and reconciling cardiovascular and diabetes worlds. J Am Coll Cardiol. 2006;47(6):1093–100. doi: 10.1016/j.jacc.2005.11.046 - DOI - PubMed
    1. Kern PA, Di Gregorio GB, Lu T, Rassouli N, Ranganathan G. Adiponectin expression from human adipose tissue: relation to obesity, insulin resistance, and tumor necrosis factor-alpha expression. Diabetes. 2003;52(7):1779–85. - PubMed

Publication types

MeSH terms