

Histologic Differences in Human Rotator Cuff Muscle Based on Tear Characteristics
- PMID: 35776739
- PMCID: PMC10771098
- DOI: 10.2106/JBJS.21.01304
Histologic Differences in Human Rotator Cuff Muscle Based on Tear Characteristics
Abstract
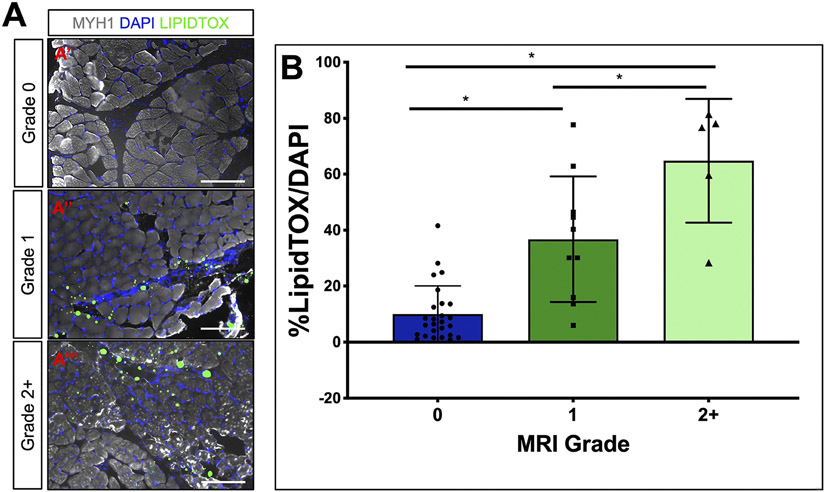
Background: Fatty accumulation in the rotator cuff is associated with shoulder dysfunction and a risk of failure of rotator cuff repair. The aims of this study were to (1) describe cellular findings in rotator cuff muscles in patients presenting with varying degrees of rotator cuff tendon pathology by examining fat content and myofiber cross-sectional area of rotator cuff muscles and (2) correlate histologic features to magnetic resonance imaging (MRI) grades derived with the Goutallier classification.
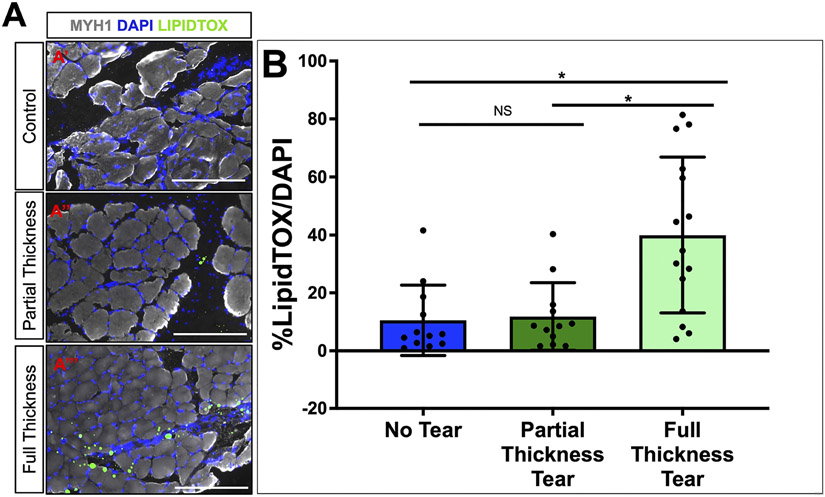
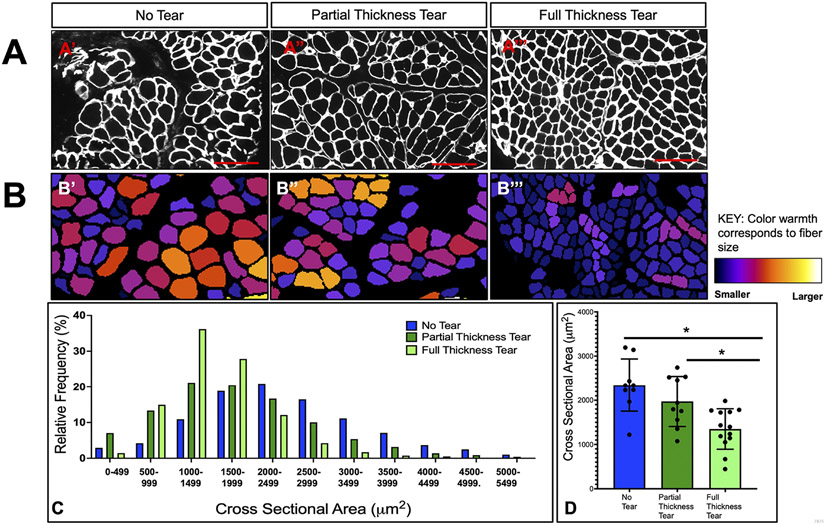
Methods: Rotator cuff muscle biopsies were performed in a consecutive series of patients undergoing arthroscopic shoulder surgery. Rotator cuffs were graded according to the Goutallier classification and labeled as either partial-thickness or full-thickness. Patients without a rotator cuff tear undergoing arthroscopic surgery served as controls. The biopsy specimens were examined using LipidTOX to visualize lipid accumulation. Laminin was used to quantify myofiber cross-sectional area.
Results: Twenty-seven patients with a rotator cuff tear and 12 without a tear (controls) were included. There were 24 males (62%). The mean age was 55 years. Patients in the control cohort were younger (mean, 46 years) than those in the treatment group (mean, 60 years, p < 0.01). Within the treatment group, 12 and 15 patients were recorded as having partial and full-thickness rotator cuff tears, respectively. Lipid accumulation visualized at the cellular level was fairly-to-moderately correlated with the Goutallier classification on MRI (R s = 0.705, 95% confidence interval [CI] = 0.513, 0.829). Muscle biopsy specimens with a Goutallier grade of 2+ had significantly more lipid accumulation than those with grade-0 (p < 0.01) or grade-1 (p < 0.01) fatty accumulation. Muscle biopsies at the sites of full-thickness tears showed significantly greater lipid accumulation than those associated with either partial (p < 0.01) or no (p < 0.01) tears. Partial-thickness rotator cuff tears had no difference in lipid accumulation in comparison to the control group. Muscle biopsy specimens from full-thickness tears had significantly smaller myofiber cross-sectional area when compared with partial-thickness tears (p = 0.02) and controls (p < 0.01).
Conclusions: Cellular lipid accumulation correlates with the MRI Goutallier grade of fatty accumulation, thus verifying the Goutallier classification at the cellular level. Muscle biopsy specimens from partial-thickness tears are more similar to controls than to those from full-thickness tears, whereas full-thickness tears of all sizes showed significantly greater lipid content and smaller myofiber cross-sectional area compared with partial-thickness tears and controls.
Clinical relevance: Our research confirms the utility of using the Goutallier classification to predict rotator cuff muscle quality and shows that tendon attachment, even if partially torn, protects the muscle from fatty accumulation.
Copyright © 2022 by The Journal of Bone and Joint Surgery, Incorporated.
Conflict of interest statement
Disclosure: The Disclosure of Potential Conflicts of Interest forms are provided with the online version of the article ( http://links.lww.com/JBJS/H38 ).
Figures
Comment in
-
Fatty Infiltration and Atrophy in Rotator Cuff Muscle Degeneration: What More Should We Look For?: Commentary on an article by Lindsey Ruderman, BA, et al.: "Histologic Differences in Human Rotator Cuff Muscle Based on Tear Characteristics".J Bone Joint Surg Am. 2022 Jul 6;104(13):e58. doi: 10.2106/JBJS.22.00378. Epub 2022 Jul 6. J Bone Joint Surg Am. 2022. PMID: 35793801 No abstract available.
Similar articles
-
Risk factors for intracellular fatty accumulation in rotator cuff muscle: a histologic analysis.J Shoulder Elbow Surg. 2024 Apr;33(4):e215-e222. doi: 10.1016/j.jse.2023.08.010. Epub 2023 Sep 26. J Shoulder Elbow Surg. 2024. PMID: 37757906
-
Association Between Supraspinatus Tendon Retraction, Histologic Myofiber Size, and Supraspinatus Muscle Atrophy on MRI.Am J Sports Med. 2023 Jul;51(8):1997-2004. doi: 10.1177/03635465231173697. Epub 2023 Jun 1. Am J Sports Med. 2023. PMID: 37260272 Free PMC article.
-
Myosteatosis and skeletal muscle atrophy, but not fibrosis, are correlated with increasing tear sizes of full-thickness rotator cuff tears.J Shoulder Elbow Surg. 2025 May 14:S1058-2746(25)00382-9. doi: 10.1016/j.jse.2025.03.040. Online ahead of print. J Shoulder Elbow Surg. 2025. PMID: 40379128
-
Determining the rate of full-thickness progression in partial-thickness rotator cuff tears: a systematic review.J Shoulder Elbow Surg. 2021 Feb;30(2):449-455. doi: 10.1016/j.jse.2020.08.022. Epub 2020 Sep 10. J Shoulder Elbow Surg. 2021. PMID: 32920110
-
Imaging of Reparable and Irreparable Rotator Cuff Tears.Semin Musculoskelet Radiol. 2025 Feb;29(1):124-133. doi: 10.1055/s-0044-1796634. Epub 2025 Feb 11. Semin Musculoskelet Radiol. 2025. PMID: 39933546 Review.
Cited by
-
Anatomic characteristics of shoulder based on MRI accurately predict incomplete rotator cuff injuries in patients: relevance for predictive, preventive, and personalized healthcare strategies.EPMA J. 2023 Jul 13;14(3):553-570. doi: 10.1007/s13167-023-00333-5. eCollection 2023 Sep. EPMA J. 2023. PMID: 37605646 Free PMC article.
-
A new section of shoulder magnetic resonance imaging (MRI) used to assess the fat infiltration of the rotator cuff muscles.J Orthop Surg Res. 2025 Apr 29;20(1):433. doi: 10.1186/s13018-025-05832-x. J Orthop Surg Res. 2025. PMID: 40301927 Free PMC article.
-
Single-nucleus transcriptomics reveals subsets of degenerative myonuclei after rotator cuff tear-induced muscle atrophy.Cell Prolif. 2025 Mar;58(3):e13763. doi: 10.1111/cpr.13763. Epub 2024 Oct 22. Cell Prolif. 2025. PMID: 39435630 Free PMC article.
-
Partial Articular Supraspinatus Tendon Avulsion Repair and Patch: A Technical Note for Augmenting the Supraspinatus Reinsertion with the Long Head of the Biceps Tendon.Orthop Surg. 2023 Aug;15(8):2174-2180. doi: 10.1111/os.13856. Orthop Surg. 2023. PMID: 37587547 Free PMC article.
-
Short-term efficacy of open surgery versus arthroscopic rotator cuff repair in moderate rotator cuff tears.Am J Transl Res. 2024 Oct 15;16(10):5585-5594. doi: 10.62347/UHQP7127. eCollection 2024. Am J Transl Res. 2024. PMID: 39544766 Free PMC article.
References
-
- Alexa Flour 488 Goat-Anti Rabbit, ThermoFisher ref#A-11034.
-
- Alexa Flour 594 Goat-Anti Mouse, ThermoFisher ref#A-11032.
MeSH terms
Substances
Grants and funding
LinkOut - more resources
Full Text Sources
Medical
