. 2022 Jul 1;18(7):e1010676.
doi: 10.1371/journal.ppat.1010676. eCollection 2022 Jul.

STAT and Janus kinase targeting by human herpesvirus 8 interferon regulatory factor in the suppression of type-I interferon signaling

Affiliations

STAT and Janus kinase targeting by human herpesvirus 8 interferon regulatory factor in the suppression of type-I interferon signaling

Qiwang Xiang et al. PLoS Pathog. .

Abstract

Human herpesvirus 8 (HHV-8), also known as Kaposi's sarcoma (KS)-associated herpesvirus, is involved etiologically in AIDS-associated KS, primary effusion lymphoma (PEL), and multicentric Castleman's disease, in which both viral latent and lytic functions are important. HHV-8 encodes four viral interferon regulatory factors (vIRFs) that are believed to contribute to viral latency (in PEL cells, at least) and/or to productive replication via suppression of cellular antiviral and stress signaling. Here, we identify vIRF-1 interactions with signal transducer and activator of transcription (STAT) factors 1 and 2, interferon (IFN)-stimulated gene factor 3 (ISGF3) cofactor IRF9, and associated signal transducing Janus kinases JAK1 and TYK2. In naturally infected PEL cells and in iSLK epithelial cells infected experimentally with genetically engineered HHV-8, vIRF-1 depletion or ablation, respectively, led to increased levels of active (phosphorylated) STAT1 and STAT2 in IFNβ-treated, and untreated, cells during lytic replication and to associated cellular-gene induction. In transfected 293T cells, used for mechanistic studies, suppression by vIRF-1 of IFNβ-induced phospho-STAT1 (pSTAT1) was found to be highly dependent on STAT2, indicating vIRF-1-mediated inhibition and/or dissociation of ISGF3-complexing, resulting in susceptibility of pSTAT1 to inactivating dephosphorylation. Indeed, coprecipitation experiments involving targeted precipitation of ISGF3 components identified suppression of mutual interactions by vIRF-1. In contrast, suppression of IFNβ-induced pSTAT2 was effected by regulation of STAT2 activation, likely via detected inhibition of TYK2 and its interactions with STAT2 and IFN type-I receptor (IFNAR). Our identified vIRF-1 interactions with IFN-signaling mediators STATs 1 and 2, co-interacting ISGF3 component IRF9, and STAT-activating TYK2 and the suppression of IFN signaling via ISGF3, TYK2-STAT2 and TYK2-IFNAR disruption and TYK2 inhibition represent novel mechanisms of vIRF function and HHV-8 evasion from host-cell defenses.


Conflict of interest statement

The authors have declared that no competing interests exist.

Figures
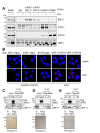
Fig 1
Fig 1. vIRF-1 interactions with ISGF3 proteins.
(A) TRExBCBL1-RTA (iBCBL-1) cells, doxycycline (Dox)-inducible for viral immediate-early RTA expression [35], were either left untreated (latently infected) or treated with Dox (1 μg/ml) for 1 day to induce lytic replication. Cells were harvested and lysed for the preparation of whole-cell extracts and these were used for immunoprecipitation (IP) of IRF9, STAT1, or STAT2; for IRF9, two different IP antibodies (Ab-1, Ab-2) were used. Non-immune mouse IgG was used as a negative control. Immunoprecipitates and cell lysates were immunoblotted for detection of IRF9, STAT1, STAT2, and vIRF-1. The immunoprecipitated vIRF-1 bands, running close to unblocked Ig heavy chain (above), are indicated by arrowheads. The dotted line indicates deletion of lanes, from a single blot. (B) Colocalization of vIRF-1 with STAT1 and STAT2 was investigated by proximity ligation assay (PLA). Rabbit antiserum to vIRF-1 was paired with either rat (STAT1) or mouse (STAT2) antibody, and appropriate detection antibodies were used for PLA (see Materials and Methods). Negative controls comprised non-specific mouse IgG (IgGm) or rabbit IgG (IgGr) coupled with vIRF-1 or STAT antibodies, respectively. Cells were visualized by confocal microscopy to detect fluorescent dots, indicative of the colocalizations of complementary species-specific antibodies and therefore of the corresponding vIRF-1 and STAT targets. Untreated (latent) or Dox-induced (lytic) iBCBL-1 cells were analyzed; lytic cultures were harvested 1 day after induction. (C-E) In vitro coprecipitation assays using bacterially-expressed and purified STAT1, STAT2, and IRF9 (Flag-tagged) along with S-tagged and affinity-precipitated vIRF-1. Coprecipitated target proteins were detected by Flag immunoblotting, and vIRF-1-S affinity-precipitation (AP) was verified by S-peptide antibody probing (arrowheads indicate vIRF-1-S; asterisks indicate remnant Flag signal from STAT1/2 degradation products or full-length IRF9 on S-blots, following sequential probing). The input proteins used in each assay were quality-checked on Ponceau-S-stained gels (bottom panels).
Fig 2
Fig 2. vIRF-1 regulation of STAT1, STAT2 and IFNβ signaling in HHV-8-infected cells.
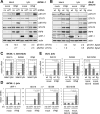
(A) Analysis of phosphorylated (active) STAT1 and STAT2 (pSTAT1, pSTAT2) and total STAT1 and STAT2 in latent (-Dox) and lytic (+Dox, 2 days) iBCBL-1 PEL cells, transduced with lentivirus vector expressing either non-silencing control (ns) or vIRF-1 mRNA-specific (virf1) shRNA. Cultures remained untreated (mock) or were treated with IFNβ (50 ng/ml). Derived cell extracts were immunoblotted for assessments of pSTAT1 and pSTAT2 levels, in addition to validation of vIRF-1 induction (+Dox) and depletion and monitoring of IRF9 expression. Quantified pSTAT1 (pS1) and pSTAT2 (pS2) levels for IFNβ-treated samples, normalized to total STAT1 (S1) and STAT2 (S2), respectively, and expressed as ratios of levels in vIRF-1 versus control shRNA-transduced cells (virf1/ns), are shown below the blots. Dotted lines indicate rearrangement (for consistency) and deletion of lanes. (B) Analysis of STAT1 and STAT2 regulation as a function of vIRF-1 in BAC16 HHV-8-infected iSLK cells. Cultures infected with wild-type (wt) or vIRF-1-knockout (ttg) [9] virus were treated with Dox and sodium butyrate (NaB) to induce lytic replication or left untreated (latent infection), with or without IFNβ treatment. Cells were harvested 3 days after treatment, and cell lysates were analyzed as above. Levels of pSTAT1 and pSTAT2, normalized to total STAT1 and STAT2, in ttg-virus-infected cells relative to wt-virus-infected cells are indicated below the blots. Arrowheads indicate positions of pSTAT1 and vIRF-1 bands; asterisks indicates non-specific bands. For A and B: nd, not determined; -, undetectable pSTAT. (C) Detection of lytic cycle-regulated ISG15 and ISG56 in iBCBL-1 cells. Expression of representative ISGs, ISG15 and ISG56, and also IFNβ, were assessed in latent and (1-day) lytic cells by RT-qPCR analysis of the respective transcripts. Data are from biological triplicates; error bars represent standard deviations from the means, and student t-test P values (two-tailed) are shown. (D) ISG15 and ISG56 transcript levels were assessed in lytically-infected iBCBL-1 cells 2 days post-Dox treatment, with or without vIRF-1 depletion, in the presence (IFNβ) or absence (mock) of IFNβ treatment (50 ng/ml). RT-qPCR for vIRF-1 mRNA confirmed vIRF-1 depletion in vIRF-1 (virf1) shRNA-expressing relative to non-silencing (ns) shRNA-expressing cells (left). (E) Equivalent analysis of ISG15 and ISG56 expression in iSLK cells infected with wild-type (wt) or vIRF-1-knockout (ttg) BAC16 virus and lytically reactivated with Dox/NaB treatment for 3 days.
Fig 3
Fig 3. Regulation of IFNβ signaling by vIRF-1 in transfected cells.
(A) 293T cells transfected with empty vector (-) or vIRF-1 expression plasmid (virf1) were left untreated or treated with IFNβ or IFNγ (50 ng/ml of each) for 24 h. Cells were then harvested and lysates analyzed by immunoblotting for relative levels of pSTAT1 and pSTAT2, total STAT1 and STAT2, and IRF9. As applicable (detected), pSTAT1/STAT1 and pSTAT2/STAT2 ratios (“empty vector” values set at 1) are shown below the respective blots for IFNβ- and IFNγ-treated cells. (B) vIRF-1 suppression of IFNβ-induced signaling, as measured by ISRE-luciferase (luc) reporter assay, was detected in 293T cells cotransfected with the reporter and empty vector (-) or expression plasmid for vIRF-1 (virf1), left untreated or treated with IFNβ (50 ng/ml) for 24 h. Relative luciferase assay-derived luminescence values (RLU, means from duplicate transfectants) are shown along with standard deviations from the means. Student’s t-test P value (unpaired, two-tailed) for vIRF-1 suppression of IFNβ signaling (vIRF-1-vector relative to empty-vector RLU) is 0.0005. (C) STAT1, STAT2, and IRF9 knockout (KO) 293T cell lines were generated by Cas9/gRNA transduction, blasticidin selection, and clonal isolation of cells (see Materials and Methods). Target-gene ablation in each of the cell lines was tested functionally by ISRE-luciferase reporter assay following IFNβ stimulation (chart; N = 2). Mock, untreated cultures; virf1, vIRF-1 vector-transfected cells; -, empty vector-transfected cells. (D) vIRF-1 suppression of IFNβ-activated STAT1 and STAT2 (pSTAT1, pSTAT2) as a function of STAT1, STAT2, and IRF9 knockout. Cultures were transfected with empty vector (-) or vIRF-1 expression plasmid (virf1) and, after 6 h, treated with IFNβ (50 μg/ml) for 24 h. Cell lysates were analyzed by immunoblotting; numbers below the pSTAT1 and pSTAT2 blots show quantified pSTAT1 and pSTAT2 levels normalized to total STAT1 and STAT2, respectively, in the absence (value set at 1) and presence of vIRF-1. Arrows, STAT1/pSTAT1; asterisks, non-specific bands; dotted lines, lane deletions from single blot; solid line, different membrane.
Fig 4
Fig 4. Effects of vIRF-1 on the amplitudes and kinetics of IFNβ-activated STAT1/2.
(A) 293T cells transfected with empty vector (control) or vIRF-1 expression plasmid were left untreated (0 h) or treated with IFNβ (50 ng/ml) for different times (0.25 to 8 h). Cells were harvested, lysed, and analyzed by immunoblotting for detection of phosphorylated and total STAT1 and STAT2, IRF9, and also vIRF-1, to check expression in the transfectants. Relative levels of pSTAT1 and pSTAT2, normalized to STAT1 and STAT2, respectively, and with empty vector (vec) values at 0.25 h set at 1, are shown in the adjacent charts. (B) An analogous experiment was performed in STAT2-knockout (KO) 293T cells. The immunoblot-derived pSTAT1 levels, normalized to STAT1 and expressed relative to vector/0.25 h pSTAT1 (set at 1), are plotted in the chart (right). For both panels, dotted lines indicate lane deletion or rearrangement of blot sections for consistency of presentation.
Fig 5
Fig 5. Effects of vIRF-1 on complexing of ISGF3 components.
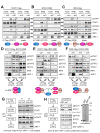
(A-C) Flag-tagged STAT1 (A) or IRF9 (C) or CBD-tagged STAT2 (B) were expressed in 293T cells transfected with the respective expression plasmids and either vIRF-1 (virf1) or empty (-) expression vector; replicates were either left untreated (mock) or treated with IFNβ (10 ng/ml) for 24 h. Flag/CBD-tagged proteins were then immuno/affinity-precipitated from cell lysates, and coprecipitated ISGF3 proteins were detected by immunoblotting. Diagrams below the panels illustrate the main findings from each experiment. (D-E) Serial coprecipitations of STAT1 and STAT2 (D), STAT1 and IRF9 (E), and IRF9 and STAT2 (F), respectively Flag- and CBD-tagged, from lysates of transfected 293T cells expressing vIRF-1 (virf1) or cotransfected with empty vector (-). All transfectants were treated with IFNβ for 24 h prior to harvesting. First (Flag IP) and second (CBD AP) precipitates (Precip. 1, Precip. 2) were analyzed by immunoblotting for the tagged “bait” proteins, the third (endogenous) ISGF3 protein (including phosphorylated and total STAT1 and STAT2), and vIRF-1; lysates were immunoblotted for expression of input proteins. Illustrated below each panel of blots are the main findings. (G) Disruption by vIRF-1 of STAT1-STAT2 complexes isolated by Flag-IP (STAT1) and CBD-AP (STAT2) from IFNβ-treated transfected 293T cells. Immunoprecipitated material from vIRF-1-Flag (virf1) or empty control (cntl) vector-transfected cells was applied in two concentrations (1x, 2x) to dual-precipitation-derived STAT1/STAT2 complexes, and then mixtures were subjected to re-precipitation with chitin beads (binding STAT2-CBD). STAT1 and vIRF-1 associated with re-precipitated STAT2-CBD were identified by immunoblotting. Relative levels of co-precipitated STAT1, normalized to affinity-sedimented STAT2, are shown below the STAT1 blot (cntl/1x value set at 1). (H) An equivalent experiment was carried out using GST-fused recombinant vIRF-1 (virf1) or GST (negative control) to challenge STAT1 interaction with STAT2 in STAT1/STAT2 hetero-complexes isolated by IP/AP dual precipitations from IFNβ-treated 293T cells. Endogenous IRF9 interaction with STAT1/2 and competition by vIRF-1 were also monitored. Relative levels and integrities of the recombinant proteins are shown in the Coomassie-stained gel (right); arrowheads indicate the positions of the full-length proteins.
Fig 6
Fig 6. Physical and functional interactions of vIRF-1 with JAKs.
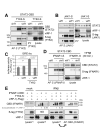
(A) TYK2-S and STAT2-CBD were expressed with (virf1) or without (-) vIRF-1 in transfected 293T cells. Cell lysates and S-protein affinity-precipitates were assessed for input protein expression and sedimentation by immunoblotting with CBD (STAT2), vIRF-1, and S-tag (TYK2) antibodies. Affinity-precipitated TYK-2-S was probed with phospho-tyrosine (PY)-specific antibody to identify the active, autophosphorylated form of the kinase. Dotted lines indicate lane deletions from single membranes; the arrowhead and asterisk indicate CBD-specific (STAT2) band and remnant S-tag signal (after blot stripping), respectively. (B) An equivalent experiment was performed to assess vIRF-1 effects on JAK1 autophosphorylation and association with STAT2. Here, STAT2 antibody was used to detect endogenous protein. Arrowheads indicate JAK1-S (~130 kDa). (C) ISRE-luciferase reporter assay to assess vIRF-1 inhibition of TYK2-mediated signal transduction in 293T cells cotransfected with TYK2-expression and reporter plasmids and either vIRF-1 (virf1) or empty (-) expression vectors. Average values from duplicate samples for each condition are shown; error bars indicate standard deviations from the means. Statistical significance (P) was determined by student t-test (two-tailed, unpaired). (D) IFNAR1-S-based coprecipitation assay to test the influence of vIRF-1 (virf1), relative to empty-vector (-) transfection, on STAT2-receptor association, following IFNβ stimulation for 30 min. STAT2-CBD vector cotransfection provided expression of STAT2 above endogenous levels, to facilitate detection. (E) Effect of vIRF-1 on IFNβ receptor (IFNAR1) activation and association with TYK2. Transfectants expressing vIRF-1 or containing empty vector (-, negative control) and expressing, or lacking (-), introduced IFNAR1-CBD were left untreated (mock) or treated with IFNβ (10 ng/ml) for 24 h; TYK2-S was expressed in a subset of the transfected cultures. Cell lysates were analyzed for expression of the introduced proteins, and IFNAR1-CBD was affinity-precipitated from a subset of lysates to assess interaction of the receptor with TYK2 in response to vIRF-1. The numbers below the CBD blots show relative levels (-/+ vIRF-1) of IFNβ-induced lower IFNAR1 band (arrowheads) to total IFNAR1 (top plus bottom bands) from TYK2-overexpressing transfectants (+TYK2) and those devoid of TYK2 expression plasmid (-TYK2); values in the absence (-) of vIRF-1 are set at 1. For all precipitations (panels A, B, D and E), cultures were treated with DSP (2 mM, 30 min.) immediately prior to cell harvest, to stabilize targeted complexes.
Fig 7
Fig 7. Model of vIRF-1 inhibition of IFN-β signaling based on the presented data.
IFNβ binds to IFNAR1 and IFNAR2 to effect receptor activation through auto/cross-phosphorylation of receptor associated JAK kinases (JAK1 and TYK2) and receptor tyrosine residues. STAT1 and STAT2 are recruited and activated through JAK-mediated tyrosine phosphorylation, and then can heterodimerize and associate with IRF9 to form nuclear-localizing and transcriptionally active ISGF3 complexes. Data presented here show that vIRF-1 binds directly to STAT1, STAT2 and IRF9 and can also associate, directly or indirectly, with TYK2 and JAK1. vIRF-1 inhibits TYK2, but not JAK1, autophosphorylation (activation), likely contributing to pSTAT2 suppression; vIRF-1 also inhibits TYK2-STAT2 and TYK2-IFNAR1 association (not illustrated). However, suppression of pSTAT1 is mediated largely after IFNβ-induced STAT1 phosphorylation, involving increased rates of pSTAT1 decay, likely via phosphatase (P’ase)-mediated dephosphorylation (rather than pSTAT1 degradation). Suppression of pSTAT1 by vIRF-1 is dependent on STAT2, being negated by STAT2 knockout in 293T cells; this along with decreased IFNβ-stimulated pSTAT1 association with STAT2 and IRF9 in the presence of vIRF-1 indicates that vIRF-1 may suppress pSTAT1 via release of the transcription factor from ISGF3 or STAT1-STAT2 heterodimers, thereby promoting dephosphorylation of pSTAT1. Detection of intracellular complexes containing vIRF-1, pSTAT2 and IRF9 and dissociation of IFNβ-induced STAT1-STAT2 interaction by vIRF-1 in vitro are consistent with this model. Data from in vitro competition and STAT1/IRF9 and IRF9/STAT2 serial precipitation experiments provide evidence that vIRF-1 may also destabilizes IRF9-STAT2 association and dissociate ISGF3 interactions. It is possible that vIRF-1 also inhibits ISGF3 complex formation (not illustrated), via (detected) interactions with pre- and/or post-activated STAT1, STAT2 and IRF9, but the presented data do not specifically address this. In the diagram, blue lines indicate activities and consequences of vIRF-1.

Similar articles

Cited by

References

    1. Moore PS, Boshoff C, Weiss RA, Chang Y. Molecular mimicry of human cytokine and cytokine response pathway genes by KSHV. Science. 1996; 274:1739–44. doi: 10.1126/science.274.5293.1739 - DOI - PubMed
    1. Cunningham C, Barnard S, Blackbourn DJ, Davison AJ. Transcription mapping of human herpesvirus 8 genes encoding viral interferon regulatory factors. J Gen Virol. 2003; 84:1471–1483. doi: 10.1099/vir.0.19015-0 - DOI - PubMed
    1. Searles RP, Bergquam EP, Axthelm MK, Wong SW. Sequence and genomic analysis of a Rhesus macaque rhadinovirus with similarity to Kaposi’s sarcoma-associated herpesvirus/human herpesvirus 8. J Virol. 1999; 73:3040–53. doi: 10.1128/JVI.73.4.3040-3053.1999 - DOI - PMC - PubMed
    1. Alexander L, Denekamp L, Knapp A, Auerbach MR, Damania B, Desrosiers RC. The primary sequence of rhesus monkey rhadinovirus isolate 26–95: sequence similarities to Kaposi’s sarcoma-associated herpesvirus and rhesus monkey rhadinovirus isolate 17577. J Virol. 2000; 74:3388–98. doi: 10.1128/jvi.74.7.3388-3398.2000 - DOI - PMC - PubMed
    1. Bruce AG, Ryan JT, Thomas MJ, Peng X, Grundhoff A, Tsai CC, et al.. Next-generation sequence analysis of the genome of RFHVMn, the macaque homolog of Kaposi’s sarcoma (KS)-associated herpesvirus, from a KS-like tumor of a pig-tailed macaque. J Virol. 2013; 87:13676–93. doi: 10.1128/JVI.02331-13 - DOI - PMC - PubMed

Publication types

MeSH terms