. 2022 Jul 13;14(27):30455-30465.
doi: 10.1021/acsami.1c24463. Epub 2022 Jul 1.

Non-Invasive Three-Dimensional Cell Analysis in Bioinks by Raman Imaging

Affiliations

Non-Invasive Three-Dimensional Cell Analysis in Bioinks by Raman Imaging

Julia Marzi et al. ACS Appl Mater Interfaces. .

Abstract

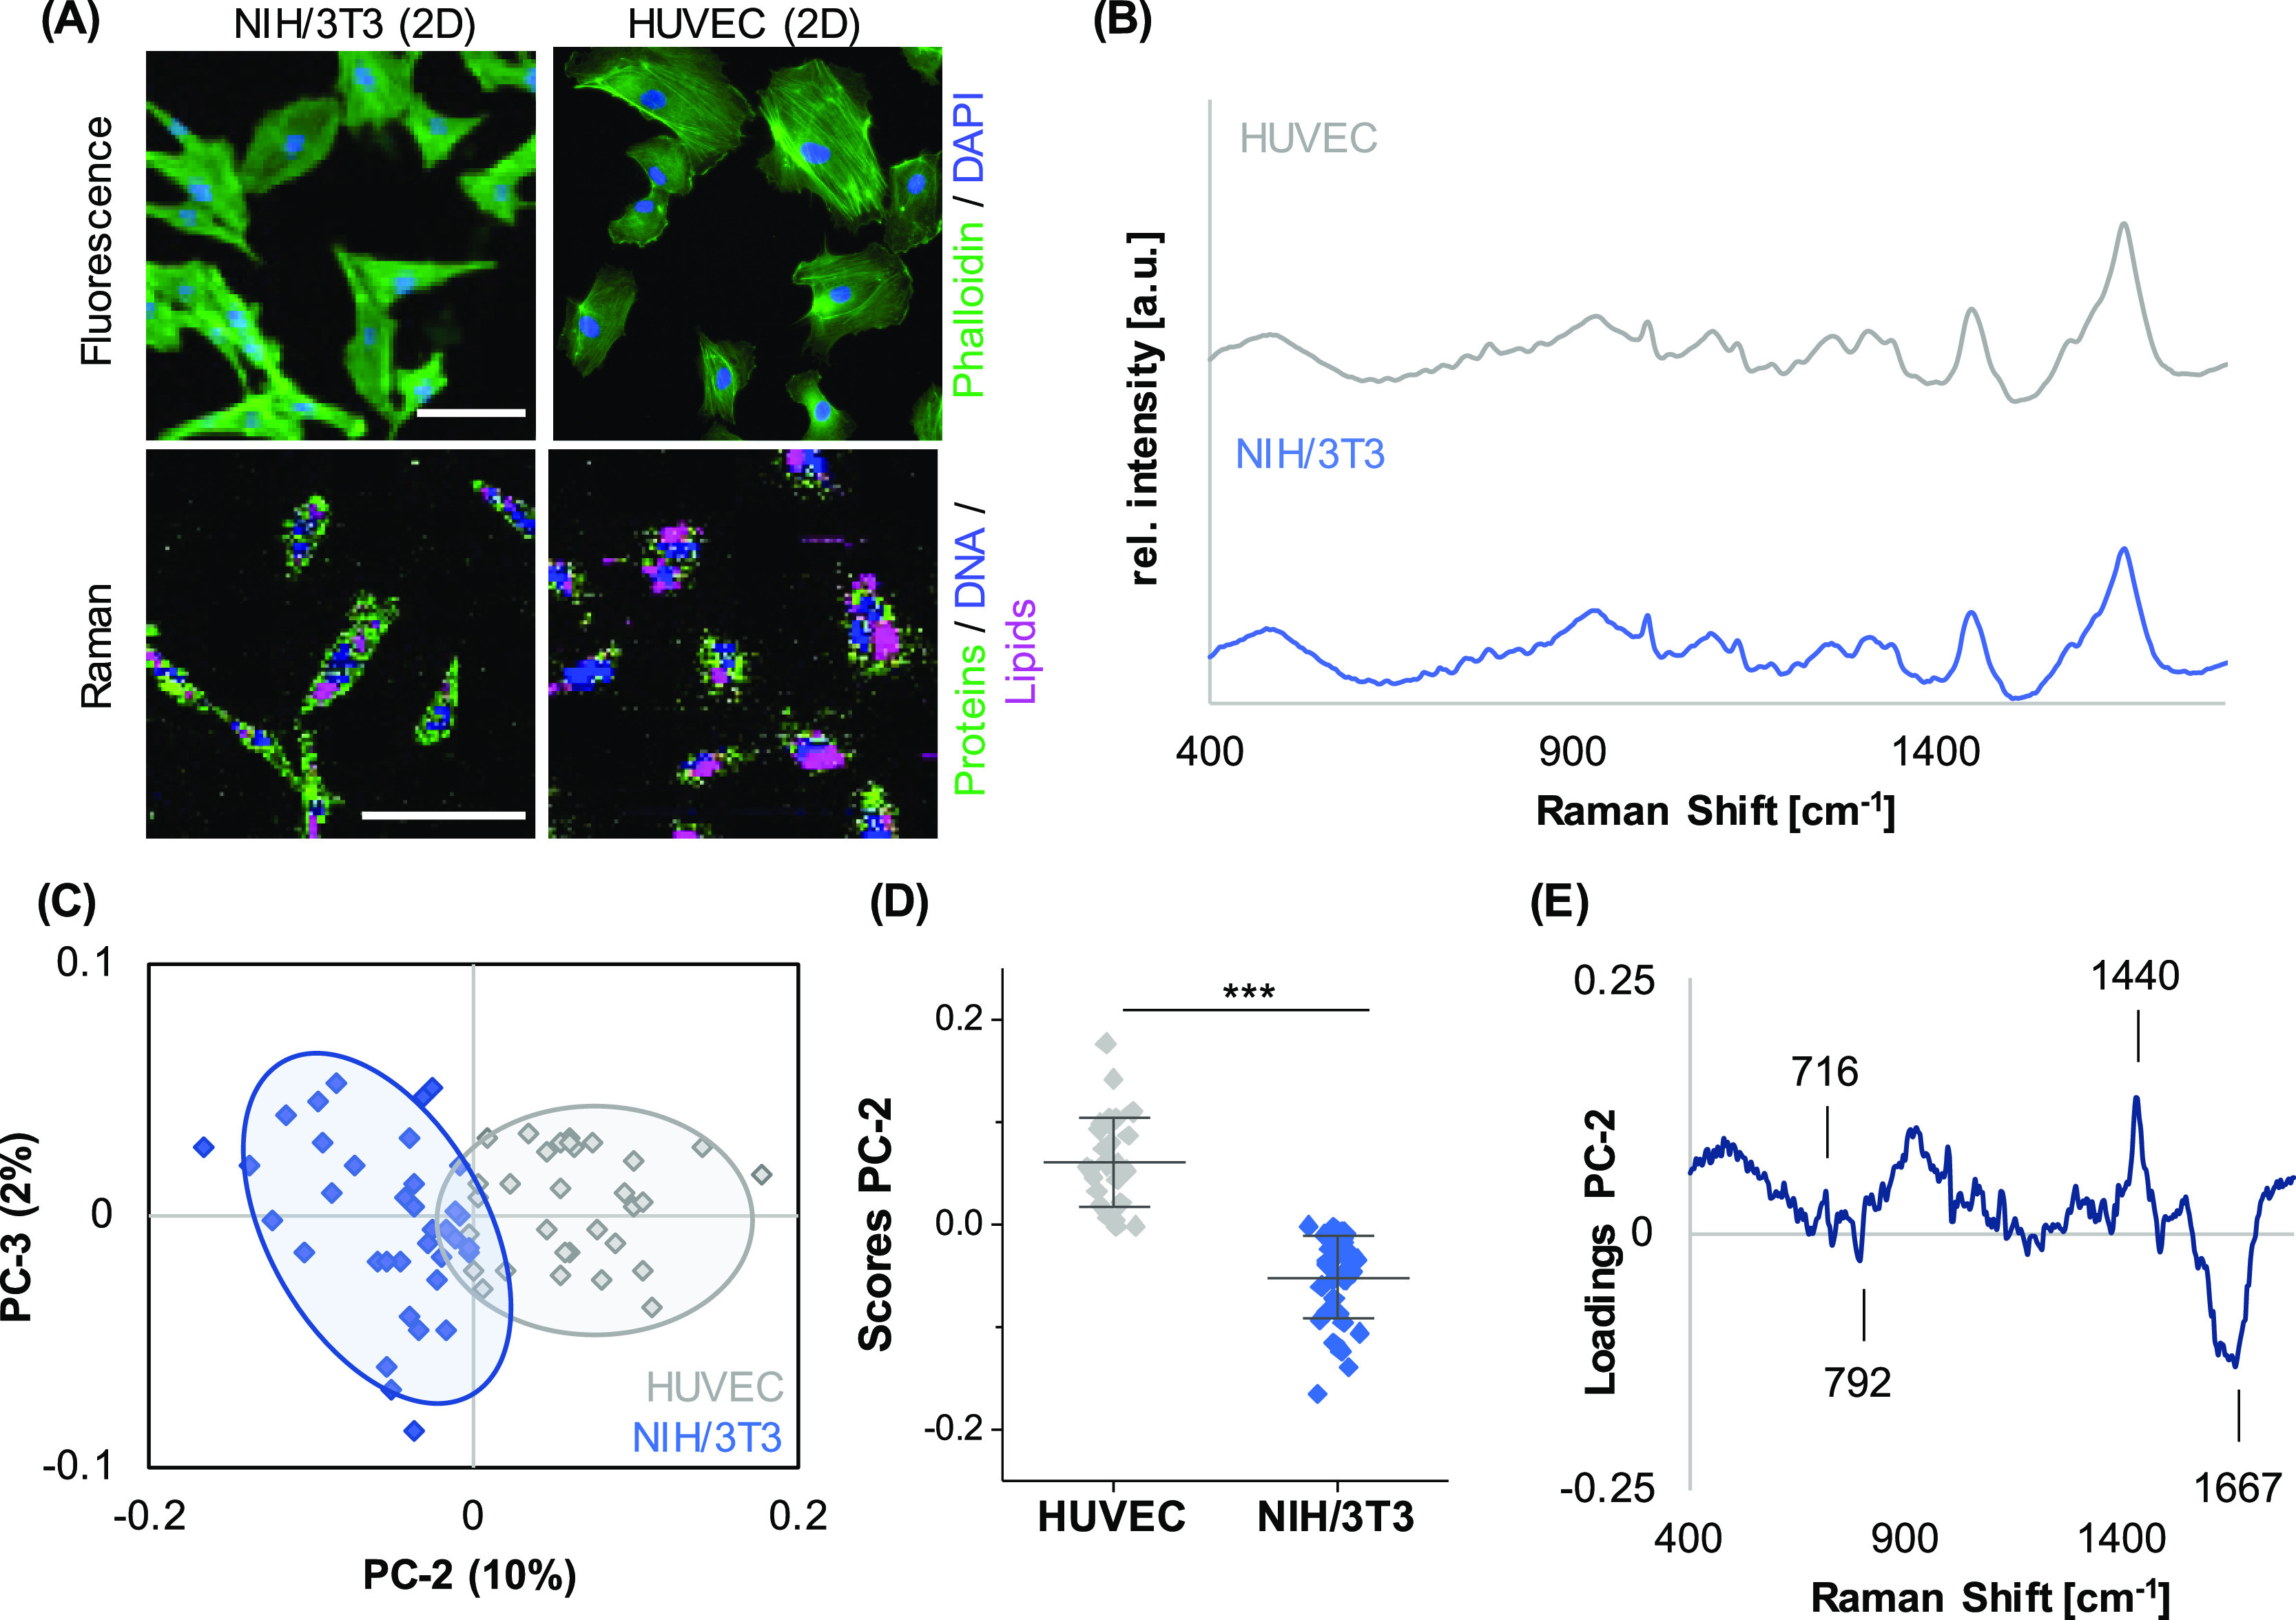
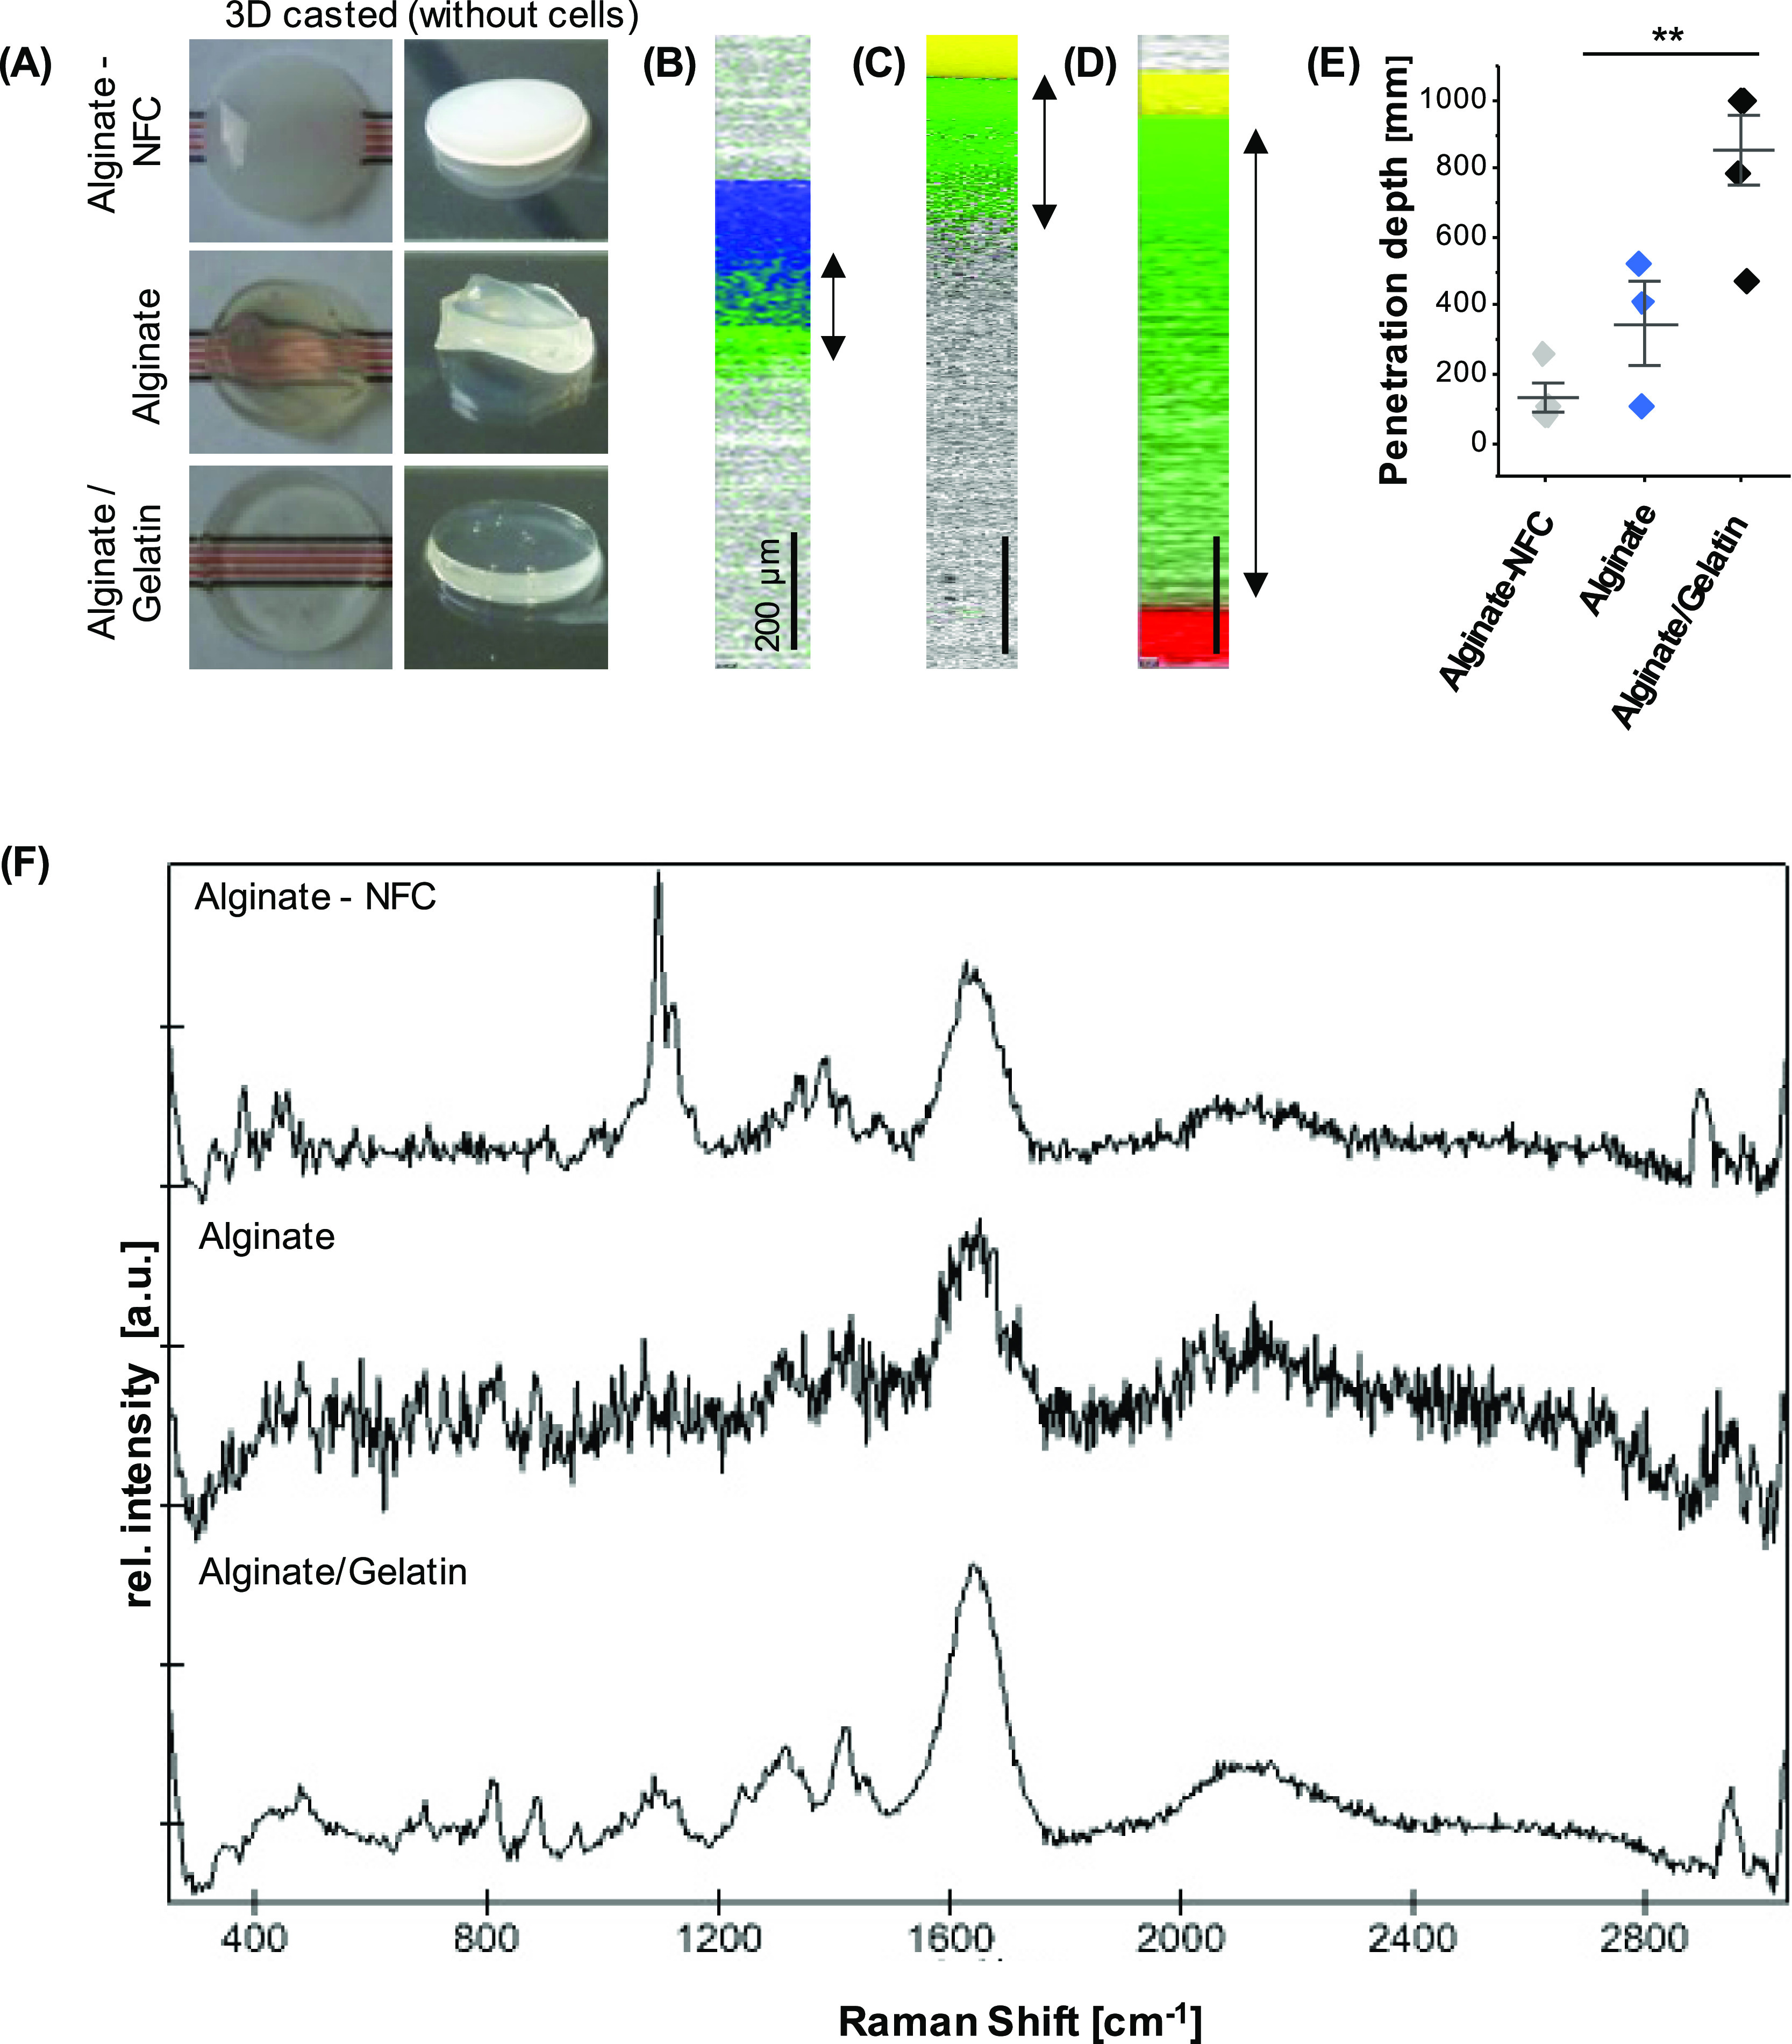
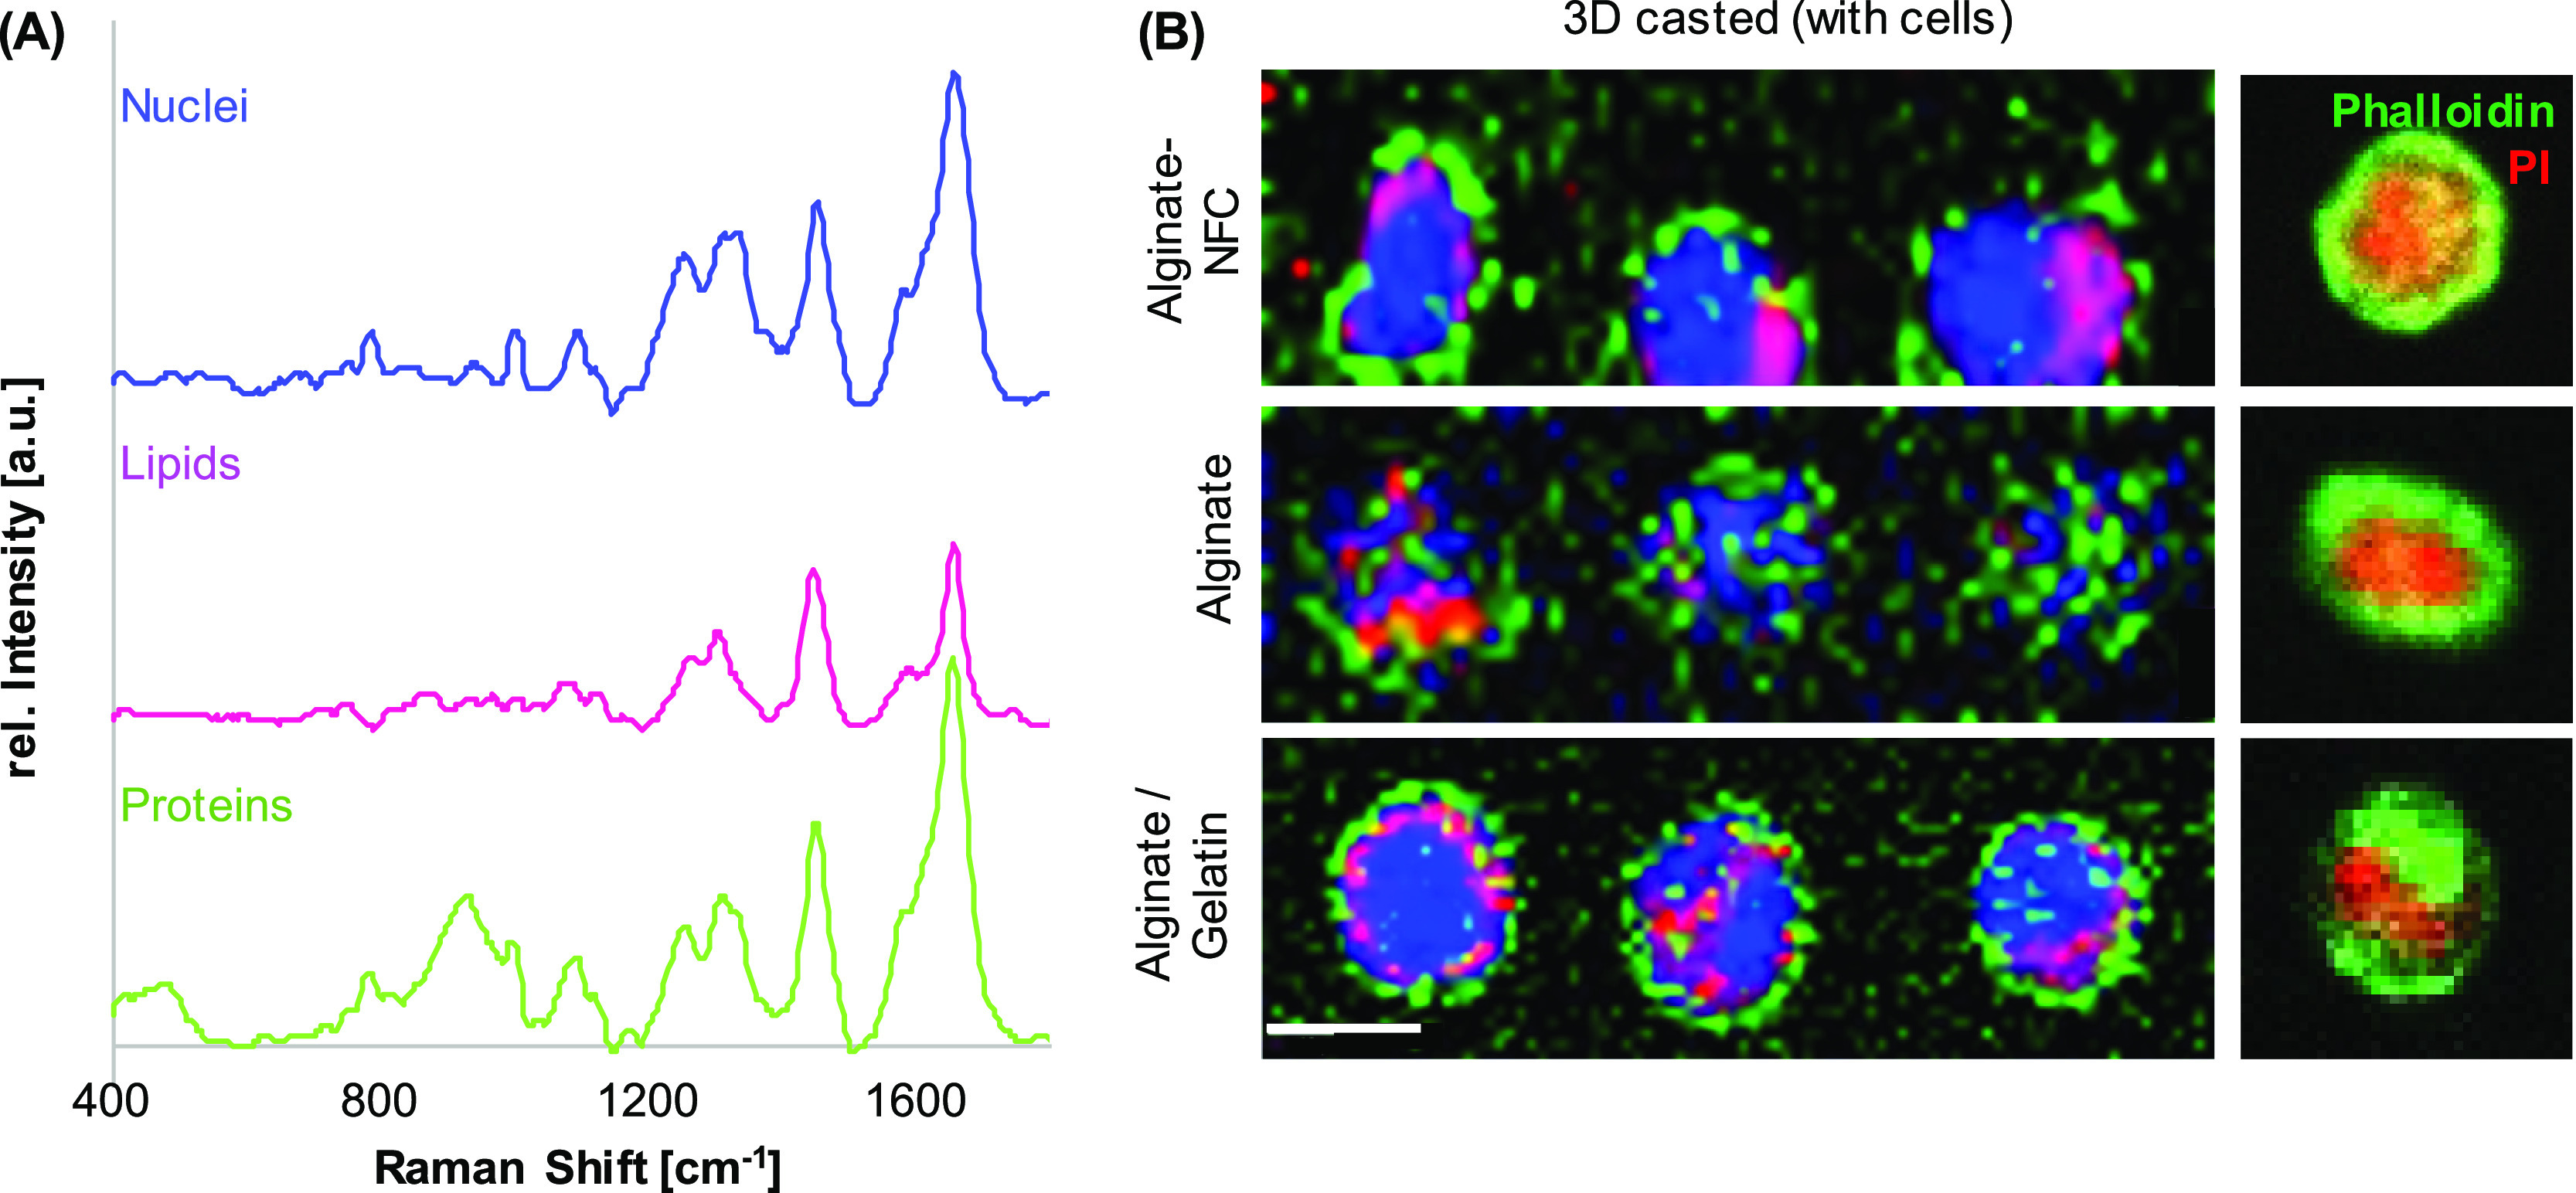
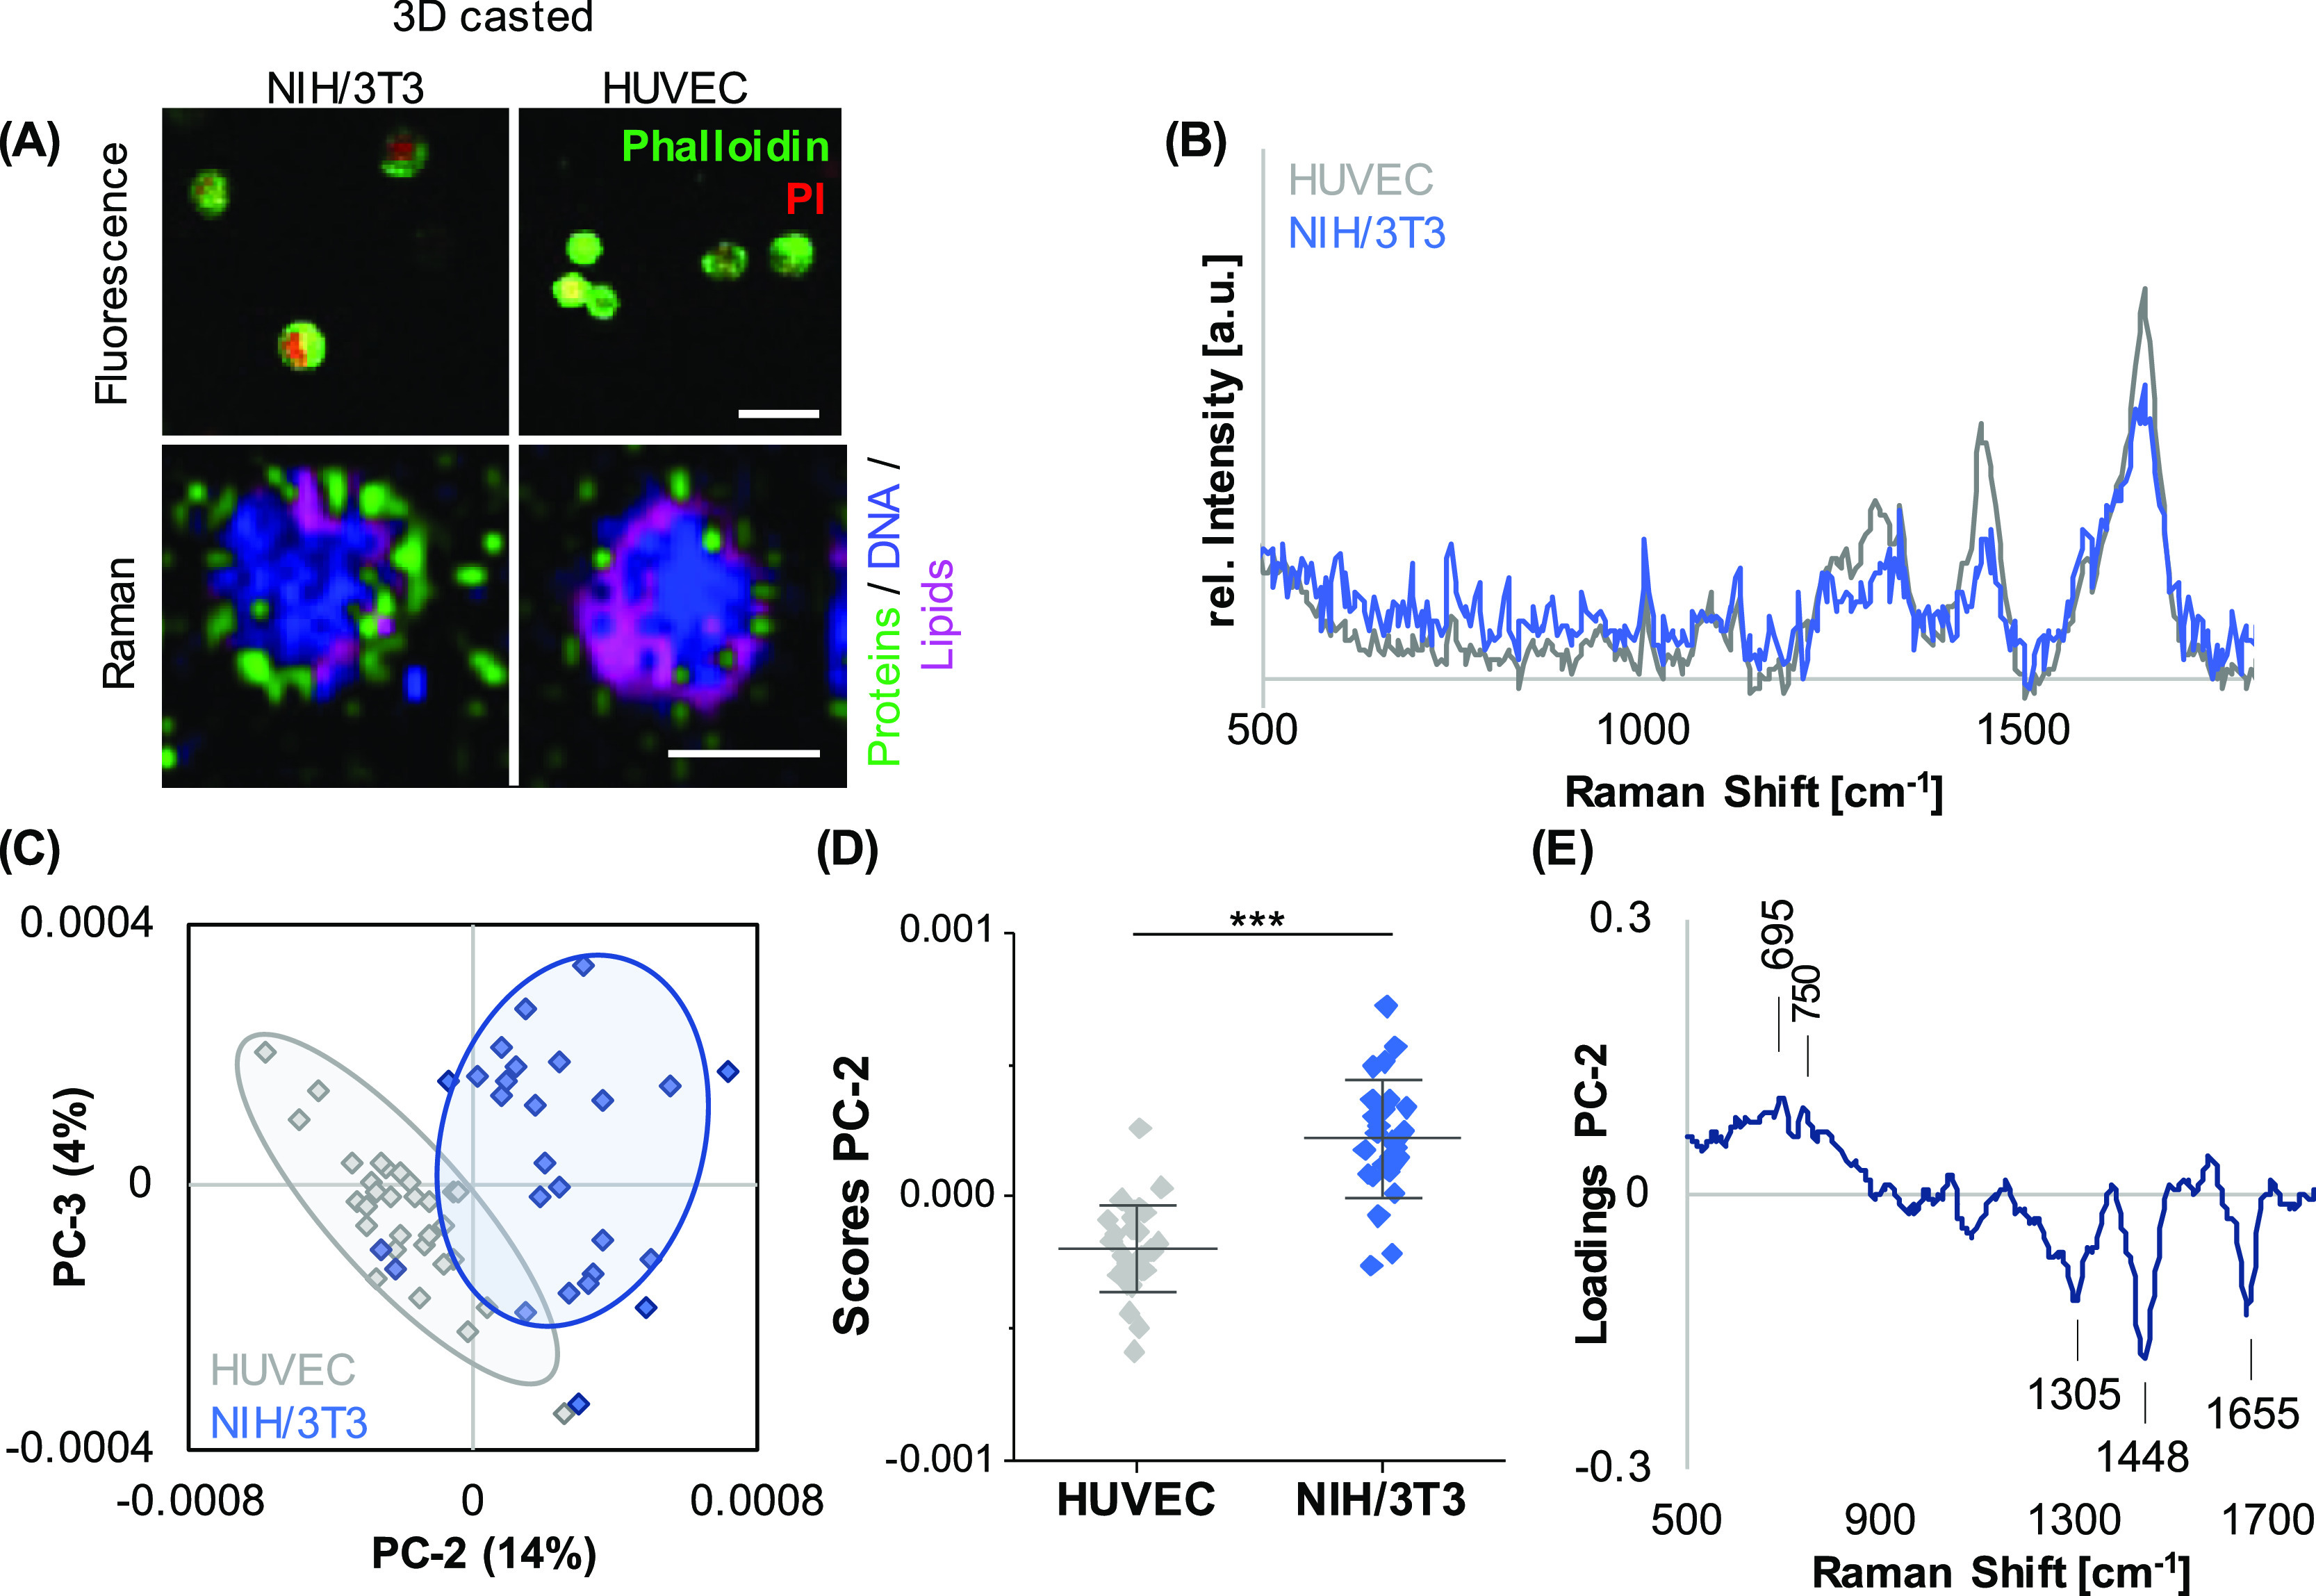
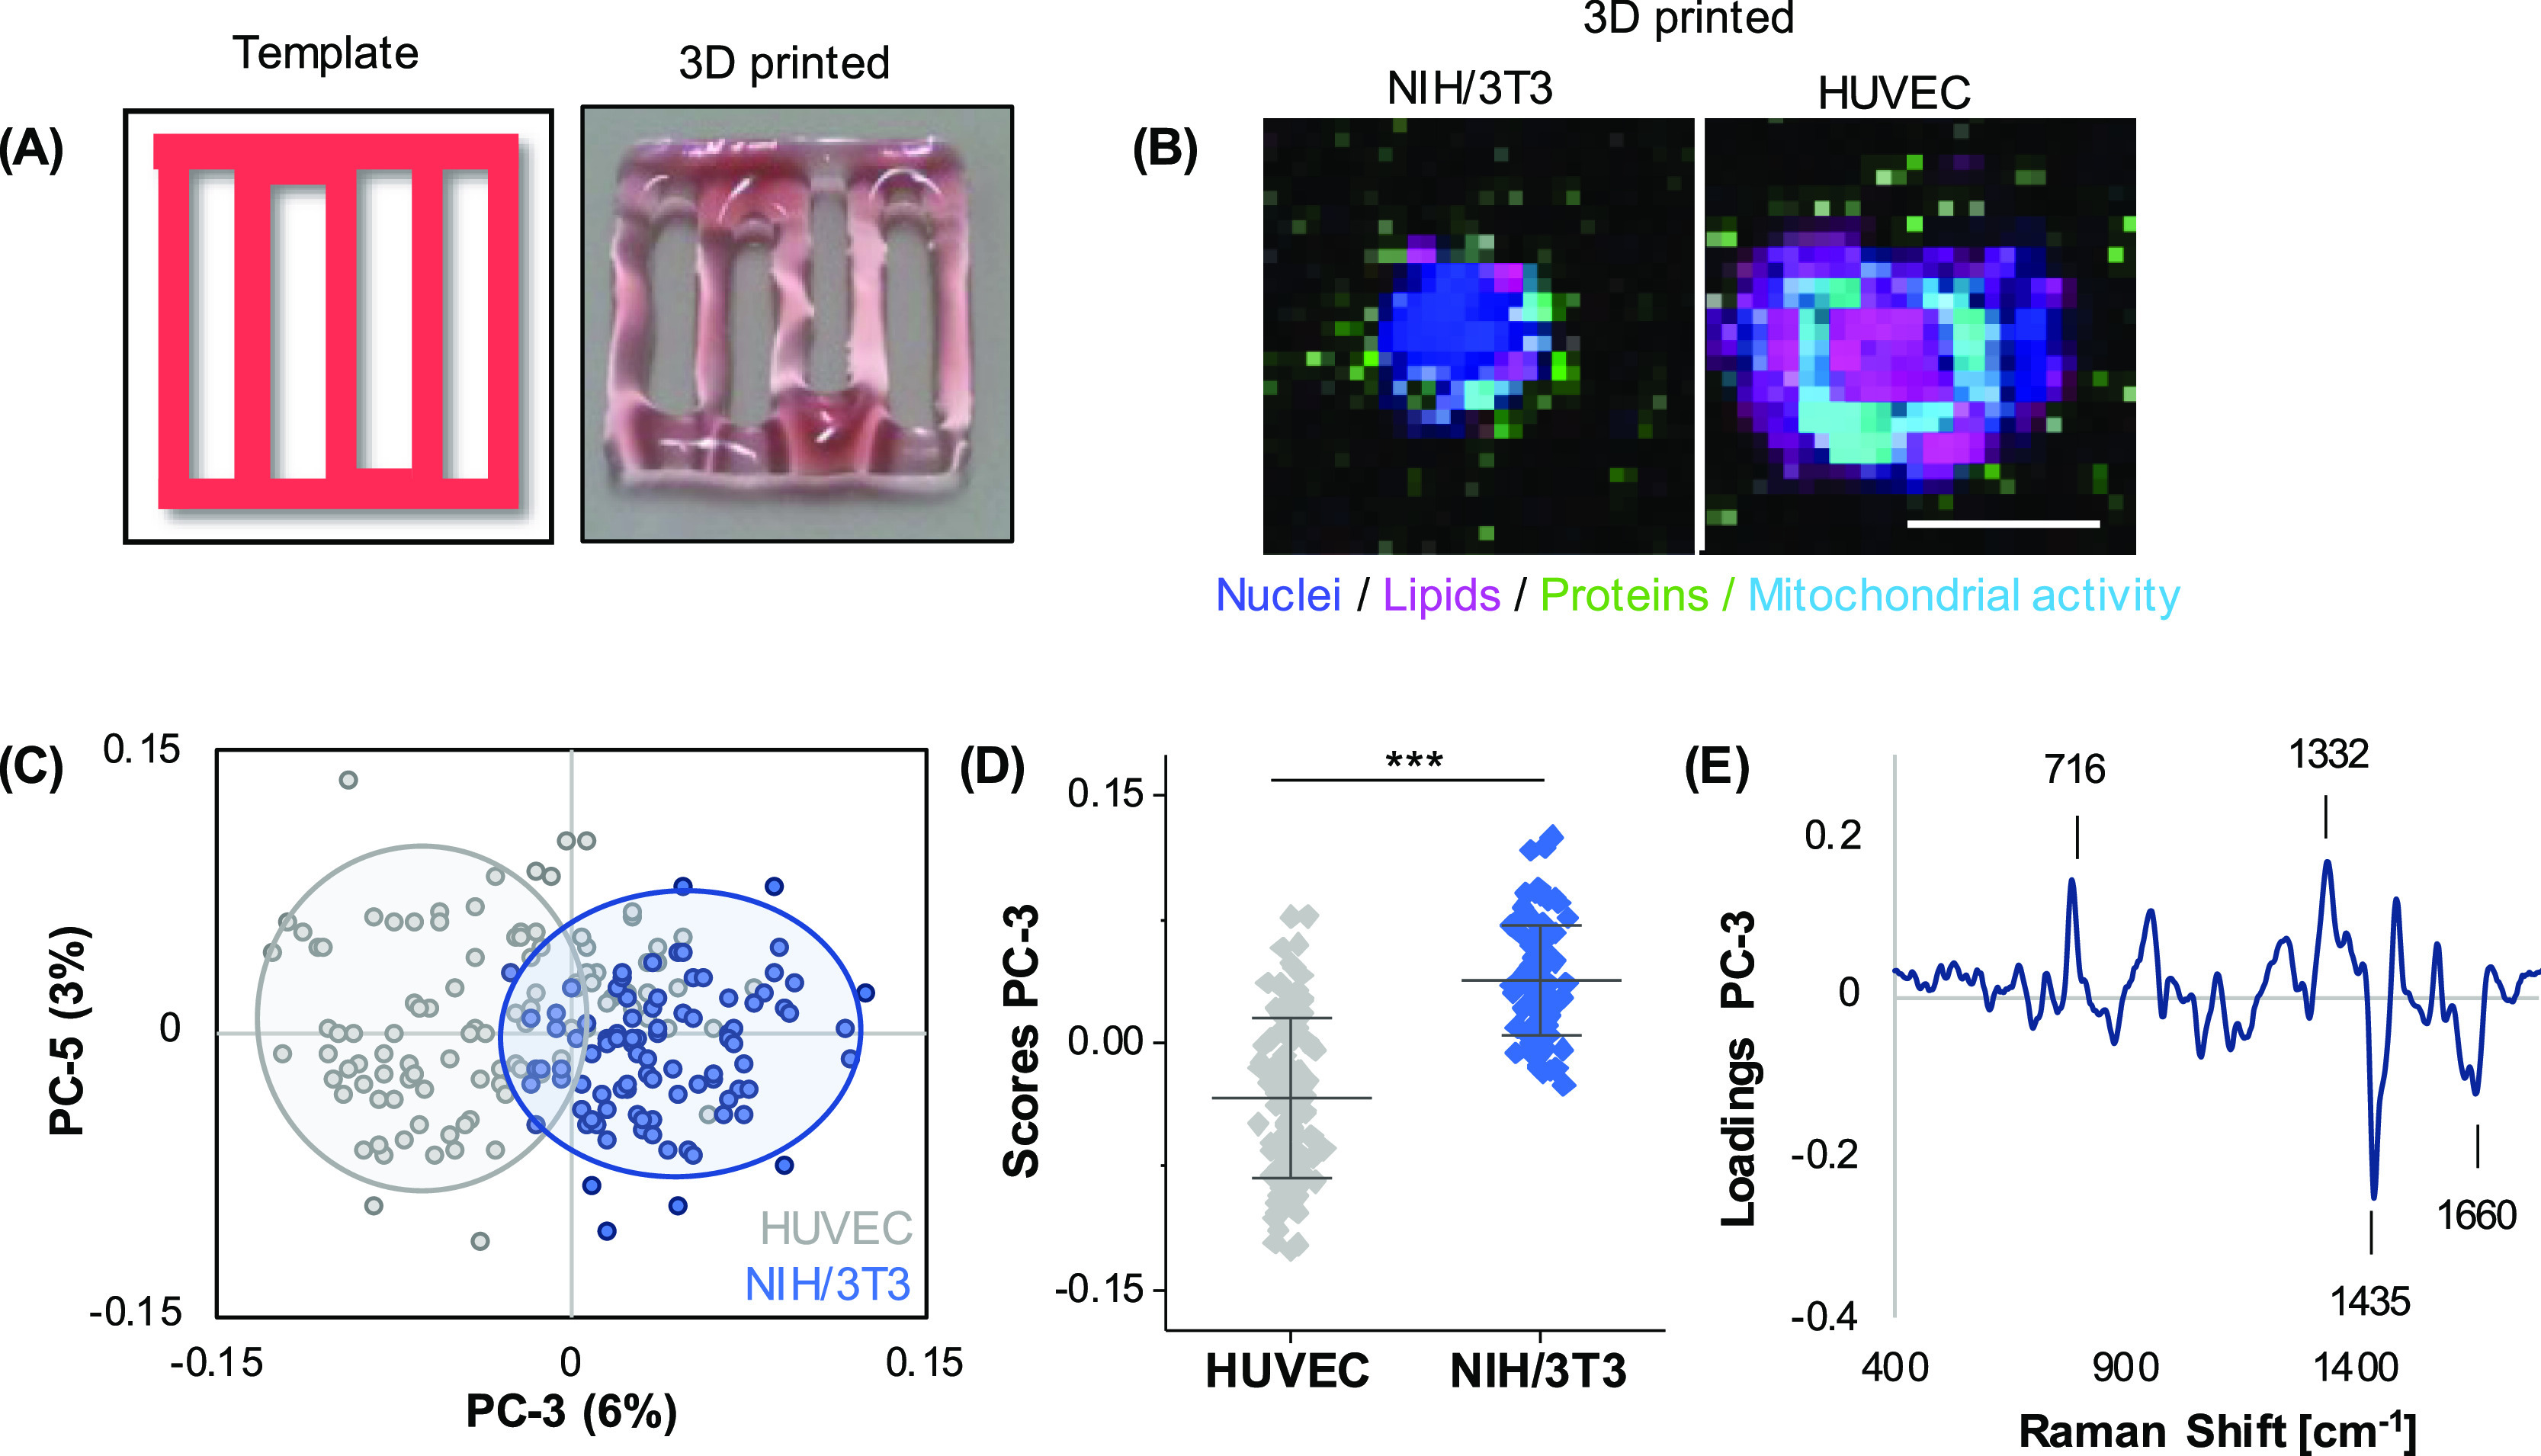
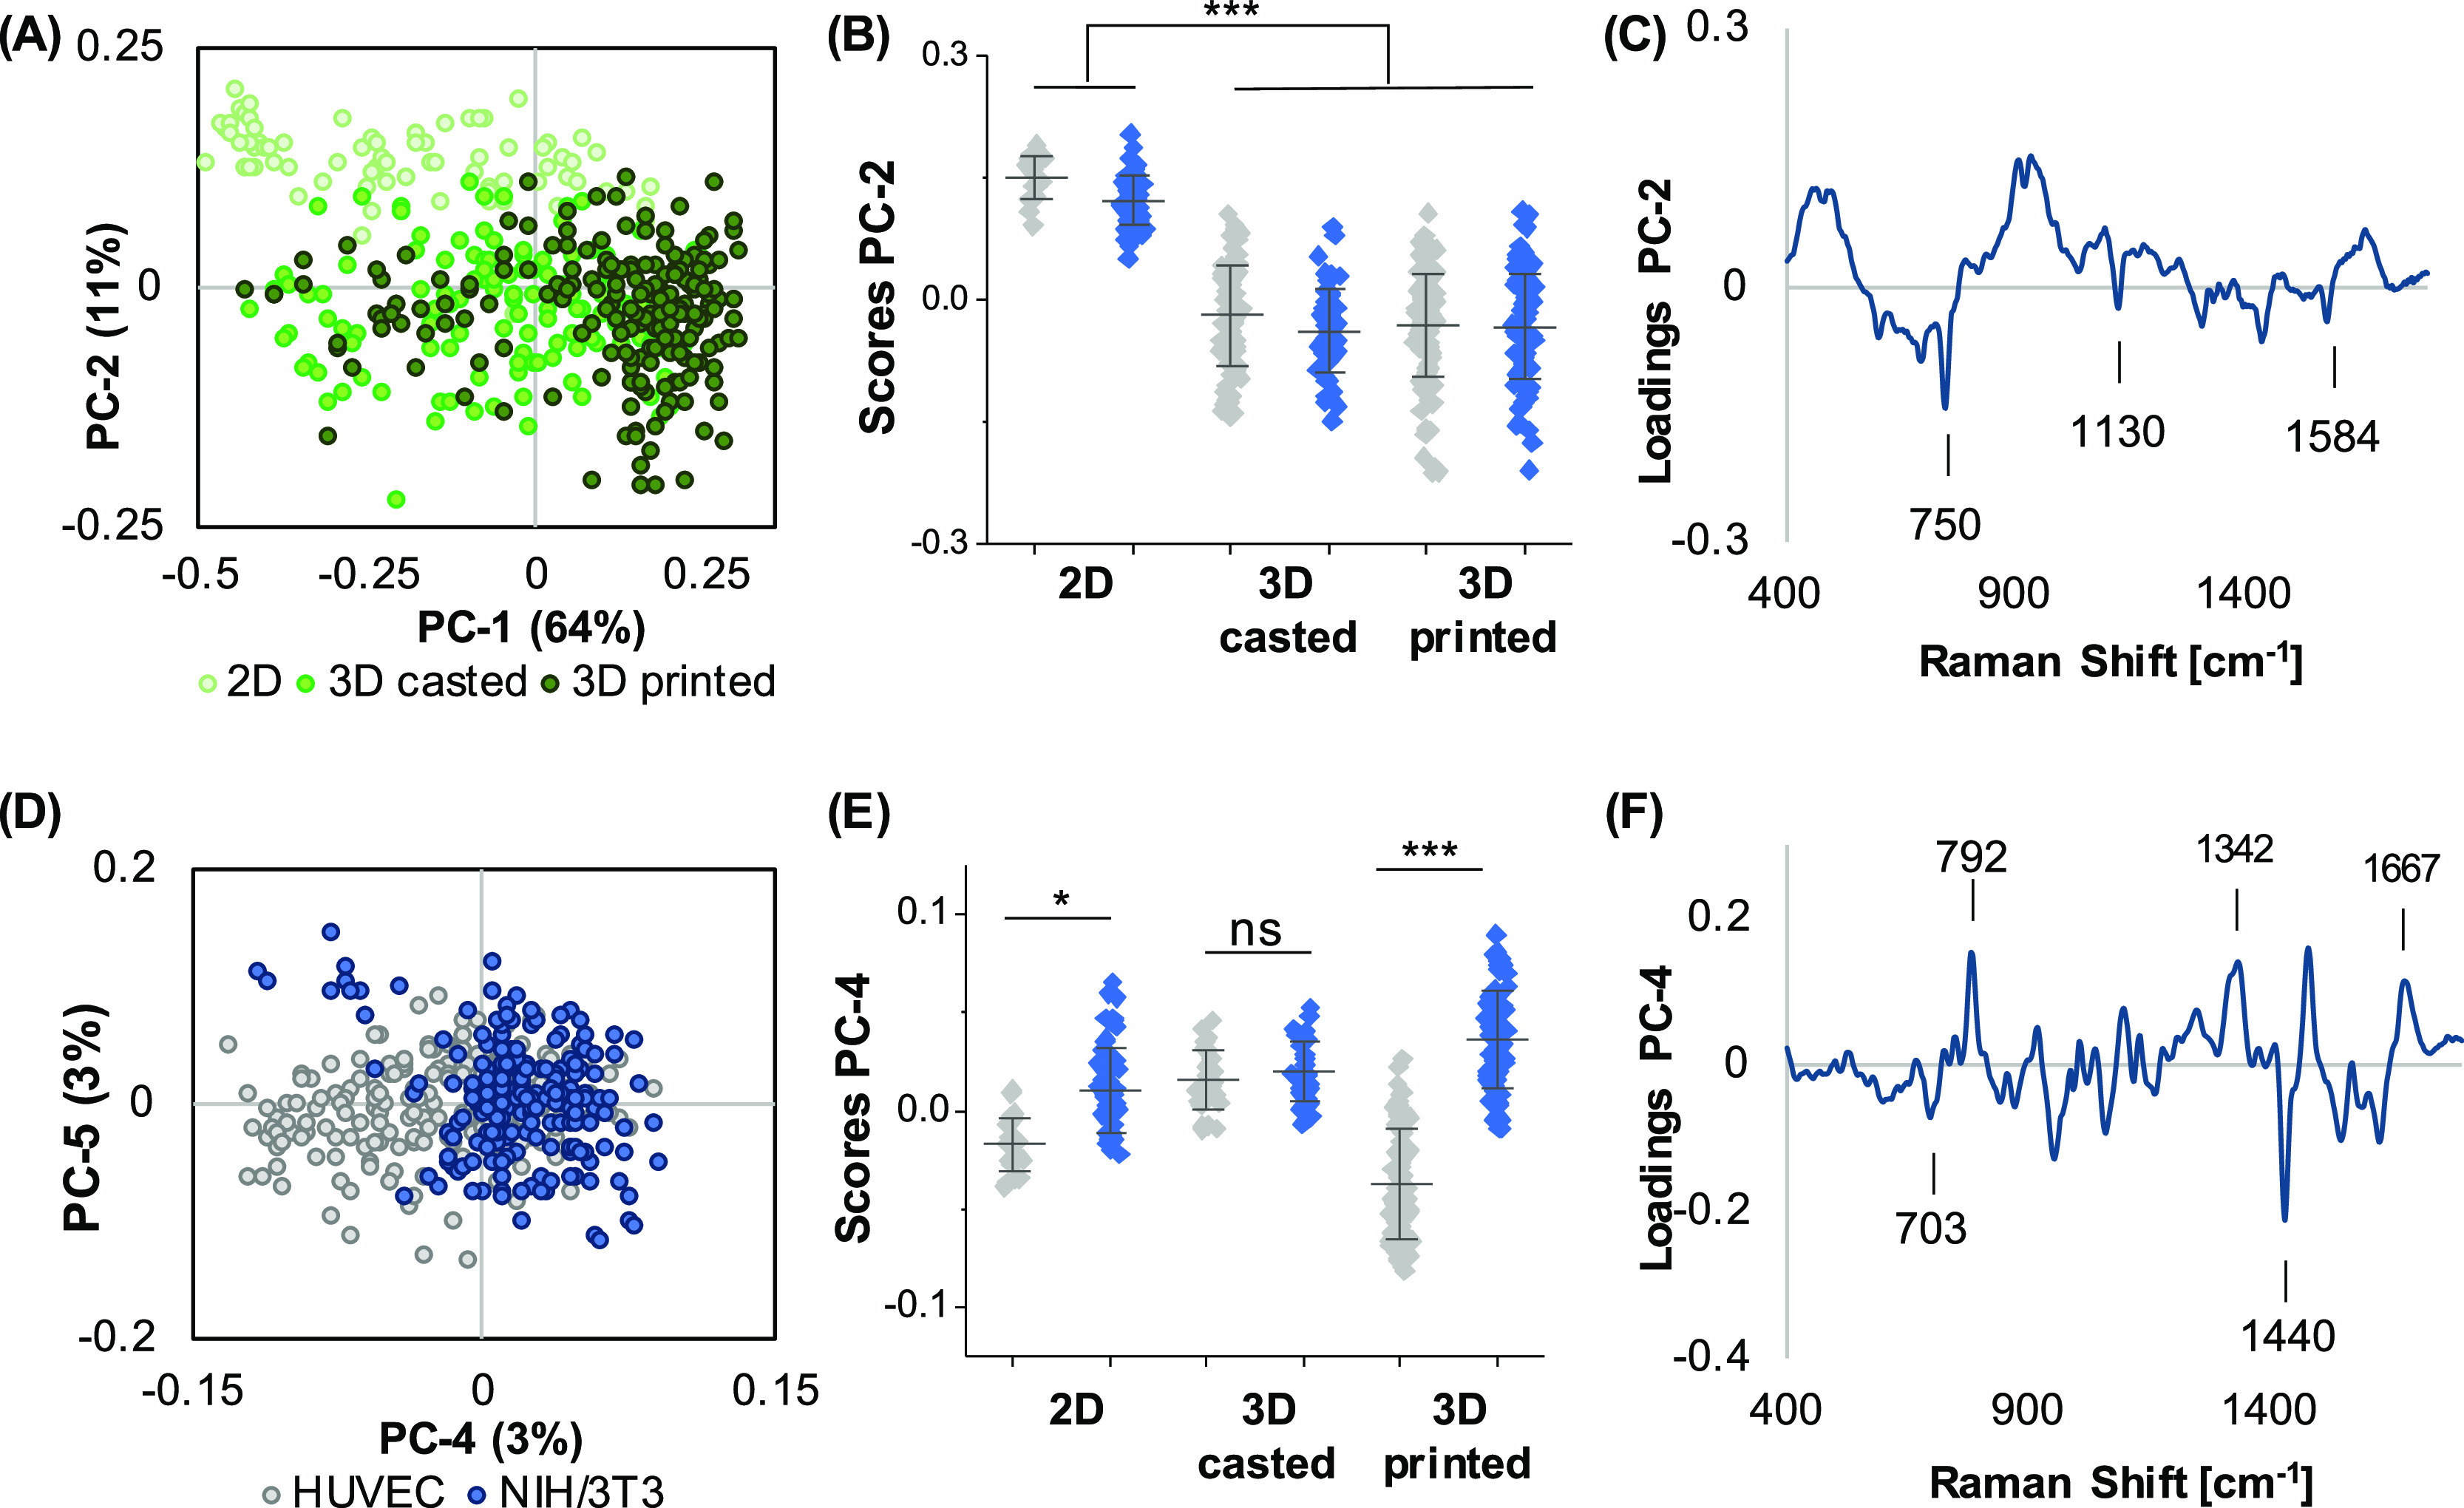
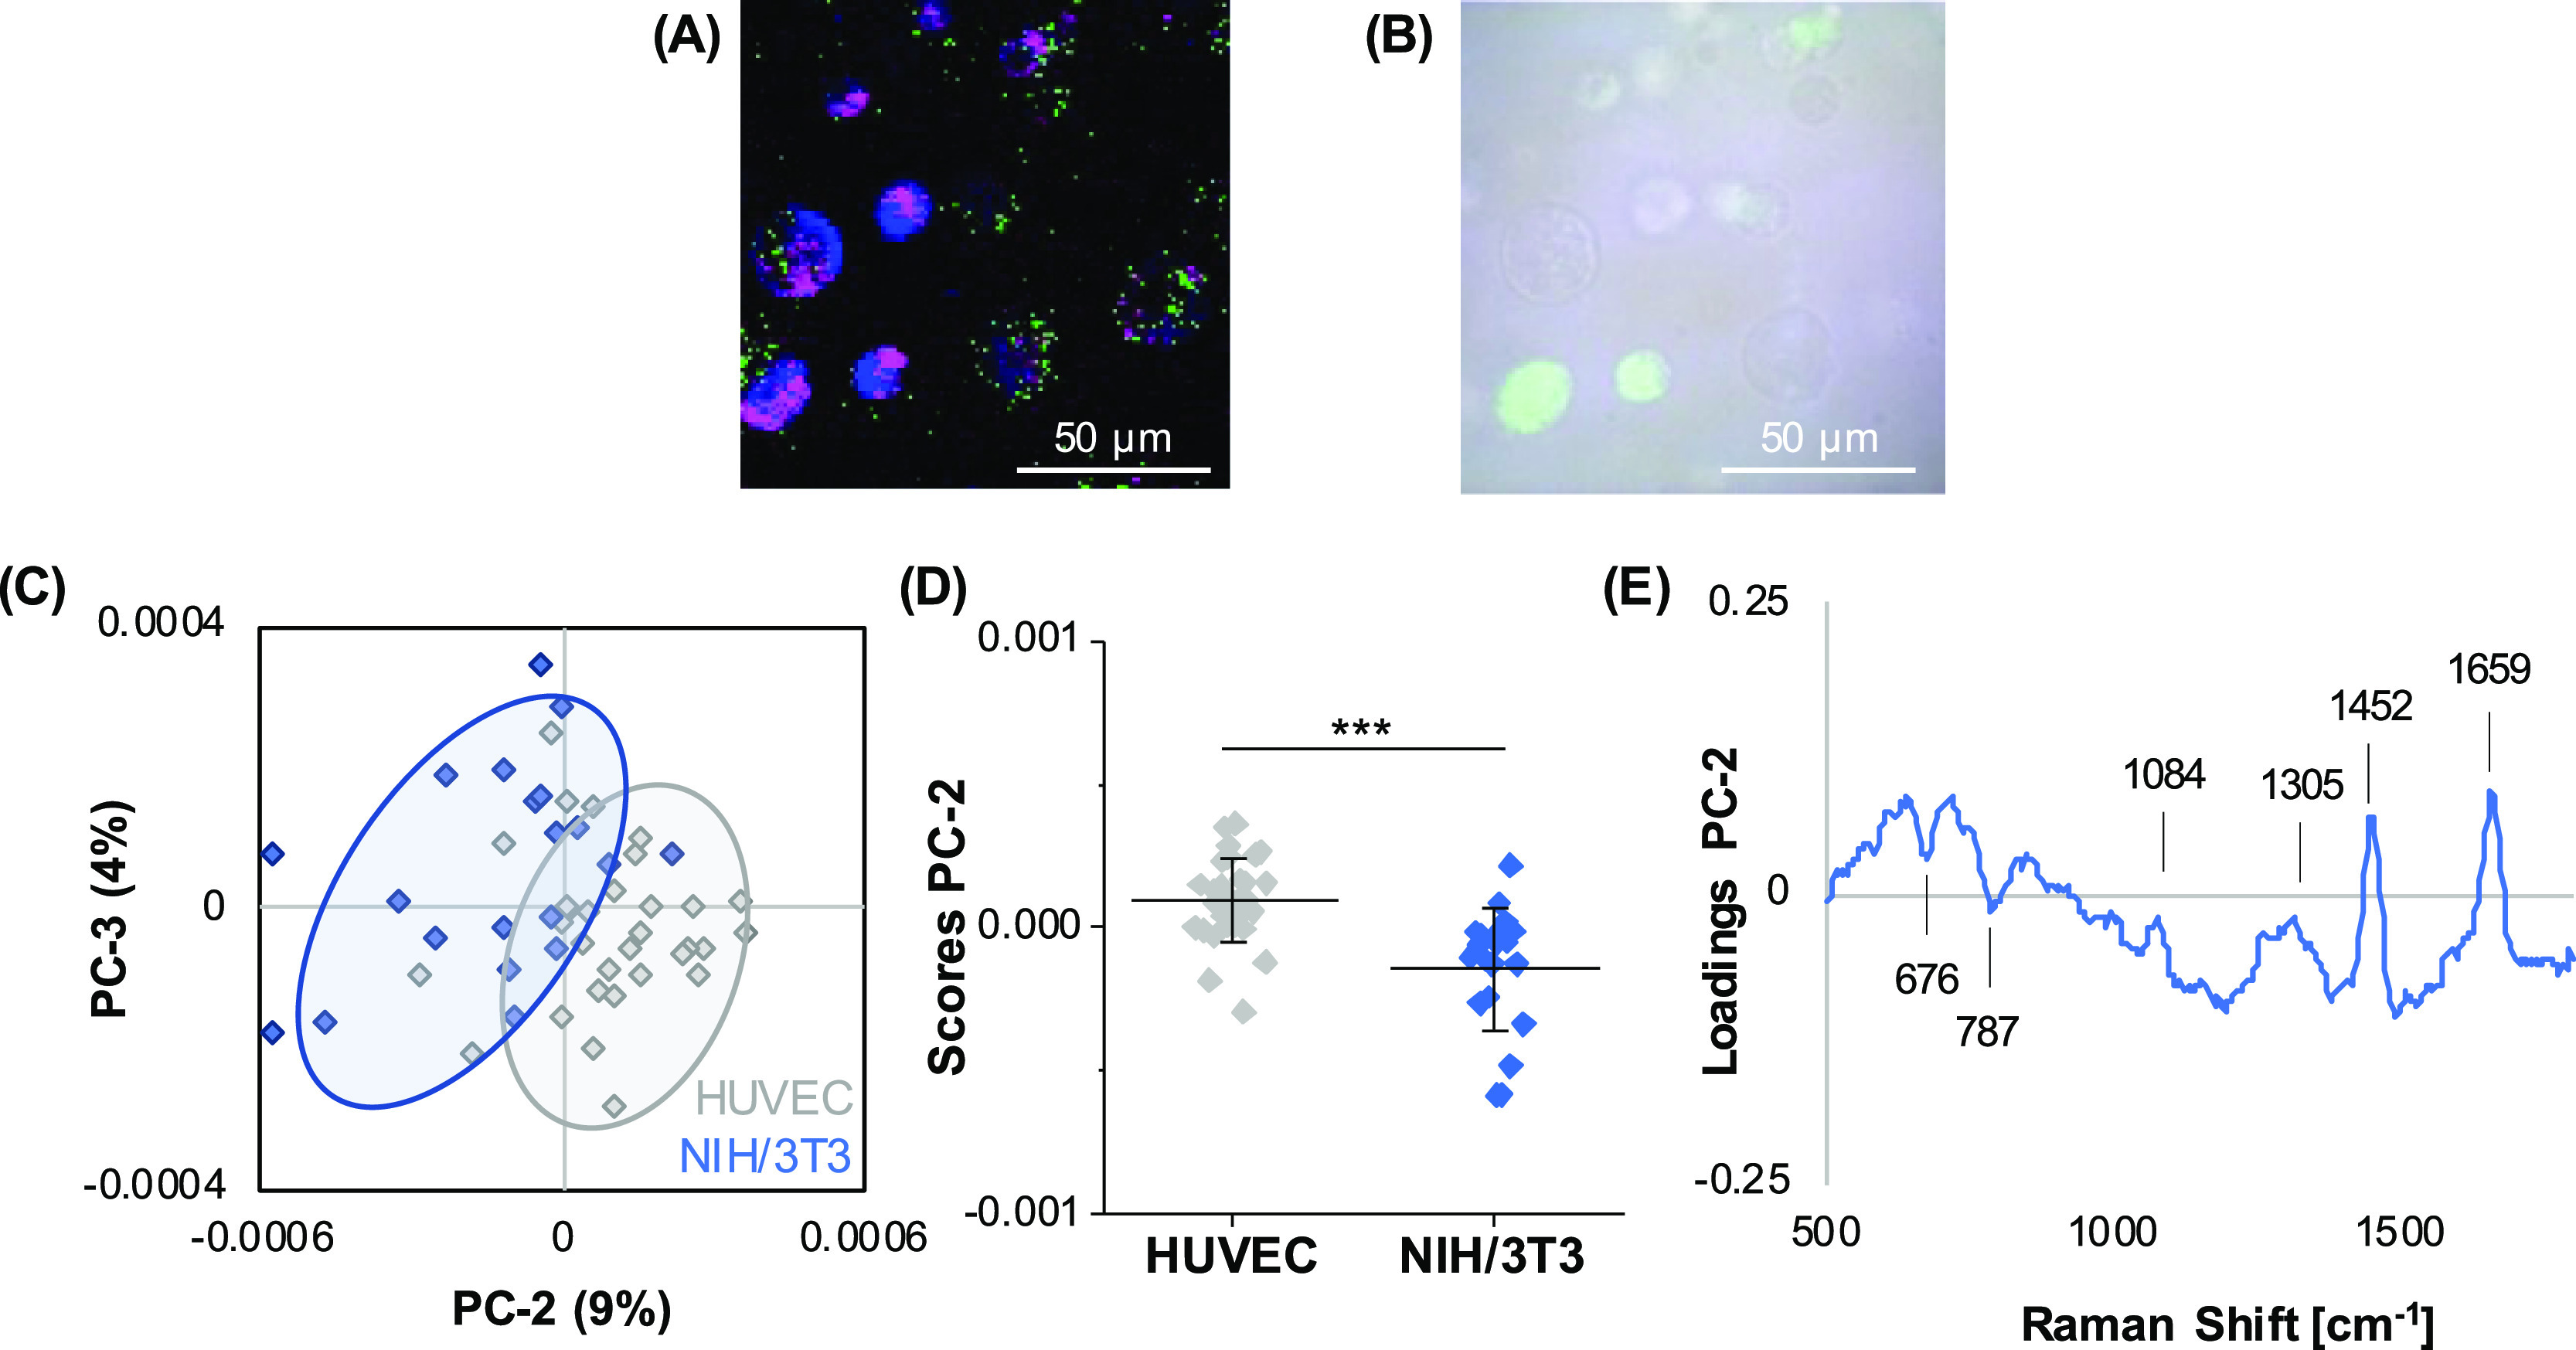
3D bioprinting is an emerging biofabrication strategy using bioinks, comprising cells and biocompatible materials, to produce functional tissue models. Despite progress in building increasingly complex objects, biological analyses in printed constructs remain challenging. Especially, methods that allow non-invasive and non-destructive evaluation of embedded cells are largely missing. Here, we implemented Raman imaging for molecular-sensitive investigations on bioprinted objects. Different aspects such as culture formats (2D, 3D-cast, and 3D-printed), cell types (endothelial cells and fibroblasts), and the selection of the biopolymer (alginate, alginate/nanofibrillated cellulose, alginate/gelatin) were considered and evaluated. Raman imaging allowed for marker-independent identification and localization of subcellular components against the surrounding biomaterial background. Furthermore, single-cell analysis of spectral signatures, performed by multivariate analysis, demonstrated discrimination between endothelial cells and fibroblasts and identified cellular features influenced by the bioprinting process. In summary, Raman imaging was successfully established to analyze cells in 3D culture in situ and evaluate them with regard to the localization of different cell types and their molecular phenotype as a valuable tool for quality control of bioprinted objects.

Keywords: Raman microspectroscopy; bioinks; extrusion-based bioprinting; molecular imaging; non-invasive cell analysis.


Conflict of interest statement

The authors declare no competing financial interest.

Figures

Figure 1
Figure 1
Different cell types in 2D culture can be distinguished based on their spectral fingerprint. (A) Upper panel: NIH/3T3 fibroblasts and HUVECs cultured on TCP were fixed and stained to visualize the actin cytoskeleton (green) and DNA (blue). Lower panel: Raman imaging to visualize the cellular components DNA (blue), lipids (pink), and proteins (green). Raman images revealed different proportions of the cellular components. In HUVECs, lipids appeared to be more abundant than in NIH/3T3 fibroblasts. (B) Representative single-cell average spectra for HUVECs (gray) and NIH/3T3 fibroblasts (blue). (C) PCA of single-cell average spectra demonstrated a clear clustering between the two cell types based on a difference in PC-2 score values. (D) Underlying spectral features linked to the observed separation are described by the PC-2 loading plot. (E) Non-paired t-test, n ≥ 30, *p ≤ 0.05. Scale bars equal 100 μm.
Figure 2
Figure 2
Penetration depth of Raman spectroscopy in different biomaterial inks without cells. (A) Inks were cast into gels of approx. 1 mm in height. (B–D) Raman images were acquired in the XZ-direction over the full depth of alginate-NFC (B), alginate (C), and alginate/gelatin (D) inks. The ink (green), glass (yellow), water (blue), and the basic coating (red) were localized based on their different spectral signatures. Scale bars equal 200 μm.(E) Penetration depths were determined in the Raman images. Mean and SD of three independent samples, Kruskal–Wallis test, *p ≤ 0.05. (F) Background spectra of inks.
Figure 3
Figure 3
Raman imaging of NIH/3T3 fibroblasts in alginate, alginate-NFC, and alginate/gelatin bioinks. TCA identified three spectral signatures assigned to DNA (blue), lipids (pink), and proteins (green) (A) and allowed us to visualize their distribution within the cells (B). Actin cytoskeleton and nuclei of NIH/3T3 fibroblasts were labeled with phalloidin oregon green (green) and propidium iodide (red), respectively. Scale bar equals 10 μm.
Figure 4
Figure 4
Raman imaging of different cell types in alginate/gelatin bioink. (A) NIH/3T3 fibroblasts or HUVECs were separately embedded in alginate/gelatin bioink and analyzed in situ by fluorescence microscopy, Raman imaging, and TCA. Upper panel: the actin cytoskeleton of NIH/3T3 fibroblasts and HUVECs was stained with phalloidin oregon green (green) and nuclei were labeled with propidium iodide (red). Cells were imaged by confocal microscopy. Scale bar equals 25 μm. Lower panel: Raman imaging of NIH/3T3 fibroblasts and HUVECs to visualize cellular component DNA (blue), lipids (pink), and proteins (green). Scale bar equals 10 μm. (B) Representative average spectra for HUVECs and NIH/3T3 fibroblasts. (C) Single-cell average spectra were compared by PCA. PC-2 indicated clustering of individual celltypes (C,D). Spectral differences are described in the loading plot (E). Non-paired t-test, n ≥ 30, *p ≤ 0.05.
Figure 5
Figure 5
Different cell types in printed alginate/gelatin bioinks can be distinguished based on their spectral fingerprints. (A) Scheme and representative macroscopic image of a printed 10 × 10 × 0.3 mm grid. 2.5 mg/mL of cochenille red was added to alginate/gelatin bioink for better visualization. (B) Raman imaging of printed objects of alginate/gelatin bioinks containing NIH/3T3 fibroblasts or HUVECs was performed to visualize cellular component DNA (blue), lipids (pink), and proteins (green). In addition to previous TCAs, an additional spectral component was identified that could be assigned to mitochondrial activity (light blue). (C,D) PCA analysis of single-cell average spectra reveals a clear separation of both cell types in PC-3. (E) Correlating PC-3 loading plot. Non-paired t-test, n ≥ 60, *p < 0.05. Scale bar equals 10 μm.
Figure 6
Figure 6
Cell discrimination in different culture formats. PCA of the full data set including both cell types in 2D and 3D (cast and printed) conditions was performed. (A,B) PC-1/PC-2 scores plot reveals a clustering between 2D and 3D printed cells in PC-2, differing significantly from 2D, which is correlated to the spectral signatures demonstrated in the PC-2 loading (C). PC-4/PC-5 score plot (D) still enables differentiation of both cell types by PC-4. (E) One-way ANOVA of PC-4 score values for each origin did not allow for cell distinction within the 3D cast group but within the 2D and 3D printed groups. Spectral features for the cell type discrimination are described in the loading plot (F). n ≥ 30, *p ≤ 0.05.
Figure 7
Figure 7
Raman analysis of a mixture of different cell types in cast alginate/gelatin bioinks. Single-cell average spectra were extracted from hyperspectral maps generated of bioinks containing a mixture of HUVECs (unlabeled) and NIH/3T3 cells (CellTracker Green positive) (A). Fluorescence/brightfield overlay images served as the control (B). PCA score plot (C) and comparison of PC score values (D) revealed a clustering within both cell types in PC-2. Spectral differences between the groups are indicated in the loading plot (E). Non-paired t-test, n > 30, *p ≤ 0.05.

Similar articles

Cited by

References

    1. Matai I.; Kaur G.; Seyedsalehi A.; McClinton A.; Laurencin C. T. Progress in 3D Bioprinting Technology for Tissue/Organ Regenerative Engineering. Biomaterials 2020, 226, 119536.10.1016/j.biomaterials.2019.119536. - DOI - PubMed
    1. Murphy S. V.; Atala A. 3D Bioprinting of Tissues and Organs. Nat. Biotechnol. 2014, 32, 773–785. 10.1038/nbt.2958. - DOI - PubMed
    1. Sun W.; Starly B.; Daly A. C.; Burdick J. A.; Groll J.; Skeldon G.; Shu W.; Sakai Y.; Shinohara M.; Nishikawa M.; Jang J.; Cho D.-W.; Nie M.; Takeuchi S.; Ostrovidov S.; Khademhosseini A.; Kamm R. D.; Mironov V.; Moroni L.; Ozbolat I. T. The Bioprinting Roadmap. Biofabrication 2020, 12, 022002.10.1088/1758-5090/ab5158. - DOI - PubMed
    1. Bociaga D.; Bartniak M.; Grabarczyk J.; Przybyszewska K. Sodium Alginate/Gelatine Hydrogels for Direct Bioprinting—the Effect of Composition Selection and Applied Solvents on the Bioink Properties. Materials 2019, 12, 2669.10.3390/ma12172669. - DOI - PMC - PubMed
    1. Gungor-Ozkerim P. S.; Inci I.; Zhang Y. S.; Khademhosseini A.; Dokmeci M. R. Bioinks for 3D Bioprinting: an Overview. Biomater. Sci. 2018, 6, 915–946. 10.1039/c7bm00765e. - DOI - PMC - PubMed