. 2022 Jun 28;156(24):245104.
doi: 10.1063/5.0089556.

Microcompartment assembly around multicomponent fluid cargoes

Affiliations

Microcompartment assembly around multicomponent fluid cargoes

Lev Tsidilkovski et al. J Chem Phys. .

Abstract

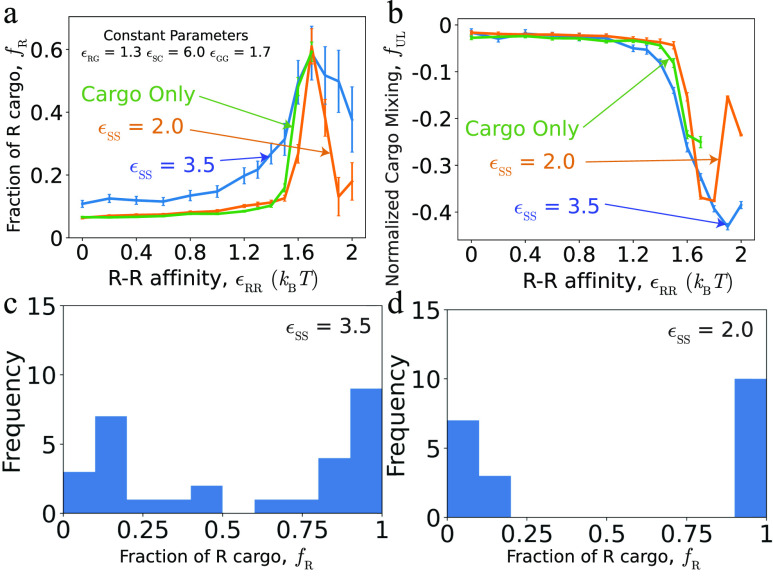
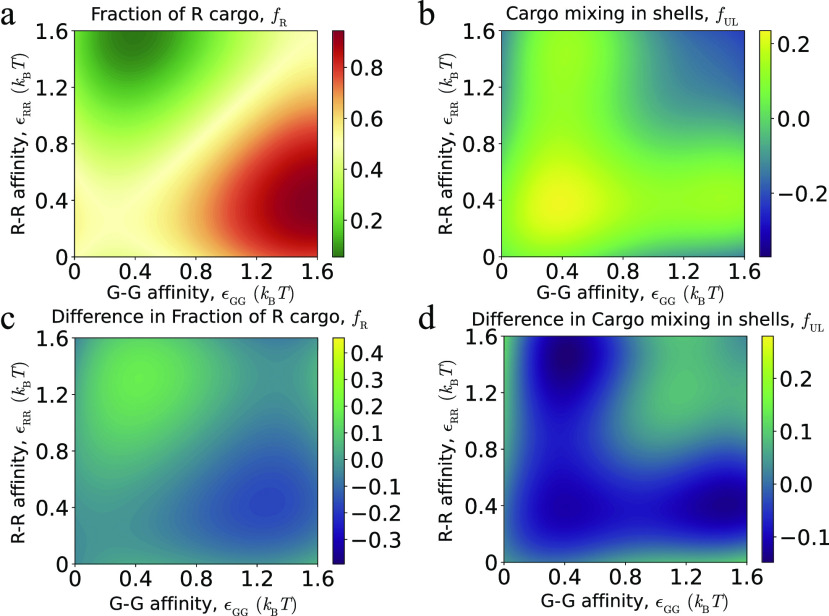
This article describes dynamical simulations of the assembly of an icosahedral protein shell around a bicomponent fluid cargo. Our simulations are motivated by bacterial microcompartments, which are protein shells found in bacteria that assemble around a complex of enzymes and other components involved in certain metabolic processes. The simulations demonstrate that the relative interaction strengths among the different cargo species play a key role in determining the amount of each species that is encapsulated, their spatial organization, and the nature of the shell assembly pathways. However, the shell protein-shell protein and shell protein-cargo component interactions that help drive assembly and encapsulation also influence cargo composition within certain parameter regimes. These behaviors are governed by a combination of thermodynamic and kinetic effects. In addition to elucidating how natural microcompartments encapsulate multiple components involved within reaction cascades, these results have implications for efforts in synthetic biology to colocalize alternative sets of molecules within microcompartments to accelerate specific reactions. More broadly, the results suggest that coupling between self-assembly and multicomponent liquid-liquid phase separation may play a role in the organization of the cellular cytoplasm.


Figures

FIG. 1.
FIG. 1.
Description of the model. (a) Each shell subunit contains “Attractors” (green circles) on the perimeter, which define the shape of the subunit. (b) Attractive interactions between Attractors drive subunit dimerization. Complementary pairs of Attractors are indicated by green arrows in (a) for the pentamer–hexamer interface and in (b) for the hexamer–hexamer interface. A combination of Top–Top (T) and Bottom–Bottom (b) repulsions controls the subunit–subunit angle in a complete shell. (c) Bottom pseudoatoms “B” bind cargo molecules (shown as R and G). (d) The cargo molecules have attractive interactions between each other that depend on pair type.
FIG. 2.
FIG. 2.
The bulk phase behavior of cargo particles (in the absence of shell subunits) as a function of their binding affinities. (a)–(c) The fraction of R particles in the high-density phase, fR, as a function of the R–R and G–G affinities for different R–G affinities: (a) weak ɛRG = 1.0, (b) moderate ɛRG = 1.3, and (c) strong ɛRG = 1.6. All energies are given in units of the thermal energy, kBT. The symbols on the plot identify corresponding snapshots below each plot that illustrate the phase behavior at the indicated value of ɛRG. (d)–(f) For the same parameters, the fraction of unlike cargo particles in the first solvation shell relative to random mixing, fUL, defined in the text. Each simulation contains 46 938 total cargo particles, with equal composition of R and G.
FIG. 3.
FIG. 3.
Assembly pathways. Snapshots from simulation trajectories illustrate the classes of assembly pathways discussed in the text. In each row, the first four snapshots show frames at indicated time points (in units of the nondimensional time τ), while the last snapshot is a cutaway view of the shell to show the encapsulated cargo. The parameters characterizing binding affinities are listed under each row (shell–shell, ɛSS; shell–cargo, ɛSC; R–R and G–G, ɛRR and ɛGG; and R–G, ɛRG). (a) All affinities are relatively strong, driving rapid and simultaneous coalescence of both cargo types and shell assembly (one-step assembly). The encapsulated cargo is uniformly mixed (Multimedia view). (b) At ɛSS = 3.5 kBT, high ɛRR but moderate ɛGG and ɛRG lead to one-step assembly and coalescence of R cargo, with G cargo essentially excluded from the shell (Multimedia view). (c) At ɛSS = 2 kBT, strong ɛRR but moderate ɛGG and ɛRG lead to two-step assembly around an almost pure R domain (Multimedia view). (d) Strong ɛGG and ɛRR and moderate ɛRG drive two-step assembly, with coupling between shell closure and cargo compositional fluctuations, leading to encapsulation of nearly pure R and G cargo domains in separate shells. The initial globule that becomes separated is shown in the top cutaway view, while the assembled shells are shown in the bottom view (Multimedia view). (e) Very strong ɛRR, strong ɛGG, and moderate ɛRG lead to two-step assembly around an almost pure G domain. The strength of the ɛRR interaction prevents the subunits from successfully encapsulating the globule of R cargo, while the G cargo is able to bud off similarly to (d) and form a properly assembled shell. The cutaway shows the state of the assembled shell and G cargo domain within as well as the R cargo globule that is unable to properly close (Multimedia view). Supplemental videos corresponding to each of the respective trajectories are included in the SI. Multimedia views: (a) https://doi.org/10.1063/5.0089556.1; (b) https://doi.org/10.1063/5.0089556.2; (c) https://doi.org/10.1063/5.0089556.3; (d) https://doi.org/10.1063/5.0089556.4; and (e) https://doi.org/10.1063/5.0089556.5
FIG. 4.
FIG. 4.
Effect of cargo–cargo affinities on encapsulation for one-step assembly pathways. (a)–(c) Characterization of the encapsulated cargo as a function of the G–G and R–R affinities, for fixed R–G affinity ɛRG = 1.3. (a) The fraction of R particles averaged over all shells fR to characterize the average composition of encapsulated cargo. Snapshots show cutaway views of assembled shells, to illustrate the cargo morphology at corresponding symbols on the plot. (b) The fraction of unlike cargo particles in first solvation shells, fUL, averaged over all shells. (c) The mean number of encapsulated cargo particles per shell, to indicate cargo loading efficiency. (d) The fraction of subunits in complete shells, revealing the effect of cargo–cargo affinities on shell assembly. (e) The shell-to-shell variability of cargo composition, σR,shell, defined as the standard deviation of fR over shells, is shown as a function of the R–R and G–G affinities for three indicated values of ɛRG. High values of σR,shell ≳ 0.4 indicate that different shells have encapsulated pure domains of, respectively, R or G cargo species. To simplify the presentation, we only consider equal R–R and G–G affinities, ɛRR = ɛGG. For (a)–(e), other parameter values are ɛRG = 1.3, shell–cargo affinity ɛSC = 6.0, and shell–shell affinity ɛSS = 3.5.
FIG. 5.
FIG. 5.
Comparison of cargo encapsulation for one-step and two-step pathways. The fraction of R cargo in completed shells fR (a) and the fraction of unlike cargo particles in first solvation shells fUL (b) are shown as a function of ɛRR for the lower and higher shell–shell affinities ɛSS = 2.0 and ɛSS = 3.5. Other parameters are ɛGG = 1.7, ɛRG = 1.3, and ɛSC = 6.0. Histograms of cargo composition within individual shells to illustrate shell-to-shell variability, for the peak in panel (a) at ɛRR = ɛGG = 1.7 and ɛRG = 1.7, for (c) one-step and (d) two-step pathways.
FIG. 6.
FIG. 6.
Fraction of shell subunits in complete shells in the two-step assembly pathway regime, ɛSS = 2.0 and ɛRG = 1.3.
FIG. 7.
FIG. 7.
Effects of shell–cargo and shell–shell affinity on cargo composition reveal thermodynamic and kinetic influences on encapsulation. (a) The fraction of encapsulated R particles fR as a function of shell–cargo affinity ɛSC, for shell–shell affinities ɛSS = 2.0, and ɛSS = 3.5. To assess the importance of dynamics on these results, fR is also shown for the “equilibrium” simulations in which cargo can exchange between shell interiors and the bulk. Other parameters are ɛGG = 1.7 and ɛRR = ɛRG = 1.3. (b) Cargo composition fR as a function of shell–shell affinity ɛSS, at a constant shell–cargo affinity of ɛSC = 6.0. Other parameters are ɛRR = 1.3, with ɛGG = 1.7 and ɛRG = 1.3. The “equilibrium” results are also shown, as a straight line since they do not depend on ɛSS.
FIG. 8.
FIG. 8.
Comparison of encapsulated cargo between equilibrium and dynamical simulations. (a) and (b) The fraction of R particles (a) and mixing (b) are shown as a function of R–R and G–G affinities. Other parameters are ɛRG = 1.3 and ɛSC = 6.0, as in Fig. 4. (c) and (d) Difference between cargo encapsulation in dynamical assembly simulations and equilibrium. The plots show the differences between the quantities fR and fUL for the dynamical simulations in Fig. 4 (with ɛSS = 3.5) and equilibrium simulations [panels (a) and (b) of this figure].

Similar articles

Cited by

References

    1. Brangwynne C. P., Eckmann C. R., Courson D. S., Rybarska A., Hoege C., Gharakhani J., Jülicher F., and Hyman A. A., “Germline P granules are liquid droplets that localize by controlled dissolution/condensation,” Science 324, 1729–1732 (2009).10.1126/science.1172046 - DOI - PubMed
    1. Brangwynne C. P., Tompa P., and Pappu R. V., “Polymer physics of intracellular phase transitions,” Nat. Phys. 11, 899–904 (2015).10.1038/nphys3532 - DOI
    1. Lee C. F., Brangwynne C. P., Gharakhani J., Hyman A. A., and Jülicher F., “Spatial organization of the cell cytoplasm by position-dependent phase separation,” Phys. Rev. Lett. 111, 088101 (2013).10.1103/PhysRevLett.111.088101 - DOI - PubMed
    1. Brangwynne C. P., “Phase transitions and size scaling of membrane-less organelles,” J. Cell Biol. 203, 875–881 (2013).10.1083/jcb.201308087 - DOI - PMC - PubMed
    1. Weber S. C. and Brangwynne C. P., “Getting RNA and protein in phase,” Cell 149, 1188–1191 (2012).10.1016/j.cell.2012.05.022 - DOI - PubMed

Substances