. 2022 Jul 1;12(1):11168.
doi: 10.1038/s41598-022-14646-4.

Crowd flow forecasting via agent-based simulations with sequential latent parameter estimation from aggregate observation

Affiliations

Crowd flow forecasting via agent-based simulations with sequential latent parameter estimation from aggregate observation

Fumiyasu Makinoshima et al. Sci Rep. .

Abstract

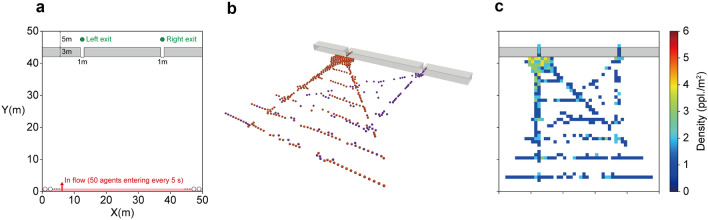
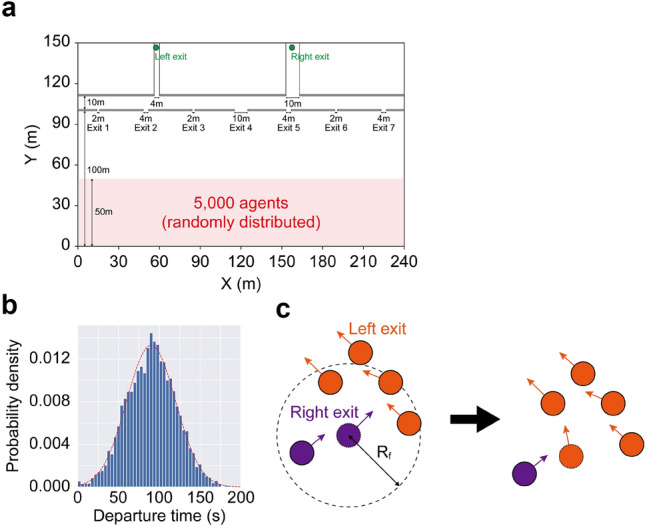
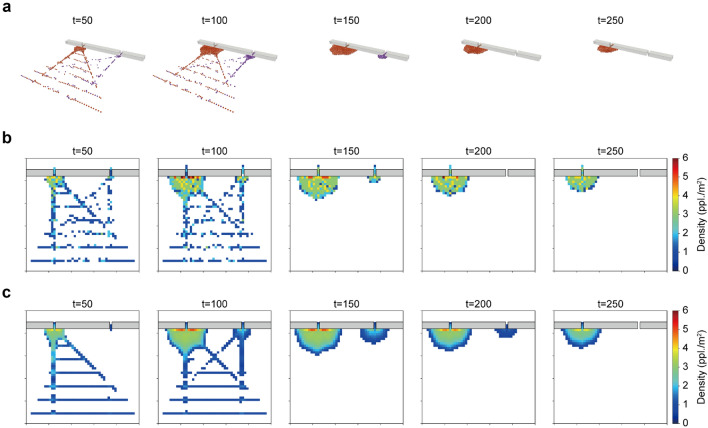
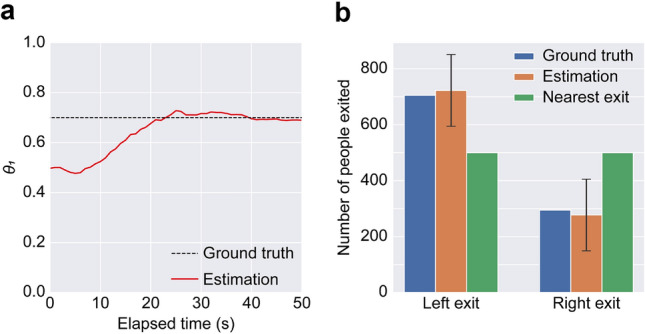
Unlike conventional crowd simulations for what-if analysis, agent-based crowd simulations for real-time applications are an emerging research topic and an important tool for better crowd managements in smart cities. Recent studies have attempted to incorporate the real-time crowd observations into crowd simulations for real-time crowd forecasting and management; however, crowd flow forecasting considering individual-level microscopic interactions, especially for large crowds, is still challenging. Here, we present a method that incorporates crowd observation data to forecast a large crowd flow, including thousands of individuals, using a microscopic agent-based model. By sequentially estimating both the crowd state and the latent parameter behind the crowd flows from the aggregate crowd density observation with the particle filter algorithm, the present method estimates and forecasts the large crowd flow using agent-based simulations that incorporate observation data. Numerical experiments, including a realistic evacuation scenario with 5000 individuals, demonstrated that the present method could successfully provide reasonable crowd flow forecasting for different crowd scenarios, even with limited information on crowd movements. These results support the feasibility of real-time crowd flow forecasting and subsequent crowd management, even for large but microscopic crowd problems.


Conflict of interest statement

F.M. and Y.O. are employees of Fujitsu Limited and have filed a Japanese patent application (No. 2021-205347, pending) in the name of Fujitsu Limited, relating to the crowd forecasting method.

Figures

Figure 1
Figure 1
Schematic illustration of the proposed crowd forecasting approach. By sequentially estimating the likely crowd states and latent parameters behind the crowd flow based on observation data, the present method provides better crowd flow forecasting.
Figure 2
Figure 2
Model setup and synthesised crowd for Experiment 1. a Configuration of the environment. b Synthesized crowd flow. The purple and orange particles represent agents who chose the right and left exits, respectively. c Assumed corresponding density observation to be obtained.
Figure 3
Figure 3
Model setup of Experiment 2 (evacuation). a Configuration of the environment. b Assumed departure timing. The synthesised departure timing for 5000 agents is visualised as a histogram with the assumed theoretical distribution (red dashed line). c Schematic view of the follower agent model. At each time step, the follower agents search for neighbouring agents moving within Rf and change their exit preference by following the local majority.
Figure 4
Figure 4
Synthesised crowd flow in Experiment 2. Three cases of the synthesised crowd flow at t=200 s are visualised with the initial agent distribution at t=0 s. The orange and purple particles represent agents who chose the left and right exits, respectively. a Initial state of the evacuees. b Evacuating crowd at t=200 s in Case 1. c Evacuating crowd at t=200 s in Case 2. d Evacuating crowd at t=200 s in Case 3. The randomness of the exit choice in a small fraction of non-follower agents with a large number of following agents can cause a significantly different evacuation flow tendency, which is difficult to predict via what-if simulations in advance.
Figure 5
Figure 5
Comparisons between the ground truth simulation results and the forecasting results. a Ground truth simulation results. b Ground truth density maps (corresponding observations). c Estimated density maps (forecasting). Note that the estimated density value was visualised as an NaN colour (white) if the rounded value was lower than one.
Figure 6
Figure 6
Estimated parameter and the resulting statistics. a Time series of the estimated parameter θ1. The black dashed line represents the assumed parameter (0.7) when synthesising the observation. The estimated parameter θ1 is visualised as a solid red line. b Comparisons of the cumulative number of people for the right and left exit. The error bars for the estimation represent the standard deviations.
Figure 7
Figure 7
Crowd flow forecasting results for Case 1. a Estimation of T90 with different observation periods. Error bars represent the standard deviation of the estimation. The grey dashed line represents the ground truth value. b Comparison of the estimated crowd flow at t=100 s and 300 s. Ground truth data are visualised in the top panel. c The time series of the estimated θ2 with the 200 s observation. The red line represents the estimated θ2. The cumulative departure distribution is shown as a grey histogram for reference.
Figure 8
Figure 8
Forecasting results for Cases 2 and 3. a Comparison of the crowd flow between the estimation and the ground truth data at t=300 s. b Comparison of the T90 value between the estimation and the ground truth.
Figure 9
Figure 9
Forecasting results with a different number of latent parameters and the ground truth data at t=300 s. a Ground truth observation. b Forecasting result with two latent parameters. c Forecasting result with three latent parameters.
Figure 10
Figure 10
Crowd flow forecasting with limited observation settings. a Schematic view of Setup 1. The blue lines represent the assumed field of views (FOVs) for the limited observations. b Estimated crowd flows with the full and limited observations in Setup 1. c Schematic view of Setup 2. The blue lines represent the assumed FOVs for the limited observations. d Estimated crowd flows with limited observations in Setup 2.

References

    1. Duives DC, Daamen W, Hoogendoorn SP. State-of-the-art crowd motion simulation models. Transp. Res. Part C Emerg. Technol. 2013;37:193–209. doi: 10.1016/j.trc.2013.02.005. - DOI
    1. Kuligowski, E., Peacock, R. & Hoskins, B. In A Review of Building Evacuation Models 2nd edn. (National Institute of Standards and Technology, Technical Note (NIST TN), 2010).
    1. Mordvintsev, A., Krzhizhanovskaya, V., Lees, M. & Sloot, P. Simulation of city evacuation coupled to flood dynamics. In Pedestrian and Evacuation Dynamics 2012, 485–499 (Springer, 2014).
    1. Makinoshima F, Imamura F, Abe Y. Enhancing a tsunami evacuation simulation for a multi-scenario analysis using parallel computing. Simul. Model. Pract. Theory. 2018;83:36–50. doi: 10.1016/j.simpat.2017.12.016. - DOI
    1. Feng T, Yu L-F, Yeung S-K, Yin K, Zhou K. Crowd-driven mid-scale layout design. ACM Trans. Graph. 2016 doi: 10.1145/2897824.2925894. - DOI