

A Multiscale Mathematical Model of Plasmodium Vivax Transmission
- PMID: 35778540
- PMCID: PMC9249727
- DOI: 10.1007/s11538-022-01036-0
A Multiscale Mathematical Model of Plasmodium Vivax Transmission
Abstract
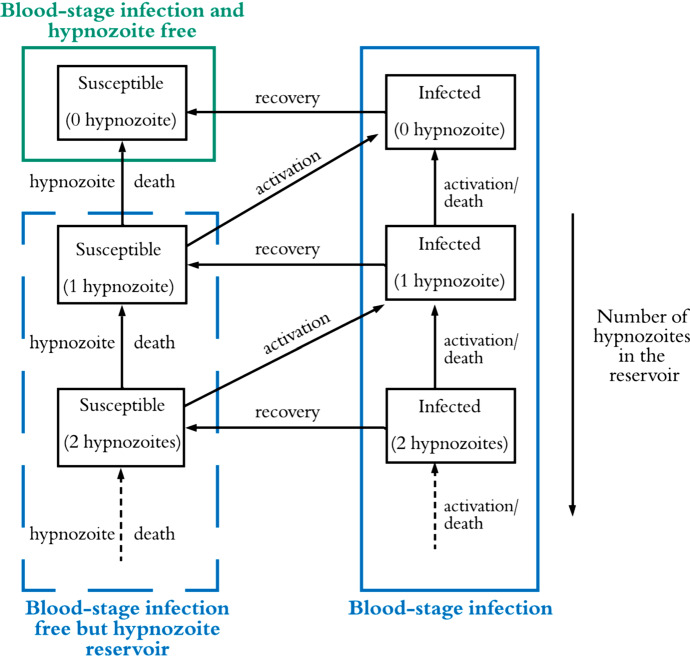
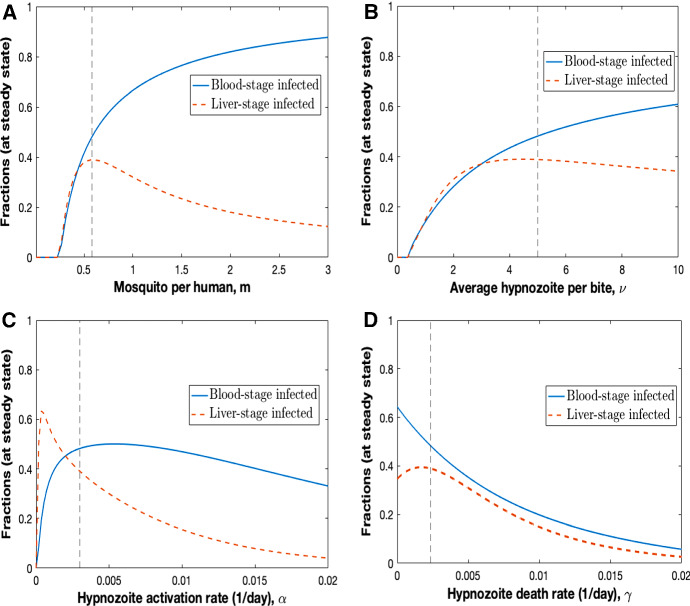
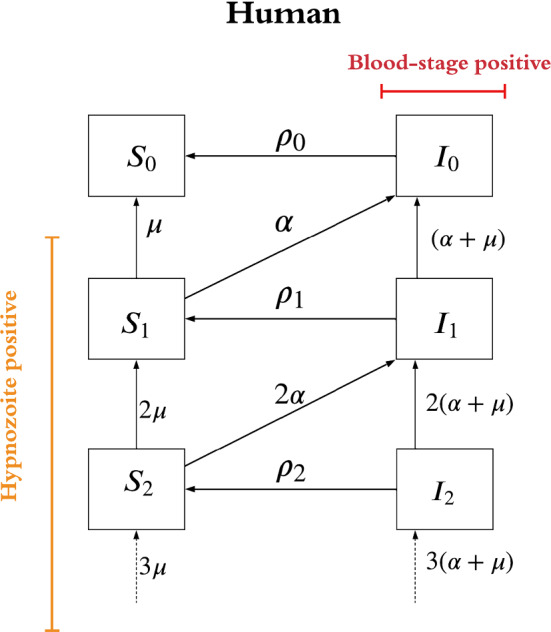
Malaria is caused by Plasmodium parasites which are transmitted to humans by the bite of an infected Anopheles mosquito. Plasmodium vivax is distinct from other malaria species in its ability to remain dormant in the liver (as hypnozoites) and activate later to cause further infections (referred to as relapses). Mathematical models to describe the transmission dynamics of P. vivax have been developed, but most of them fail to capture realistic dynamics of hypnozoites. Models that do capture the complexity tend to involve many governing equations, making them difficult to extend to incorporate other important factors for P. vivax, such as treatment status, age and pregnancy. In this paper, we have developed a multiscale model (a system of integro-differential equations) that involves a minimal set of equations at the population scale, with an embedded within-host model that can capture the dynamics of the hypnozoite reservoir. In this way, we can gain key insights into dynamics of P. vivax transmission with a minimum number of equations at the population scale, making this framework readily scalable to incorporate more complexity. We performed a sensitivity analysis of our multiscale model over key parameters and found that prevalence of P. vivax blood-stage infection increases with both bite rate and number of mosquitoes but decreases with hypnozoite death rate. Since our mathematical model captures the complex dynamics of P. vivax and the hypnozoite reservoir, it has the potential to become a key tool to inform elimination strategies for P. vivax.
Keywords: Hypnozoite activation; Hypnozoite dynamics; Multiscale model; Vivax transmission model.
© 2022. The Author(s).
Figures


Similar articles
-
Optimal Interruption of P. vivax Malaria Transmission Using Mass Drug Administration.Bull Math Biol. 2023 Apr 19;85(6):43. doi: 10.1007/s11538-023-01153-4. Bull Math Biol. 2023. PMID: 37076740 Free PMC article.
-
Mathematical models of Plasmodium vivax transmission: A scoping review.PLoS Comput Biol. 2024 Mar 14;20(3):e1011931. doi: 10.1371/journal.pcbi.1011931. eCollection 2024 Mar. PLoS Comput Biol. 2024. PMID: 38483975 Free PMC article.
-
An Activation-Clearance Model for Plasmodium vivax Malaria.Bull Math Biol. 2020 Feb 12;82(2):32. doi: 10.1007/s11538-020-00706-1. Bull Math Biol. 2020. PMID: 32052192
-
Hypnozoite dynamics for Plasmodium vivax malaria: The epidemiological effects of radical cure.J Theor Biol. 2022 Mar 21;537:111014. doi: 10.1016/j.jtbi.2022.111014. Epub 2022 Jan 10. J Theor Biol. 2022. PMID: 35016895
-
Plasmodium vivax Latent Liver Stage Infection and Relapse: Biological Insights and New Experimental Tools.Annu Rev Microbiol. 2021 Oct 8;75:87-106. doi: 10.1146/annurev-micro-032421-061155. Epub 2021 Jul 1. Annu Rev Microbiol. 2021. PMID: 34196569 Review.
Cited by
-
Generation of a Transgenic Plasmodium cynomolgi Parasite Expressing Plasmodium vivax Circumsporozoite Protein for Testing P. vivax CSP-Based Malaria Vaccines in Non-Human Primates.Vaccines (Basel). 2025 May 17;13(5):536. doi: 10.3390/vaccines13050536. Vaccines (Basel). 2025. PMID: 40432145 Free PMC article.
-
Optimal Interruption of P. vivax Malaria Transmission Using Mass Drug Administration.Bull Math Biol. 2023 Apr 19;85(6):43. doi: 10.1007/s11538-023-01153-4. Bull Math Biol. 2023. PMID: 37076740 Free PMC article.
-
A hybrid transmission model for Plasmodium vivax accounting for superinfection, immunity and the hypnozoite reservoir.J Math Biol. 2024 May 21;89(1):7. doi: 10.1007/s00285-024-02088-7. J Math Biol. 2024. PMID: 38772937 Free PMC article.
-
Superinfection and the hypnozoite reservoir for Plasmodium vivax: a general framework.J Math Biol. 2023 Dec 1;88(1):7. doi: 10.1007/s00285-023-02014-3. J Math Biol. 2023. PMID: 38040981 Free PMC article.
-
Mathematical models of Plasmodium vivax transmission: A scoping review.PLoS Comput Biol. 2024 Mar 14;20(3):e1011931. doi: 10.1371/journal.pcbi.1011931. eCollection 2024 Mar. PLoS Comput Biol. 2024. PMID: 38483975 Free PMC article.
References
-
- Asih Puji BS, Syafruddin Din, Baird John Kevin (2018) Challenges in the control and elimination of plasmodium vivax malaria. In: Towards malaria elimination: a leap forward, p. 77
-
- Baird JK. Real-world therapies and the problem of vivax malaria. N Engl J Med. 2008;359(24):2601–2603. - PubMed
Publication types
MeSH terms
LinkOut - more resources
Full Text Sources
Medical
