. 2022 Sep;144(3):413-435.
doi: 10.1007/s00401-022-02450-3. Epub 2022 Jul 1.

Aberrant NOVA1 function disrupts alternative splicing in early stages of amyotrophic lateral sclerosis

Affiliations

Aberrant NOVA1 function disrupts alternative splicing in early stages of amyotrophic lateral sclerosis

Florian Krach et al. Acta Neuropathol. 2022 Sep.

Abstract

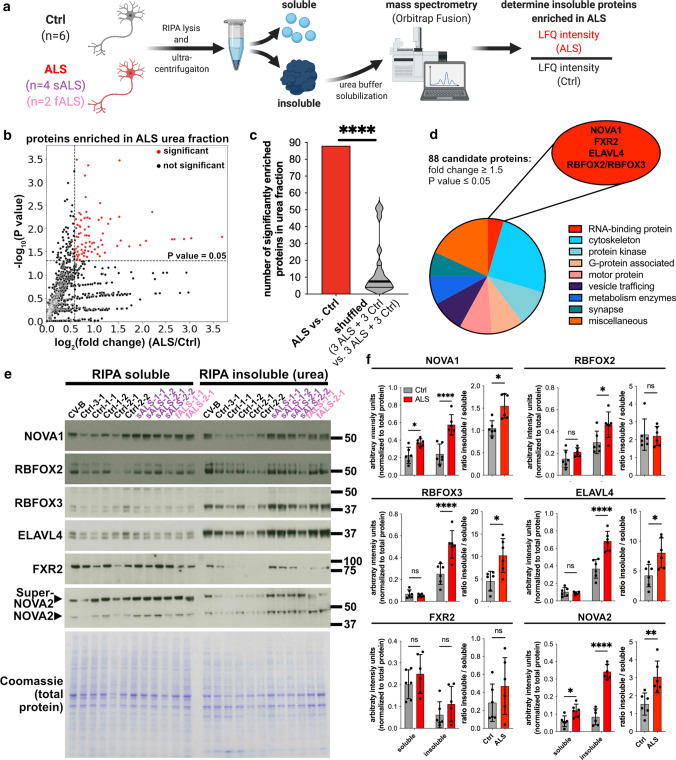
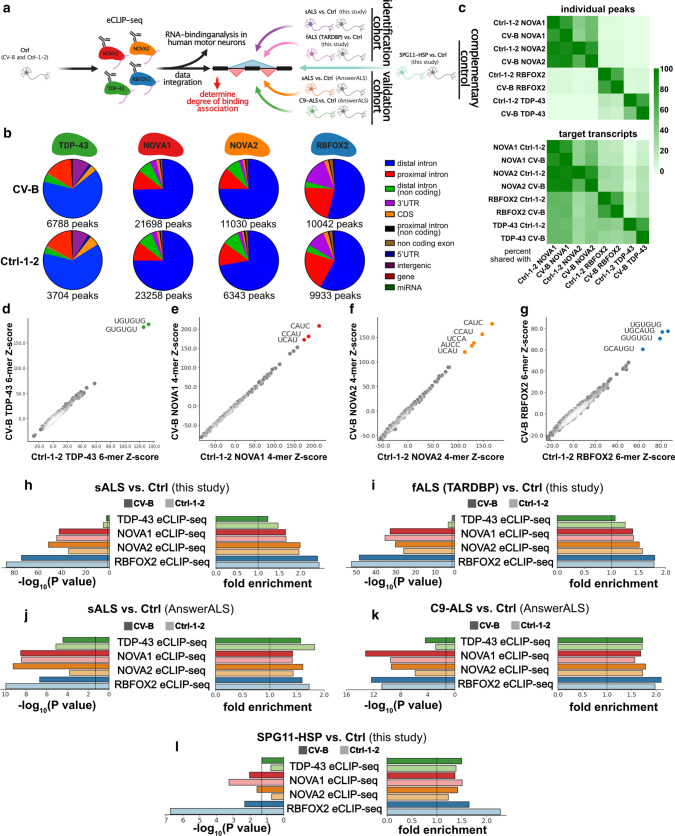
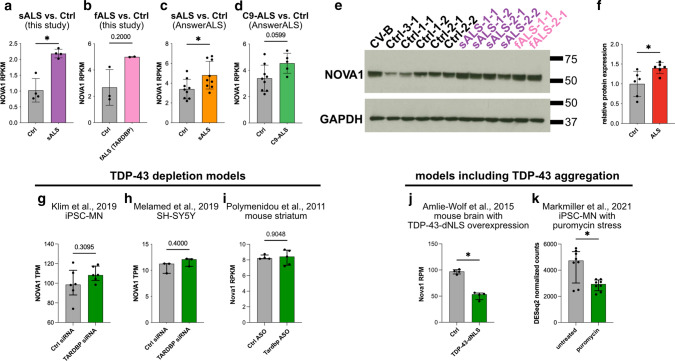
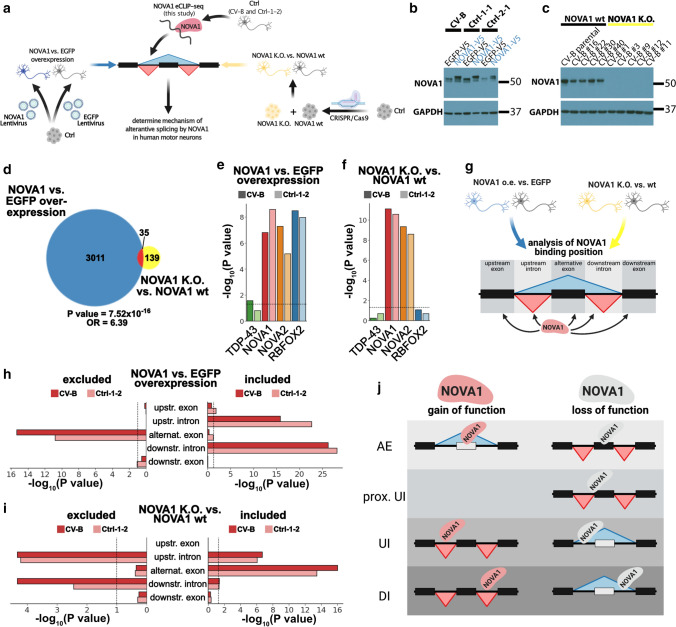
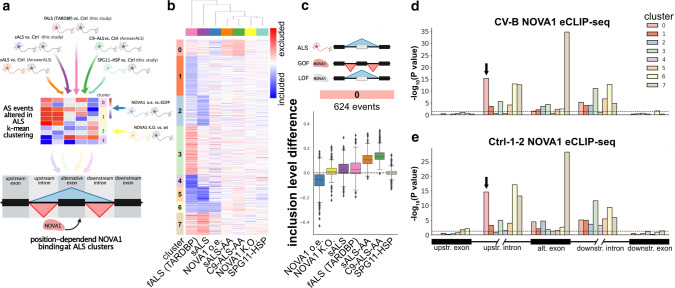
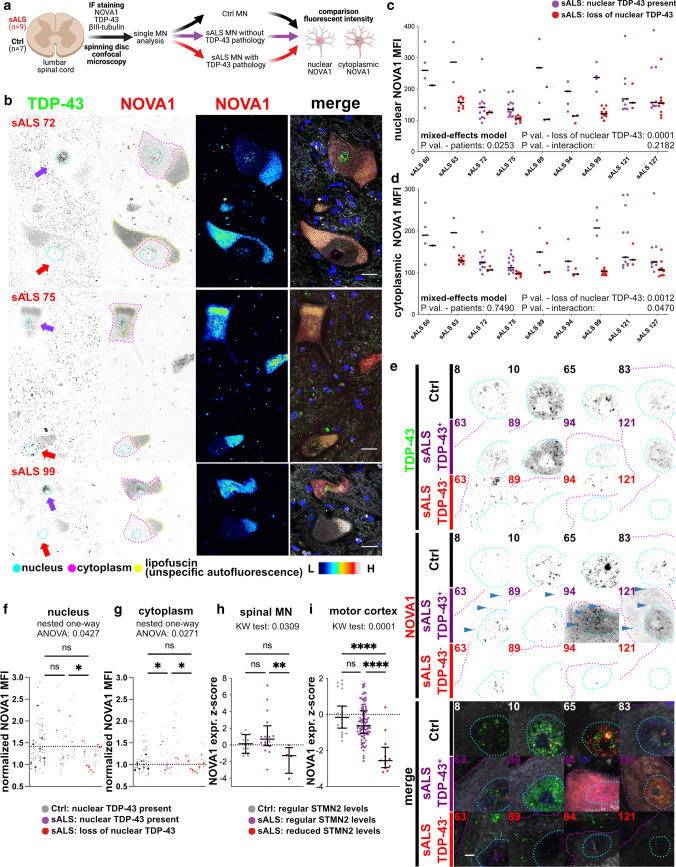
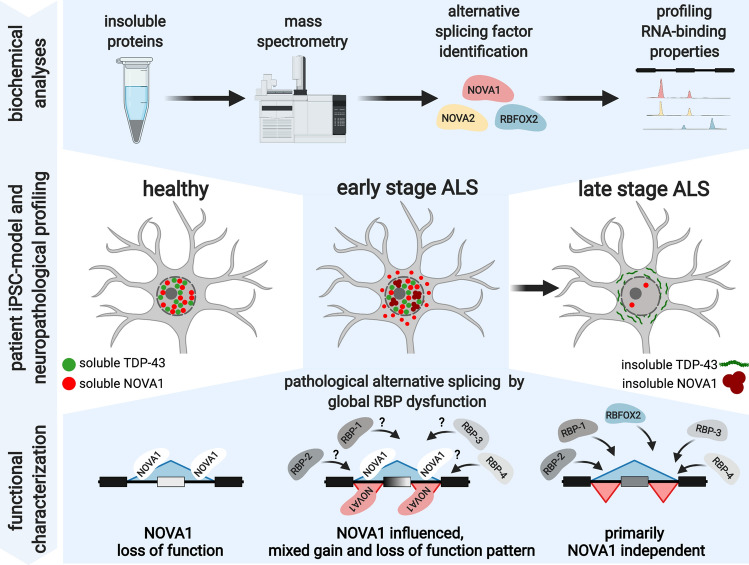
Amyotrophic lateral sclerosis (ALS) is a fatal disease characterized by aberrant alternative splicing (AS). Nuclear loss and cytoplasmic accumulation of the splicing factor TDP-43 in motor neurons (MN) are hallmarks of ALS at late stages of the disease. However, it is unknown if altered AS is present before TDP-43 pathology occurs. Here, we investigate altered AS and its origins in early stages of ALS using human induced pluripotent stem cell-derived motor neurons (MNs) from sporadic and familial ALS patients. We find high levels of the RNA-binding proteins NOVA1, NOVA2, and RBFOX2 in the insoluble protein fractions and observe that AS events in ALS-associated MNs are enriched for binding sites of these proteins. Our study points to an early disrupted function of NOVA1 that drives AS changes in a complex fashion, including events caused by a consistent loss of NOVA1 function. NOVA1 exhibits increased cytoplasmic protein levels in early stage MNs without TDP-43 pathology in ALS postmortem tissue. As nuclear TDP-43 protein level depletes, NOVA1 is reduced. Potential indications for a reduction of NOVA1 also came from mice over-expressing TDP-43 lacking its nuclear localization signal and iPSC-MN stressed with puromycin. This study highlights that additional RBP-RNA perturbations in ALS occur in parallel to TDP-43.


Figures

Fig. 1
Fig. 1
Protein fractionation of iPSC-derived motor neurons followed by mass spectrometry analysis identifies RBPs with increased insolubility in ALS. a Schematic illustrating the experimental and analysis workflow. b Scatter plot presenting log2(fold change) ALS/Ctrl (x axis) and significance (-log10(P value)) (y axis). Significant events are shown in red (horizontal dashed line: P value = 0.05; vertical dashed line: fold change = 1.5; n = 6 ALS, n = 6 Ctrl) c Bar graph showing number of proteins significantly enriched in ALS samples vs. Ctrl (red bar), or when iteratively shuffled (3 ALS samples and 3 Ctrls were compared to the respective remaining 3 ALS samples and 3 Ctrls, gray violin plot). Significance was determined by Mann-Whitney U test against a theoretical median of 88. d Pie chart highlighting protein classes of the 88 candidate peptides enriched in ALS insoluble fractions. RNA-binding proteins are highlighted in the red ellipse. e Western blots of candidate RBPs in soluble and insoluble fractions and corresponding Coomassie-stained gel (n = 6 ALS, n = 6 Ctrl). The SuperNOVA2 isoform is produced from an upstream alternative start codon [56]. f Densitometric quantification of Western blots normalized to the Coomassie controls (left graph for each protein) and ratio insoluble/soluble protein (right graph for each protein) for NOVA1, RBFOX2, RBFOX3, ELAVL4, FXR2, and NOVA2. Statistical significance was determined by 2-way ANOVA (left graph) and Mann-Whitney U test (right graph). P values for 2-way ANOVA were corrected using FDR. Data presented as mean ±SD (gray bars: Ctrl; red bars: ALS) and individual values (dots) (n = 6 ALS, n = 6 Ctrl). *P value < 0.05; **P value < 0.01; ***P value < 0.001; ****P value < 0.0001
Fig. 2
Fig. 2
Binding of NOVA1, NOVA2 and RBFOX2 is associated with AS events that are differentially regulated in ALS. a Schematic illustrating the experimental and analysis workflow n = 2 Ctrl per eCLIP). b Pie charts depicting distribution of gene regions bound by eCLIP-seq peaks in a dataset. The total number of significant peaks is shown below the individual pie charts. c Heatmaps illustrating the percentage of individual peaks (top) and target transcripts (bottom) shared between the indicated eCLIP-seq datasets. dg Scatter plot presenting k-mer enrichments as Z-scores of d TDP-43 (6-mers), e NOVA1 (4-mers), f NOVA2 (4-mers), and g RBFOX2 (6-mers) in the Ctrl-1-2 (x axis) and the CV-B (y axis) dataset, respectively. k-mers with highest enrichment are colored. hl Bar graphs illustrating enrichment significance (left graph, −log10(P value))) and fold-enrichment (right graph) of TDP-43 (green), NOVA1 (red), NOVA2 (orange) and RBFOX2 (blue) eCLIP-seq experiments in CV-B (dark shading) and Ctrl-1-2 (light shading) at AS events called in the h sALS vs. Ctrl dataset generated in this study, i fALS vs. Ctrl dataset generated in this study, j sALS vs. Ctrl dataset from AnswerALS, k C9-ALS vs. Ctrl dataset from AnswerALS, and l SPG11-HSP vs Ctrl generated in this study. Dashed vertical lines indicate significance thresholds (P value = 0.05 and fold enrichment=1). Hypergeometric test was used for calculation of significance. All detected events that passed the coverage threshold in the RNA-seq datasets were used as background
Fig. 3
Fig. 3
NOVA1 expression is increased in ALS iPSC-MN and elevated cytoplasmic TDP-43 levels are associated with a reduction of NOVA1 mRNA levels. ad Bar graphs of gene expression values for NOVA1 as reads per kilobase transcript per million mapped reads (RPKM) from a sALS and Ctrl generated in this study (n = 4 sALS, n = 4 Ctrl), b fALS and Ctrl generated in this study (n = 2 fALS, n = 3 Ctrl), c sALS and Ctrl from the AnswerALS consortium dataset (n = 9 sALS, n = 9 Ctrl), and d C9-ALS and Ctrl from the AnswerALS consortium dataset (n = 5 C9-ALS, n = 9 Ctrl). Data presented as mean ±SD. Statistical significance was determined by Mann-Whitney U test. a P value = 0.0286, b P value = 0.2000, c P value = 0.0315, d P value = 0.0599. e Western blot from total cell lysates of iPSC-MNs stained for NOVA1 and GAPDH. f Bar graph showing densitometric quantification of Western blot of NOVA1 normalized to GAPDH (n = 6 ALS; n = 6 Ctrl). Fold change ALS/Ctrl: 1.42. Data presented as mean ±SD. Statistical significance was determined by Mann-Whitney U test. P value = 0.0152. g Bar plot with NOVA1 expression values (in TPM) in iPSC-MN with control siRNA or siRNA targeting TARDBP (GEO ID: GSE121569; n = 6 control siRNA, n = 6 TARDBP siRNA). Data presented as median +IQR. Statistical significance was determined by Mann-Whitney U test. P value = 0.3095. h Bar plot with NOVA1 expression values (in TPM) in SH-SY5Y with control siRNA or siRNA targeting TARDBP (GEO ID: GSE122069; n = 3 control siRNA, n = 3 TARDBP siRNA). Data presented as median +IQR. Statistical significance was determined by Mann-Whitney U test. P value = 0.4000. i Bar plot with NOVA1 expression values (in RPKM) in mouse striatum with control ASO or ASO targeting TARDBP (GEO ID: GSE27394; n = 4 control ASO, n = 5 TARDBP ASO). Data presented as median +IQR. Statistical significance was determined by Mann-Whitney U test. P value = 0.9048. j Bar plot with NOVA1 expression values (in RPM) in mouse brain without and with TDP-43-dNLS expression (GEO ID: GSE65973; n = 4 Ctrl, n = 4 TDP-43-dNLS). Data presented as median +IQR. Statistical significance was determined by Mann-Whitney U test. P value = 0.0286. k Bar plot with NOVA1 expression values (in DESeq2 normalized counts) in iPSC-MN (4 Ctrl, 4 HNRNPA2B1 mutant lines) without and with puromycin stress (GEO ID: GSE157467; n = 8 untreated, n = 8 puromycin). Data presented as median +IQR. Statistical significance was determined by Mann-Whitney U test. P value = 0.0379
Fig. 4
Fig. 4
NOVA1 mediates AS in human iPSC motor neurons in a position-dependent manner. a Schematic illustrating the experimental workflow. b Western blot of NOVA1 from day 30 iPSC-MN after transduction with lentivirus containing EGFP (n = 3) or NOVA1 (n = 3) ORF expressed under the CAG promoter. GAPDH was used as a loading control. Average fold change of 1.97 (CV-B: 2.2-fold; Ctrl-1-1: 1.6-fold; Ctrl-2-1: 2.1-fold). c Western blot of NOVA1 from day 30 control (n = 5) and NOVA1 K.O. (n = 5) iPSC-MN. GAPDH was used as a loading control. d Venn diagram of significant differential cassette exon alternative splicing events from comparisons of NOVA1 vs. EGFP overexpression (blue) and of NOVA1 wt vs. NOVA1 K.O. (yellow). Significance of overlap was calculated with Fisher's exact test using all events detected in both analyses as background. OR = odds ratio. e, f Bar graphs of significance of differential enrichment of eCLIP-seq binding sites at AS events of TDP-43 (green), NOVA1 (red), NOVA2 (orange) and RBFOX2 (blue) in e NOVA1 vs EGFP overexpression, and f NOVA1 K.O. vs Ctrl. Experiments were performed in two cell lines (CV-B, dark shading; Ctrl-1-2, light shading). Dashed horizontal line at P value = 0.05. Enrichment was calculated using hypergeometric test with all detected events as the background. g Schematic illustrating analysis of positions of interest for NOVA1 binding analysis. h-i Bar graphs of significance of differential enrichment of NOVA1 eCLIP-seq binding sites at excluded (left) and included (right) AS events (upstream exons, upstream introns, alternative exons, downstream introns and downstream exons) in h NOVA1 vs EGFP overexpression, and i NOVA1 K.O. vs Ctrl. Experiments were performed in two cell lines (CV-B, dark shading; Ctrl-1-2, light shading). Dashed vertical line at P value =0.05. Enrichment was calculated using hypergeometric test with all detected events as the background. j Model illustrating physiological modes of action of NOVA1 in human iPSC-derived MN. AE alternative exon, UI upstream intron, DI downstream intron
Fig. 5
Fig. 5
Aberrant NOVA1 states in ALS exhibit gain- and loss-of-function features a Schematic illustrating analysis strategy to identify patterns of altered NOVA1 function in ALS iPSC-derived MNs. b Heatmap of all significant AS events observed in the four ALS datasets. Inclusion level difference for all depicted datasets were clustered using k-means clustering into 8 distinct clusters. Blue denotes inclusion (max: −0.6), red denotes exclusion (max: 0.6). Datasets are clustered using Euclidean distance metric. c Boxplot of inclusion level differences in clusters 0 (sALS vs. Ctrl: purple; fALS vs. Ctrl: pink; sALS vs. Ctrl (AA): orange; C9-ALS vs. Ctrl (AA): green; SPG11-HSP vs. Ctrl: cyan; NOVA1 vs. EGFP overexpression: blue; NOVA1 wt vs. NOVA1 K.O.: yellow). Ideogram on top illustrates the direction of the most prominent observed change in ALS, NOVA1 gain of function (GOF) and NOVA1 loss of function (LOF) (from top to bottom). d Bar blot illustrating significance (negative log10 scale) of CV-B NOVA1 eCLIP-seq binding site enrichment at AS events in the 8 detected AS event clusters at upstream exon, upstream intron, alternative exon, downstream intron, and downstream exon. Statistical significance was calculated with hypergeometric test against all detected AS events in the four ALS datasets as a background. Dashed line represented P value = 0.05. Arrow depicts most significant enrichment in cluster 0. e Bar blot of significance (negative log10 scale) of Ctrl-1-2 NOVA1 eCLIP-seq binding site enrichment at AS events in the 8 detected AS event clusters at upstream exon, upstream intron, alternative exon, downstream intron and downstream exon. Statistical significance was calculated with hypergeometric test against all detected AS events in the four ALS datasets as a background. Dashed line represents P value = 0.05. Arrow depicts most significant enrichment in cluster 0
Fig. 6
Fig. 6
NOVA1 expression in postmortem MN in lumbar spinal cord from ALS and Ctrl a Schematic illustrating the basic analysis strategy for NOVA1 expression in human tissue. We performed IF staining, spinning disc confocal microscopy and subsequent analysis of single MNs for NOVA1 mean fluorescent intensity and TDP-43 pathology in n = 7 Ctrl and n = 9 sALS. b Representative images of MN with nuclear TDP-43 (no TDP-43 pathology, purple arrow) and without nuclear TDP-43 (with TDP-43 pathology, red arrow) in sALS patients. Pictures stained for TDP-43 (green), NOVA1 (red), bIII-tubulin (gray) and DAPI (blue). Nuclear (cyan), cytoplasmic (fuchsia) and lipofuscin (yellow) areas analyzed are surrounded. Scale bars: 25µm. c Scatter plot of mean nuclear NOVA1 staining intensities in individual MNs from different ALS patients without (purple) and with (red) TDP-43 pathology. Horizontal black lines represent medians. Statistical analysis was performed using a mixed effects model. d Scatter plot of mean cytoplasmic NOVA1 intensity in individual MNs from different ALS patients without (purple) and with (red) TDP-43 pathology. Horizontal black lines represent medians. Statistical analysis was performed using a mixed effects model. e Representative immunofluorescence images of MNs in lumbar spinal cord from control individuals (black) and from sALS patients without (purple) and with TDP-43 pathology (red). Sections were stained for TDP-43 (green), NOVA1 (red), bIII-tubulin (gray) and DAPI (blue). Nuclear (cyan) and cytoplasmic (fuchsia) areas analyzed are surrounded. Blue arrowheads indicate cytoplasmic NOVA1 accumulations. Scale bar: 25µm. f Scatter plot of bIII-tubulin normalized mean nuclear NOVA1 staining intensities of single MNs (dots) their average in an individual (line). Dashed line represents median in Ctrl. Statistical significance was determined by nested one-way ANOVA. *P value < 0.05; **P value < 0.01; ***P value < 0.001; ****P value < 0.0001. Significant variation between individuals within a group: P value = 0.0001. g Scatter plot of bIII-tubulin normalized mean cytoplasmic NOVA1 intensities of single MN (dots) their average in an individual (line). Dashed line represents median in Ctrl. Statistical significance was determined by nested one-way ANOVA. *P value < 0.05; **P value < 0.01; ***P value < 0.001; ****P value < 0.0001. Significant variation between individuals within a group: P value > 0.05. h Scatter plot illustrating NOVA1 expression converted into expression Z-scores based on control means from postmortem ALS LCM datasets from [32] and [55] in Ctrl (black), sALS samples with regular STMN2 levels (STMN2 expression Z-score > −2, purple) and sALS samples with reduced STMN2 levels (STMN2 expression Z-score < −2, red). Black horizontal lines indicate median and interquartile ranges. Statistical significance was determined by Kruskal-Wallis test and Dunn's post hoc test to identify changes between individual groups. *P value < 0.05; **P value < 0.01; ***P value < 0.001; ****P value < 0.0001 i Scatter plot illustrating NOVA1 expression converted into expression Z-scores based on Ctrl means from postmortem ALS motor cortex datasets from UCSD and NYGC cohorts [63] in Ctrl samples (black), sALS samples with regular STMN2 levels (STMN2 expression Z-score > −2, purple), and sALS samples with reduced STMN2 levels (STMN2 expression Z-score < −2, red). Black horizontal lines illustrate median and interquartile ranges. Statistical significance was determined by Kruskal-Wallis test and Dunn's post hoc test to identify changes between individual groups. *P value < 0.05; **P value < 0.01; ***P value < 0.001; ****P value < 0.0001
Fig. 7
Fig. 7
Paradigm of proposed NOVA1 pathological changes and functional aberrations during early and late stages of ALS disease course as determined by TDP-43 pathology. Altered cellular and functional properties of NOVA1 are specifically present at early stages of ALS

References

    1. Akiyama T, Suzuki N, Ishikawa M, Fujimori K, Sone T, Kawada J, et al. Aberrant axon branching via Fos-B dysregulation in FUS-ALS motor neurons. EBioMedicine. 2019;45:362–378. doi: 10.1016/j.ebiom.2019.06.013. - DOI - PMC - PubMed
    1. Alami NH, Smith RB, Carrasco MA, Williams LA, Winborn CS, Han SSW, et al. Axonal transport of TDP-43 mRNA granules is impaired by ALS-causing mutations. Neuron. 2014;81:536–543. doi: 10.1016/j.neuron.2013.12.018. - DOI - PMC - PubMed
    1. Amlie-Wolf A, Ryvkin P, Tong R, Dragomir I, Suh E, Xu Y, et al. Transcriptomic changes due to cytoplasmic TDP-43 expression reveal dysregulation of histone transcripts and nuclear chromatin. PLoS One. 2015;10:e0141836. doi: 10.1371/journal.pone.0141836. - DOI - PMC - PubMed
    1. Arai T, Hasegawa M, Akiyama H, Ikeda K, Nonaka T, Mori H, et al. TDP-43 is a component of ubiquitin-positive tau-negative inclusions in frontotemporal lobar degeneration and amyotrophic lateral sclerosis. Biochem Biophys Res Commun. 2006;351:602–611. doi: 10.1016/j.bbrc.2006.10.093. - DOI - PubMed
    1. Baron DM, Fenton AR, Saez-Atienzar S, Giampetruzzi A, Sreeram A, Shankaracharya KPJ, et al. ALS-associated KIF5A mutations abolish autoinhibition resulting in a toxic gain of function. Cell Rep. 2022;39:110598. doi: 10.1016/j.celrep.2022.110598. - DOI - PMC - PubMed

MeSH terms