. 2022 Jul 1;12(1):11200.
doi: 10.1038/s41598-022-15234-2.

Differential epithelial and stromal LGR5 expression in ovarian carcinogenesis

Affiliations

Differential epithelial and stromal LGR5 expression in ovarian carcinogenesis

Hyesung Kim et al. Sci Rep. .

Abstract

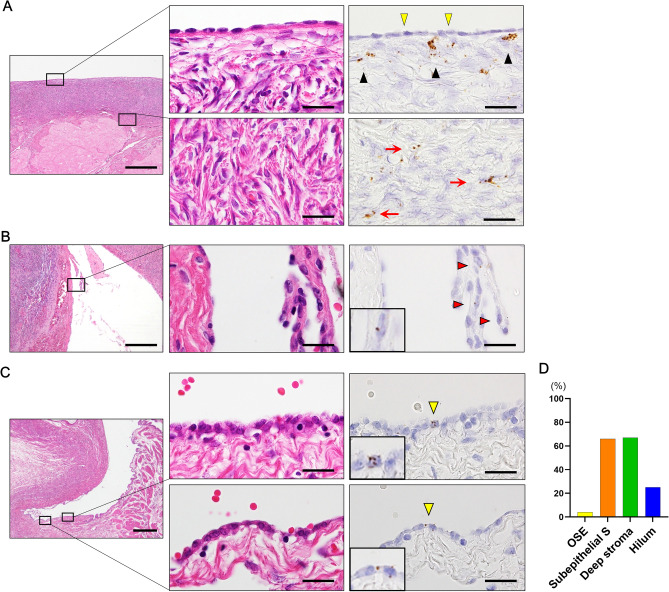
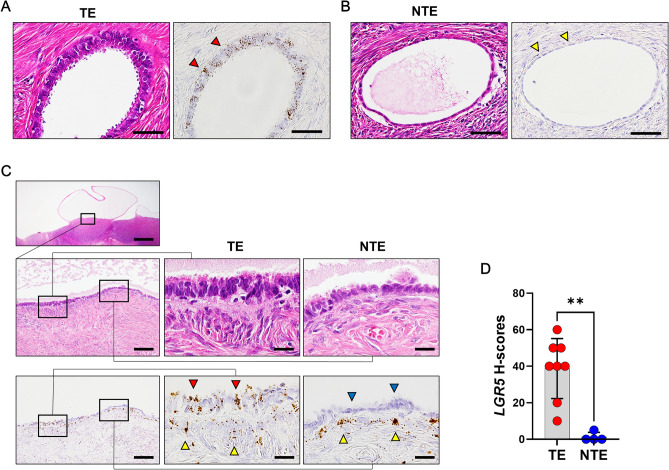
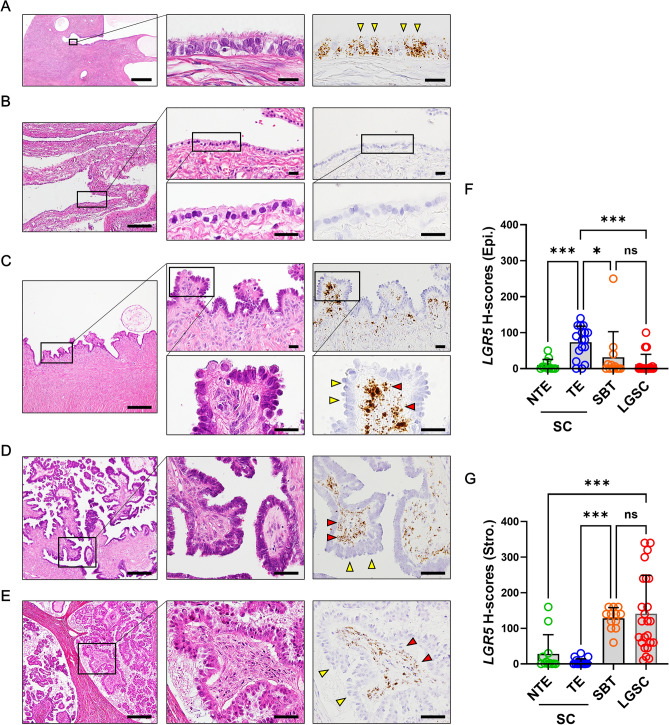
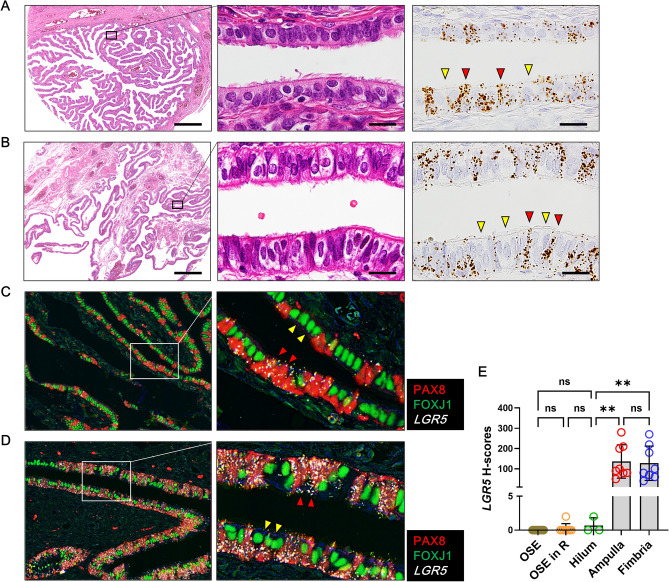
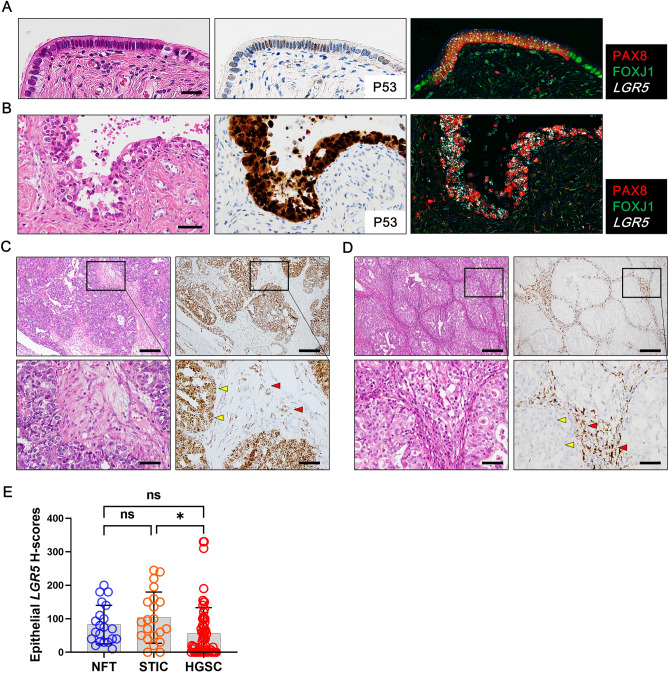
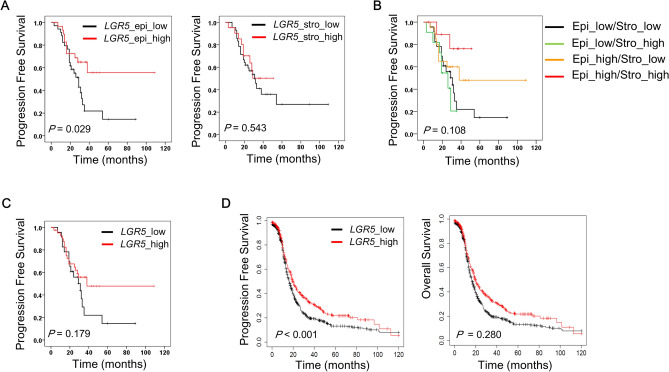
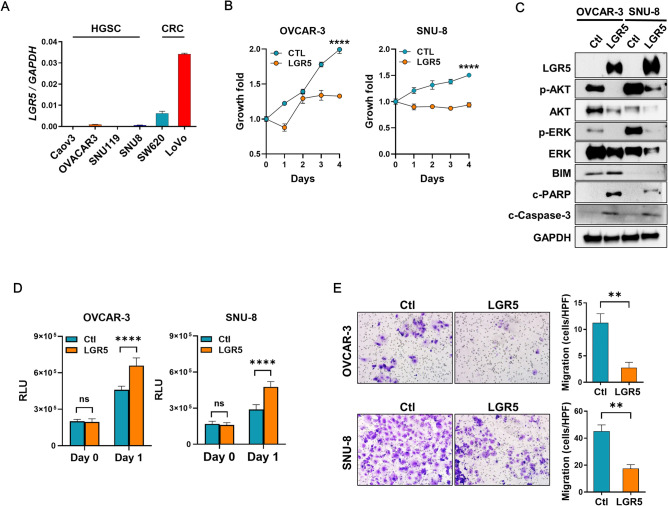
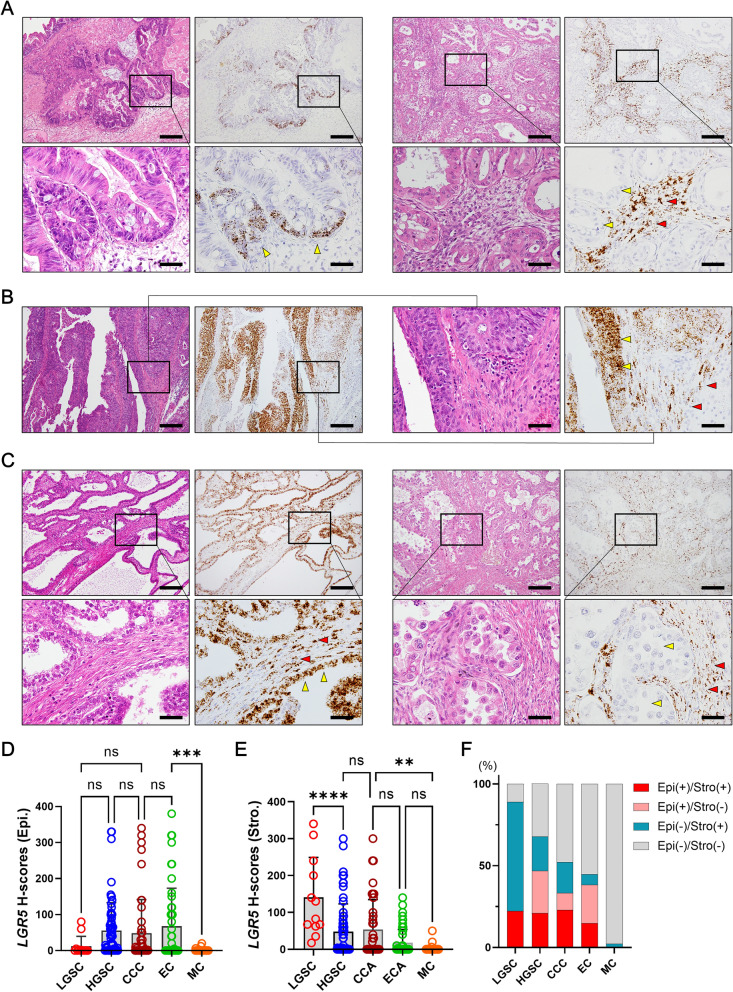
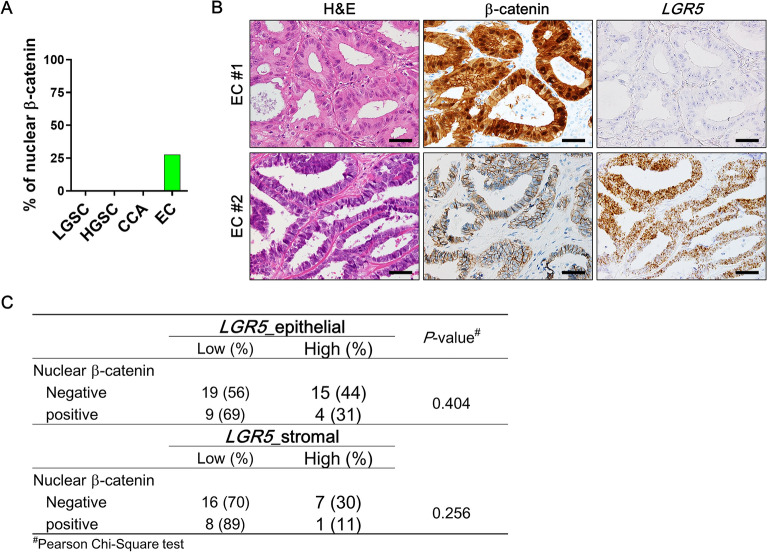
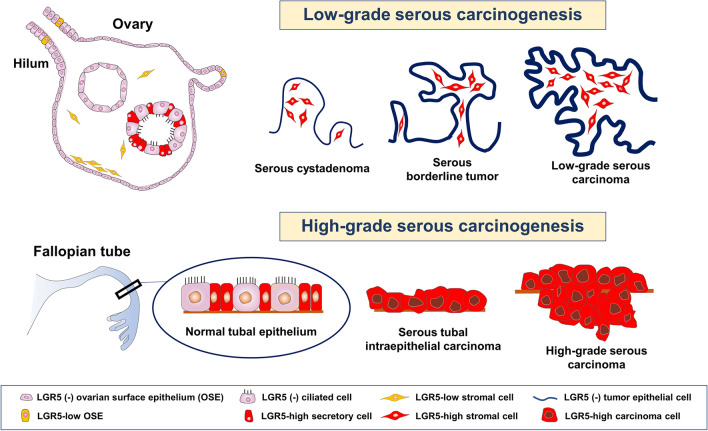
Lgr5 has been identified as a marker of the stem/progenitor cells in the murine ovary and oviduct by lineage tracing. However, little is known regarding LGR5 expression or its functional significance in human ovary tissues. Here, using RNA in situ hybridization and/or immunohistochemistry, we thoroughly investigated LGR5 expression in normal human ovaries, fallopian tubes and various ovarian tumors. We discovered that LGR5 expression is negligible in the human ovary surface epithelium, whereas ovarian stromal cells normally express low levels of LGR5. Remarkably, fallopian tube epithelium, inclusion cysts and serous cystadenomas with a Müllerian phenotype expressed high levels of LGR5, and LGR5 expression was restricted to PAX8+/FOXJ1- secretory cells of the tubal epithelium. Strong stromal LGR5 expression without epithelial LGR5 expression was consistently observed in the path from serous cystadenoma to serous borderline tumor to low grade serous carcinoma (LGSC). Unlike LGSC, high grade serous carcinoma (HGSC), clear cell carcinoma, endometrioid carcinomas displayed various epithelial-stromal LGR5 expression. Notably, high levels of LGR5 expression were observed in serous tubal intraepithelial carcinoma, which slightly declined in invasive HGSC. LGR5 expression was significantly associated with improved progression-free survival in HGSC patients. Moreover, in vitro assays demonstrated that LGR5 expression suppressed tumor proliferation and migratory capabilities. Taken together, these findings indicate a tumor-suppressive role for LGR5 in the progression of HGSC.


Conflict of interest statement

The authors declare no competing interests.

Figures

Figure 1
Figure 1
LGR5 expression in normal ovary surface epithelium and stromal cells. (A) LGR5 expression is not observed in the ovary surface epithelium (OSE) (indicated by yellow arrowheads), while subepithelial stromal cells often exhibit LGR5 expression (indicated by black arrowheads). Sparse LGR5-positive stromal cells are observed in the deep ovarian stroma (indicated by red arrows). Scale bar, 0.5 mm (left panel) and 20 µm (middle and right panels). (B) Only one ovary displayed LGR5-positive surface epithelial cells, which appeared among proliferating epithelial cells near the hemorrhagic area (indicated by red arrowheads, magnified image shown in the inset). Scale bar, 0.5 mm (left panel) and 20 µm (middle and right panels). (C) LGR5-positive cells are rarely observed in the ovarian hilum (indicated by yellow arrowheads, magnified image shown in the insets). Scale bar, 0.5 mm (left panel) and 20 µm (middle and right panels). (D) A bar graph showing the percentage of cases in which LGR5 expression was observed in each area of the ovary (OSE, n = 23, subepithelial S, n = 23, deep stroma, n = 29, hilum, n = 4). Subepithelial S Subepithelial stroma.
Figure 2
Figure 2
LGR5 expression in the inclusion cysts. (A) The tubal type epithelium (TE) of an inclusion cyst showing a significant level of LGR5 expression (indicated by red arrowheads). Scale bar, 50 µm. (B) Inclusion cysts that have nontubal type epithelium (NTE) express no or negligible levels of LGR5 (indicated by yellow arrowheads). Scale bar, 50 µm. (C) An inclusion cyst that contains both TE and NTE. LGR5 expression is observed in the TE (indicated by red arrow heads) along with strong LGR5 expression in subepithelial stromal cells (indicated by yellow arrowheads), whereas NTE does not express LGR5 (indicated by blue arrowheads). Scale bar, 0.5 mm (left upper panel), 0.2 mm (left middle and lower panels) and 20 µm (middle and right panels). (D) A bar graph showing histo-scores (H-scores) of LGR5 in the inclusion cysts with TE (n = 8) or NTE (n = 4). **P < 0.01 by unpaired t test.
Figure 3
Figure 3
LGR5 expression in serous cystadenoma (SC), serous borderline tumor (SBT), and low-grade serous carcinoma (LGSC). SCs are lined by a single layer of columnar, ciliated cells resembling normal tubal type epithelium (TE) or flat, cuboidal nontubal type epithelium (NTE). (A) High levels of LGR5 expression are detected in most cases of TE in SCs. Scale bar, 0.5 mm (left panel) and 20 µm (middle and right panels). (B) NTE in SCs mostly exhibits little or no LGR5 expression. Scale bar, 0.2 mm (left panel) and 20 µm (middle and right panels). (C) In an SC with focal papillary tufting, subepithelial stromal cells express high levels of LGR5, whereas nontubal epithelial cells exhibit no LGR5 expression. Scale bar, 0.2 mm (left panel) and 20 µm (middle and right panels). Strong stromal LGR5 expression was observed in most SBTs (D) and LGSCs (E). Scale bar, 0.2 mm (left panel) and 50 µm (middle and right panels). Bar graphs showing the histo-scores (H-scores) of LGR5 in epithelial tumor cells (F) and stromal cells (G) in SC (n = 16, spots = 29), SBT (n = 7, spots = 14), and LGSC (n = 9, spots = 18). Yellow arrowheads indicate epithelial tumor cells, and red arrowheads indicate stromal cells. The data are shown as means ± SD. ns not significant. **P < 0.01, ****P < 0.0001 by Tukey’s multiple comparisons test.
Figure 4
Figure 4
High levels of LGR5 expression in the fallopian tubes. (A) Ampulla of the fallopian tube harbors two types of epithelial cells: ciliated cells (indicated by yellow arrowheads) and secretory cells (indicated by red arrowheads). Strong LGR5 expression seems to be confined to secretory cells. Scale bar, 0.5 mm (left panel) and 50 µm (middle and right panels). (B) The epithelium in the fimbria exhibits the same LGR5 expression pattern as in the ampulla. Scale bar, 0.5 mm (left panel) and 50 µm (middle and right panels). Combined in situ hybridization for LGR5 (white dots) and multiplex immunohistochemistry for PAX8 (red nuclear stain) and FOXJ1 (green nuclear stain) was performed on a ciliated cell-rich area (C) and on a secretory cell-rich area (D). PAX8-positive secretory cells display strong LGR5 expression (indicated by red arrowheads), while FOXJ1-positive ciliated cells do not express LGR5 (indicated by yellow arrowheads). (E) A bar graph showing that histo-scores (H-scores) of LGR5 are much higher in fallopian tubes than in ovaries. OSE in R, ovary surface epithelium in regeneration. The data are shown as the means ± SD. ns not significant. **P < 0.01 by Tukey’s multiple comparisons test.
Figure 5
Figure 5
LGR5 expression in secretory cell outgrowth (SCOUT), serous tubal intraepithelial carcinoma (STIC) and high-grade serous carcinoma (HGSC). Combined in situ hybridization for LGR5 and immunohistochemistry for PAX8 and FOXJ1 shows increased LGR5 expression in the SCOUT (A) and STIC (B) lesions in which PAX8-positive cells proliferate. (C) Representative images of LGR5 expression in HGSC. LGR5 expression is frequently observed not only in carcinoma cells but also in adjacent stromal cells. Scale bar, 0.5 mm (upper panels) and 50 µm (lower panels). (D) In some cases, LGR5 expression is only detected in stromal cells. Scale bar, 0.5 mm (upper panels) and 50 µm (lower panels). (E) A bar graph showing the histo-scores (H-scores) of LGR5 in in the nontumor fallopian tubes (NFTs) adjacent to STIC lesions (n = 21), STIC lesions (n = 21), and HGSC lesions (n = 64). The data are shown as the means ± SD. ns, not significant. *P < 0.05 by Tukey’s multiple comparisons test.
Figure 6
Figure 6
Prognostic value of LGR5 expression in ovarian serous carcinoma patients. LGR5 expression was classified into low and high according to the histo-scores of LGR5 (cutoff value: 40) in carcinoma cells or stromal cells in HGSC. (n = 64) (A) High LGR5 expression in carcinoma cells is significantly associated with better progression free survival (PFS) in HGSC patients, whereas stromal LGR5 expression is not associated with PFS. (B) Progression free survival with respect to epithelial and stromal LGR5 expression. (C) Progression free survival in global LGR5-low and-high groups. (D) An independent survival analysis was performed using Kaplan–Meier plotter, an online database, on ovarian serous carcinoma patients (Affy ID: 213880_at, follow up: 120 months, n = 1104). The optimal cutoff value for low- and high-LGR5 expression was automatically selected. LGR5-high serous carcinomas had better PFS rates (P < 0.001, hazard ratio: 0.76). However, LGR5 expression had no impact on OS.
Figure 7
Figure 7
The suppressive effects of LGR5 on high-grade serous carcinoma (HGSC) cell growth and migration. (A) Real-time PCR was performed to measure the mRNA levels of LGR5 in four human HGSC cell lines compared to colorectal cancer (CRC) cell lines, SW620 and LoVo. (B) OVAR-3 and SNU-8 cells were transfected with a control or a LGR5-expressing plasmid. Cell growth was measured using a Cell Counting Kit-8 at the indicated times. (C) Twenty-four h after transfection with a control or a LGR5-expressing plasmid in OVCAR-3 and SNU-8 cells, an immunoblot assay for survival and apoptosis-related proteins was performed using the antibodies indicated in the figure. (D) Caspase-3 activity was measured after transfecting cells with a control or a LGR5-expressing plasmid. (E) The effect of LGR5 expression on the migration activity of OVCAR-3 and SNU-8 cells was evaluated using a transwell migration assay. Cellular migration was imaged at 0 and 48 h. c-PARP cleaved PARP; c-caspase-3 cleaved caspase-3; Ctl control; RLU relative light unit. Data are presented as the mean ± SD. **P < 0.01, ****P < 0.0001 by unpaired t test.
Figure 8
Figure 8
LGR5 expression in various histological subtypes of ovarian carcinomas. Representative images of LGR5 expression in mucinous carcinoma (MC, n = 44) (A), endometrioid carcinoma (EC, n = 47) (B), and clear cell carcinomas (CCC, n = 48) (C). Scatter plots showing histo-scores (H-scores) of epithelial (D) or stromal (E) LGR5 expression in each subtype of ovarian carcinoma. (F) A bar graph showing the proportions of epithelial and stromal LGR5 positivity in each subtype of ovarian carcinomas with an H-score cutoff value of 40. Low-grade serous carcinoma (LGSC, n = 12), High-grade serous carcinoma (HGSC, n = 64). Scale bar, 0.2 mm (left two panels) and 50 µm (right two panels) (A,C); 0.2 mm (upper panels) and 50 µm (lower panels) (B). ns not significant. **P < 0.01, ***P < 0.001, ****P < 0.0001 by Tukey’s multiple comparisons test.
Figure 9
Figure 9
Association of LGR5 with β-catenin expression in endometrioid carcinomas (ECs). (A) A bar graph showing percentages of nuclear β-catenin expression in various ovarian carcinomas. (B) Representative images of a EC expressing nuclear β-catenin and no LGR5 (EC #1), and a EC expressing normal membranous β-catenin and strong LGR5 (EC #2). Scale bar, 50 µm (C) A table showing the correlations of epithelial or stromal LGR5 with nuclear β-catenin expression in ECs. LGSC, low-grade serous carcinoma (n = 12); HGSC, high-grade serous carcinoma (n = 64); CCA, clear cell carcinoma (n = 48).
Figure 10
Figure 10
Schematic representation of distribution of LGR5 expression in ovary, fallopian tube, and ovarian serous carcinogenesis.

References

    1. Prat J. New insights into ovarian cancer pathology. Ann. Oncol. 2012;23:x111–x117. doi: 10.1093/annonc/mds300. - DOI - PubMed
    1. Dinkelspiel HE, et al. Long-term mortality among women with epithelial ovarian cancer. Gynecol. Oncol. 2015;138:421–428. doi: 10.1016/j.ygyno.2015.06.005. - DOI - PMC - PubMed
    1. Lheureux S, Gourley C, Vergote I, Oza AM. Epithelial ovarian cancer. The Lancet. 2019;393:1240–1253. doi: 10.1016/S0140-6736(18)32552-2. - DOI - PubMed
    1. Reid BM, Permuth JB, Sellers TA. Epidemiology of ovarian cancer: A review. Cancer Biol. Med. 2017;14:9. doi: 10.20892/j.issn.2095-3941.2016.0084. - DOI - PMC - PubMed
    1. Sung, H. et al. Global cancer statistics 2020: GLOBOCAN estimates of incidence and mortality worldwide for 36 cancers in 185 countries. CA 71, 209–249 (2021). - PubMed

Publication types