. 2022 Jul 1;23(1):261.
doi: 10.1186/s12859-022-04800-0.

Practical application of a Bayesian network approach to poultry epigenetics and stress

Affiliations

Practical application of a Bayesian network approach to poultry epigenetics and stress

Emiliano A Videla Rodriguez et al. BMC Bioinformatics. .

Abstract

Background: Relationships among genetic or epigenetic features can be explored by learning probabilistic networks and unravelling the dependencies among a set of given genetic/epigenetic features. Bayesian networks (BNs) consist of nodes that represent the variables and arcs that represent the probabilistic relationships between the variables. However, practical guidance on how to make choices among the wide array of possibilities in Bayesian network analysis is limited. Our study aimed to apply a BN approach, while clearly laying out our analysis choices as an example for future researchers, in order to provide further insights into the relationships among epigenetic features and a stressful condition in chickens (Gallus gallus).

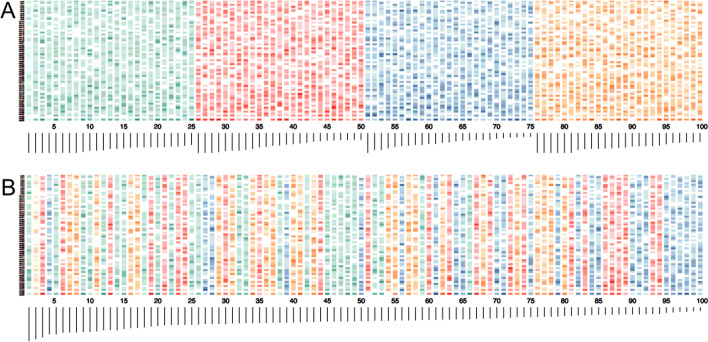
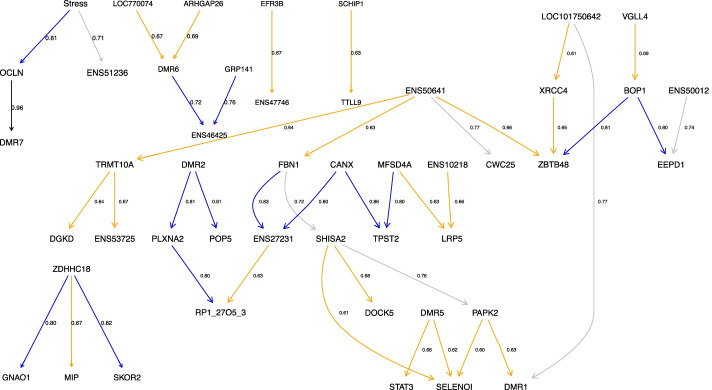
Results: Chickens raised under control conditions (n = 22) and chickens exposed to a social isolation protocol (n = 24) were used to identify differentially methylated regions (DMRs). A total of 60 DMRs were selected by a threshold, after bioinformatic pre-processing and analysis. The treatment was included as a binary variable (control = 0; stress = 1). Thereafter, a BN approach was applied: initially, a pre-filtering test was used for identifying pairs of features that must not be included in the process of learning the structure of the network; then, the average probability values for each arc of being part of the network were calculated; and finally, the arcs that were part of the consensus network were selected. The structure of the BN consisted of 47 out of 61 features (60 DMRs and the stressful condition), displaying 43 functional relationships. The stress condition was connected to two DMRs, one of them playing a role in tight and adhesive intracellular junctions in organs such as ovary, intestine, and brain.

Conclusions: We clearly explain our steps in making each analysis choice, from discrete BN models to final generation of a consensus network from multiple model averaging searches. The epigenetic BN unravelled functional relationships among the DMRs, as well as epigenetic features in close association with the stressful condition the chickens were exposed to. The DMRs interacting with the stress condition could be further explored in future studies as possible biomarkers of stress in poultry species.

Keywords: Bayesian networks; Differential methylation; Epigenetics; Poultry; Stress.


Conflict of interest statement

The authors declare that they have no competing interests.

Figures

Fig. 1
Fig. 1
Steps taken and decisions made to build a consensus Bayesian network. The starting point was methylation data from 46 chickens under two treatment conditions (22 control, 24 stress). Bioinformatic analyses were performed as described in [54, 57]. Thereafter, a set of 60 differentially methylated regions (DMRs) were selected. The corresponding methylation values of each DMR were counts (ranging 0–39). Considering that the most frequent value was 0, binary discretization was implemented, leading us to explore discrete Bayesian network (BN) algorithms: we used the bnlearn package in R, exploring the search space with a score-and-search algorithm and the BDe score. Considering that the data had imbalances between binary states that could lead to the discovery of artefactual arcs, a contingency test (chi-square) was applied to all possible pairs of variables to create a list of arcs to avoid. Test searches and the software BayesPiles showed that the search space was complex and building the consensus Bayesian network required a strategic and iterative approach: the combination of a phylogenetic model averaging, plus further selection of arcs common to all searches into a consensus weighted Bayesian network
Fig. 2
Fig. 2
Distribution of four of the differentially methylated regions (DMRs) once a binary discretization method was applied. The state 0 represents values with absence of methylation, the state 1 represents values with presence of methylation. These four DMRs (AD) are representative of imbalances between the two states, as zero was the most popular state among different DMRs
Fig. 3
Fig. 3
BayesPiles investigation of search space. Top networks found from four separate collections of searches, representing peaks of many different hills in the search space. BayesPiles visualises a summary of network structure as a shaded stack representing out-degree of each node (darker = higher) above a bar representing network score (longer = higher), with networks along the x-axis and nodes along the y-axis. A shows the highest 25 networks for four collections of searches (different colours), with highest network to the left. The strong variation in network structure (different patterns in the shaded bars) indicates that these networks are tops of different peaks in the search space, not the final climb of a single hill. B shows the final 25 networks from all four searches combined, sorted by their score. The mixing of colours throughout shows the high variation in search peaks: each collection of searches explored different areas of the search space, finding different high-scoring structures
Fig. 4
Fig. 4
Consensus network of DMRs. Networks were built with common arcs to 50 searches, each one of these searches consisted of a starting point of 100 random graphs. Features representing the differentially methylated regions (named by related gene or region, see “Methods” Section) and the stress conditions are nodes; lines between nodes represent the identified relationships. Arc labels represent the average probability of belonging to the consensus network, the higher the values, the higher the probability. Different colours represent different ranges of probabilities: black: 0.90–1.00, blue: 0.80–0.89; grey: 0.70–0.79; orange: 0.60–0.69

References

    1. Tarca AL, Carey VJ, Chen XW, Romero R, Drǎghici S. Machine learning and its applications to biology. PLoS Comput Biol. 2007;3:e116. doi: 10.1371/journal.pcbi.0030116. - DOI - PMC - PubMed
    1. Guzmán DA, Flesia AG, Aon MA, Pellegrini S, Marin RH, Kembro JM. The fractal organization of ultradian rhythms in avian behavior. Sci Rep. 2017;7:684. doi: 10.1038/s41598-017-00743-2. - DOI - PMC - PubMed
    1. Milns I, Beale CM, Smith VA. Revealing ecological networks using Bayesian network inference algorithms. Ecology. 2010;91:1892–1899. doi: 10.1890/09-0731.1. - DOI - PubMed
    1. Comin A, Jeremiasson A, Kratzer G, Keeling L. Revealing the structure of the associations between housing system, facilities, management and welfare of commercial laying hens using additive Bayesian networks. Prev Vet Med. 2019;164:23–32. doi: 10.1016/j.prevetmed.2019.01.004. - DOI - PubMed
    1. Mitchell EG, Wallace MI, Smith VA, Wiesenthal AA, Brierley AS. Bayesian network analysis reveals resilience of the jellyfish Aurelia aurita to an Irish sea regime shift. Sci Rep. 2021;11:3707. doi: 10.1038/s41598-021-82825-w. - DOI - PMC - PubMed