. 2022 Jul 1;20(1):101.
doi: 10.1186/s12964-022-00910-7.

Subsequent malaria enhances virus-specific T cell immunity in SIV-infected Chinese rhesus macaques

Affiliations

Subsequent malaria enhances virus-specific T cell immunity in SIV-infected Chinese rhesus macaques

Guangjie Liu et al. Cell Commun Signal. .

Abstract

Background: Coinfection with HIV and Plasmodium parasites is fairly common, but the sequence of infection with these two pathogens and their impact on disease progression are poorly understood.

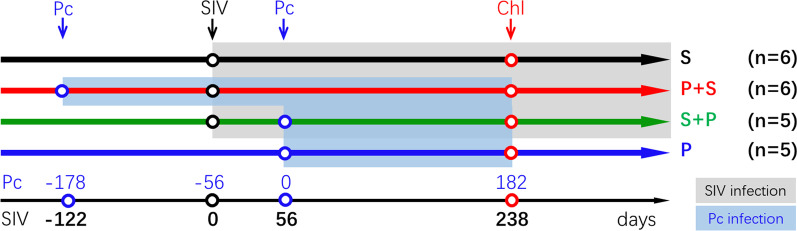
Methods: A Chinese rhesus macaque HIV and Plasmodium coinfection model was established to compare the impact of pre-existing and subsequent malaria on the progression of SIV infection.

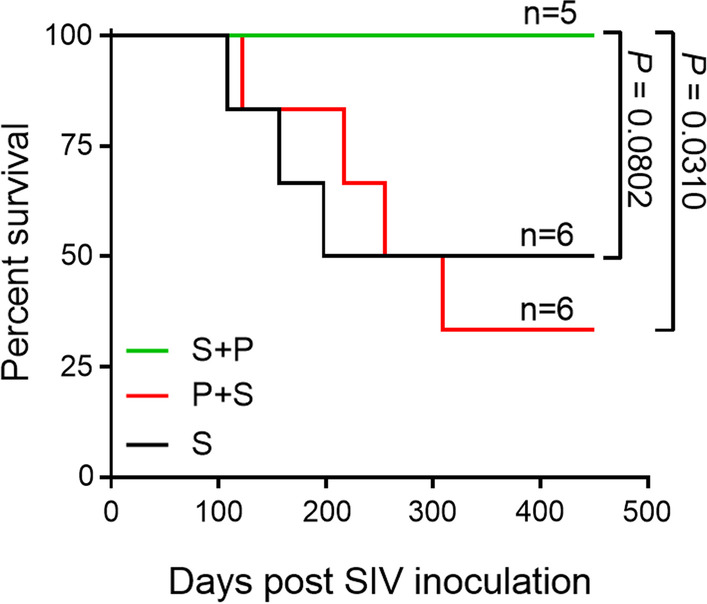
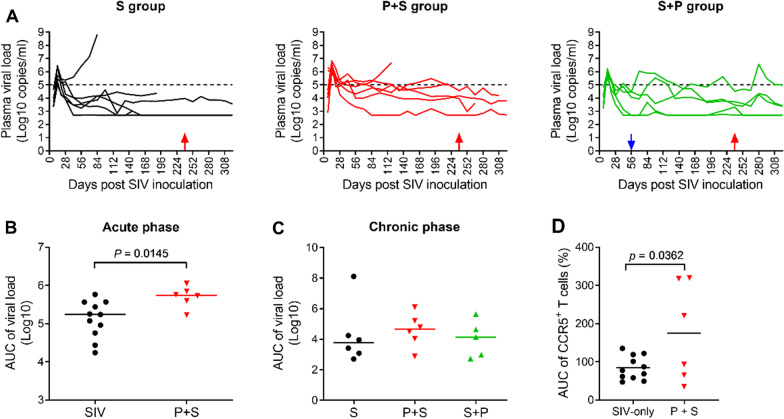
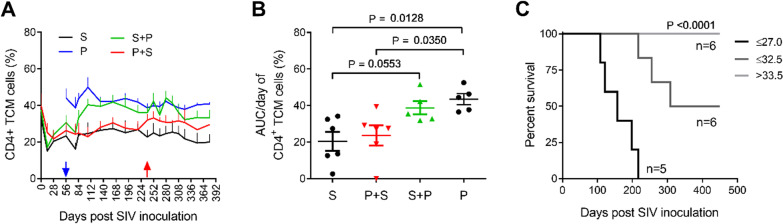
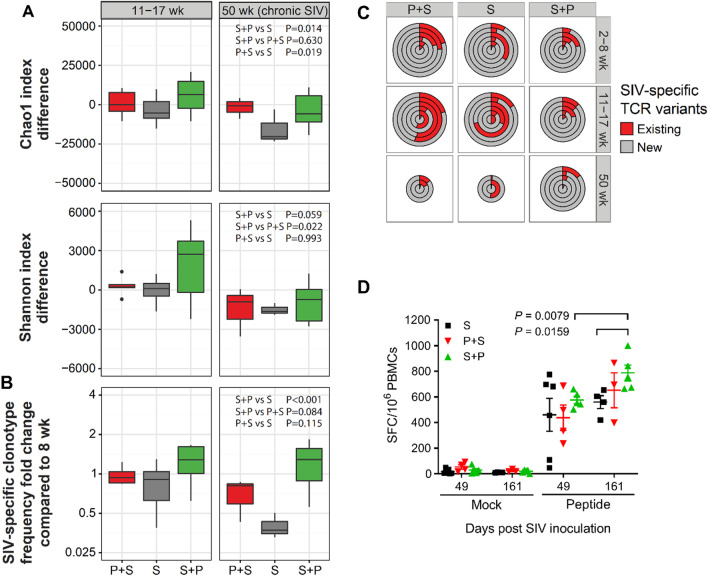
Results: We found that a pre-existing malaria caused animals to produce a greater number of CD4+CCR5+ T cells for SIV replication, resulting in higher viral loads. Conversely, subsequent malaria induced a substantially larger proportion of CD4+CD28highCD95high central memory T cells and a stronger SIV-specific T cell response, maintained the repertoire diversity of SIV-specific T cell receptors, and generated new SIV-specific T cell clonotypes to trace SIV antigenic variation, resulting in improved survival of SIV-infected animals.

Conclusion: The complex outcomes of this study may have important implications for research on human HIV and malaria coinfection. The infection order of the two pathogens (HIV and malaria parasites) should be emphasized. Video abstract.

Keywords: Coinfection; Monkey model; Plasmodium; SIV; Virus-specific immunity.


Conflict of interest statement

There are no competing interests with this article.

Figures

Fig. 1
Fig. 1
Schematic of the experimental infection of Chinese rhesus macaques with blood-stage Plasmodium cynomolgi and Simian immunodeficiency virus (SIVmac251). P. cynomolgi (Pc) and SIVmac251 (SIV) infections are indicated by blue and black circles, respectively. Pc-infected animals were treated with chloroquine phosphate (Chl, red circles) for three days at the indicated times. The gray area indicates the SIV phase, and the light blue area indicates the Pc malaria phase
Fig. 2
Fig. 2
Survival rates of monkeys from the S, S + P and P + S groups. The median survival times of the S and P + S groups were 324 days and 282 days, respectively. Statistical significance of the difference in survival between groups was determined by the log-rank (Mantel-Cox) test
Fig. 3
Fig. 3
Plasma viral loads in SIV-infected animals. A Plasma viral loads of individual monkeys in the three SIV-infected groups. Blue and red arrows indicate the times of Pc inoculation and chloroquine treatment, respectively. B Area under the curve unit (AUC/day) of plasma viral loads in SIV infected monkeys: S group plus S + P group versus P + S group (before Plasmodium infection) during the acute phase (days 0–56). C AUC/day of plasma viral loads during the chronic phase of SIV infection (all surviving animals from days 70–322). The differences between groups were not significant. D AUC of percentage of peripheral CCR5+CD4+ T cells from SIV-infected macaques: S group plus S + P group (before Plasmodium infection) versus P + S group during the days 0–7. Note: During the acute phase of SIV infection, the monkeys either in S group or in S + P group had no Plasmodium infection, therefore they were pooled together as SIV-only group (Fig. 3B, D); but during chronic phase of SIV infection, the monkeys in S group had no malaria, and the monkeys in S + P group had malaria, therefore they could not be pooled together (Fig. 3C). Acute phase: Day 0–56; Chronic phase: After Day 56
Fig. 4
Fig. 4
Correlation between the frequency of TCM and survival. A Frequency of CD4+CD28highCD95high TCM during the course of SIV, Pc infection or coinfection. The data were from all the animals that survived at the assay time point. B AUC/day of TCM frequency during the chronic phase of Pc infection (days 84–238). One-way ANOVA multiple comparisons, P = 0.0059. C The relationship between TCM frequency and prognosis. Kaplan–Meier curves for peripheral blood TCM frequency (AUC/day) during the chronic phase of Pc infection (days 84–238) and survival of SIV-infected animals. The animals were divided into three groups according to percentiles of AUC/day of TCM frequency in CD4+ T cells. Log-rank (Mantel-Cox) test, P < 0.0001. The data represent all seventeen SIV-infected monkeys in the S, S + P, and P + S groups
Fig. 5
Fig. 5
T-cell repertoire diversity and SIV-specific immune response in malaria- and SIV-infected monkeys. A Diversity index differences with respect to the 8th week of SIV infection (corresponding to malaria introduction in the S + P group). Repertoire diversity was restored in the S + P group but not in the P + S group. A significant difference between the S + P and P + S groups was observed for the Shannon diversity index. P-values computed using ANOVA. B Ratio of SIV-specific clonotype frequency with respect to the control point (8th week of SIV infection, corresponding to malaria introduction in the S + P group). The S + P group, but not the P + S group, was characterized by a persistently higher SIV-specific clonotype frequency. P-values were calculated using ANOVA. C New SIV-specific clonotype production. Fractions of existing (detected at previous sampling point) and new SIV-specific clonotypes shown for each monkey in the P + S, S and S + P groups. A significant increase in new SIV-specific clonotype production was observed in the S + P group during the whole period of Plasmodium infection (at 11–17 weeks and 50 weeks post SIV infection). D Frequency of IFN-g-producing SIV Gag-specific PBMCs. Number of IFN-γ-producing PBMCs against pooled SIV Gag peptides analyzed by ELISPOT. The sample sizes were 6, 4 and 5 on day 49 and 4, 3, and 5 on day 161 of the S, P + S and S + P groups, respectively. SFC: spot-forming cells

Similar articles

Cited by

References

    1. WHO: HIV/AIDS key facts. 2020; Available from: https://www.who.int/news-room/fact-sheets/detail/hiv-aids.
    1. WHO: Malaria key facts. 2020; Available from: https://www.who.int/news-room/fact-sheets/detail/malaria.
    1. Tay SC, et al. The prevalence of malaria among HIV seropositive individuals and the impact of the co-infection on their hemoglobin levels. Ann Clin Microbiol Antimicrob. 2015;14:10. doi: 10.1186/s12941-015-0064-6. - DOI - PMC - PubMed
    1. Saracino A, et al. Prevalence and clinical features of HIV and malaria co-infection in hospitalized adults in Beira. Mozamb Malar J. 2012;11:241. doi: 10.1186/1475-2875-11-241. - DOI - PMC - PubMed
    1. ter Kuile FO, et al. The burden of co-infection with human immunodeficiency virus type 1 and malaria in pregnant women in sub-saharan Africa. Am J Trop Med Hyg. 2004;71(2 Suppl):41–54. doi: 10.4269/ajtmh.2004.71.41. - DOI - PubMed

Publication types