. 2022 Jul;10(13):e15240.
doi: 10.14814/phy2.15240.

Location-specific cutaneous electrical stimulation of the footsole modulates corticospinal excitability to the plantarflexors and dorsiflexors during standing

Affiliations

Location-specific cutaneous electrical stimulation of the footsole modulates corticospinal excitability to the plantarflexors and dorsiflexors during standing

Gagan Gill et al. Physiol Rep. 2022 Jul.

Abstract

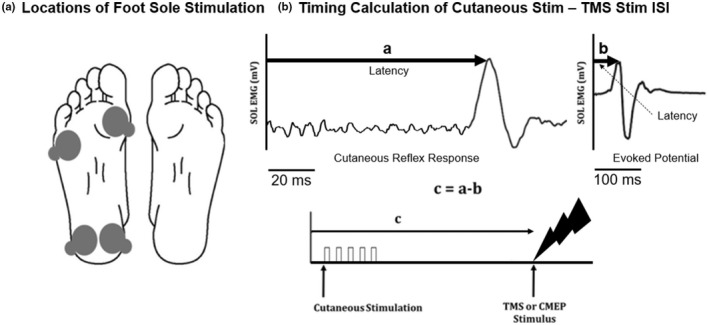
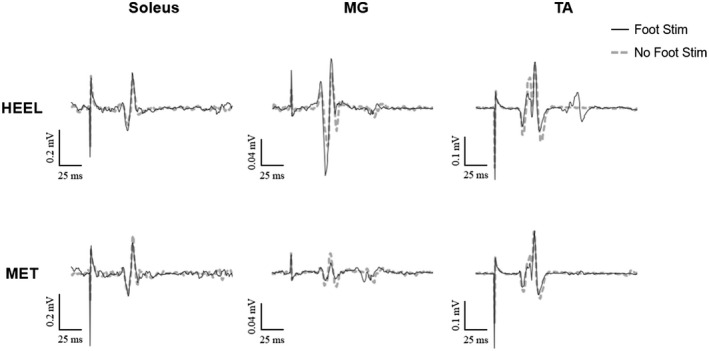
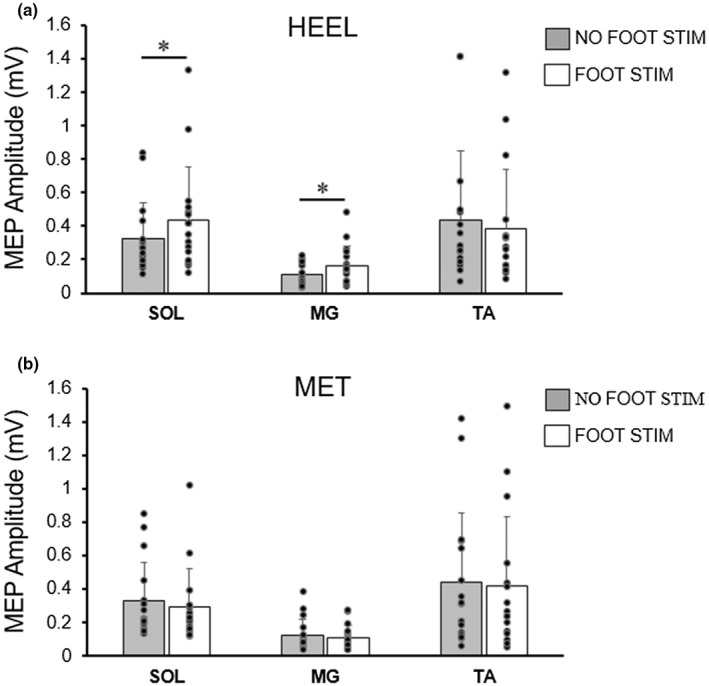
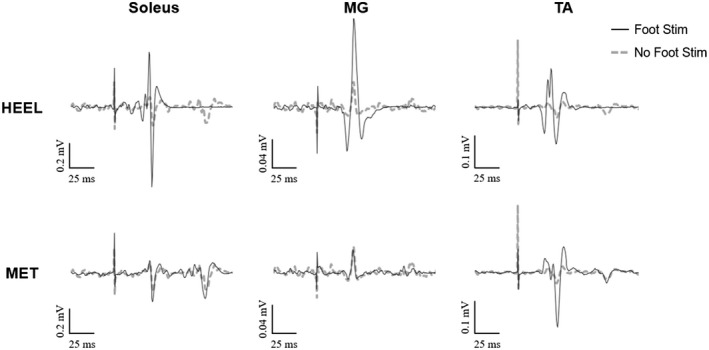
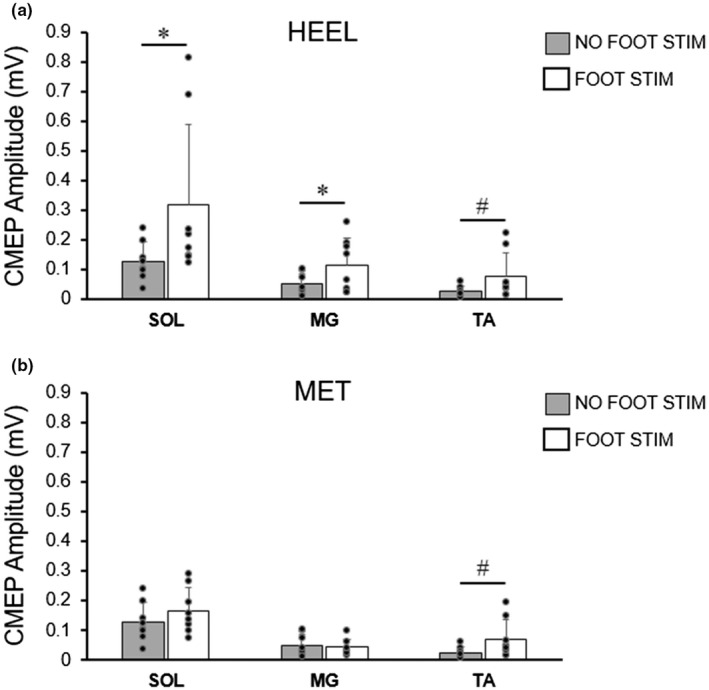
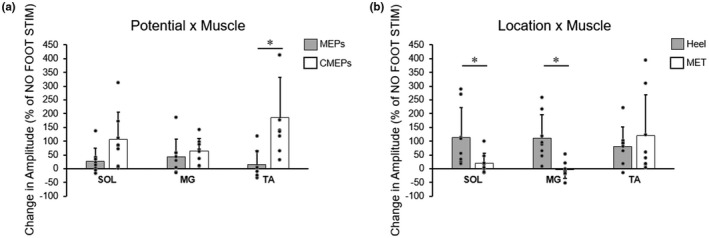
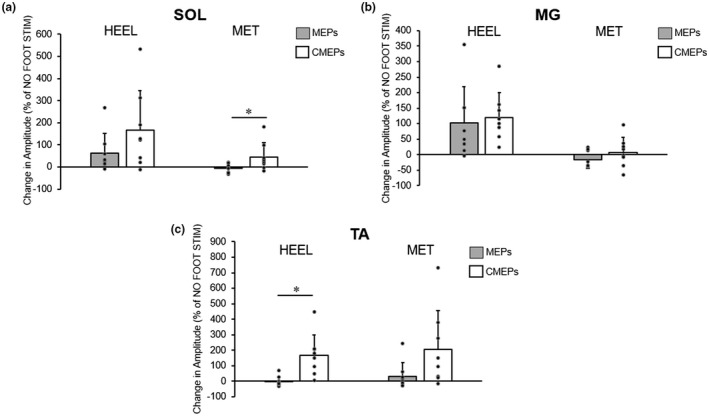
Non-noxious electrical stimulation to distinct locations of the foot sole evokes location-specific cutaneous reflex responses in lower limb muscles. These reflexes occur at latencies that may enable them to be mediated via a transcortical pathway. Corticospinal excitability to the plantarflexors and dorsiflexors was measured in 16 participants using motor evoked potentials (MEPs). Spinal excitability was measured in eight of the original participants using cervicomedullary motor evoked potentials (CMEPs). Measurements were collected with and without preceding cutaneous stimulus to either the heel (HEEL) or metatarsal (MET) locations of the foot sole, and evoked potentials were elicited to coincide with the arrival of the cutaneous volley at either the motor cortex or spinal cord. Plantarflexor MEPs and CMEPs were facilitated with cutaneous stimulation to the HEEL for MEPs (soleus p = 0.04, medial gastrocnemius (MG) p = 0.017) and CMEPs (soleus p = 0.047 and MG p = 0.015), but they were unchanged following MET stimulation for MEPs or CMEPs. Dorsiflexor MEPs were unchanged with cutaneous stimulation at either location, but dorsiflexor CMEPs increased with cutaneous stimulation (p = 0.05). In general, the increase in CMEP amplitudes was larger than the increase in MEP amplitudes, indicating that an increase in spinal excitability likely explains most of the increase in corticospinal excitability. The larger change observed in the CMEP also indicates that excitability from supraspinal sources likely decreased, which could be due to a net change in the excitability of intracortical circuits. This study provides evidence that cutaneous reflexes from foot sole skin are likely influenced by a transcortical pathway.

Keywords: cervicomedullary junction stimulation; cutaneous electrical stimulation; cutaneous reflexes; plantar sole; transcortical pathway; transcranial magnetic stimulation.


Conflict of interest statement

The authors declare no conflict of interests.

Figures

FIGURE 1
FIGURE 1
(A) Locations of plantar sole stimulation over the metatarsal and heel regions. Circles represent placement of electrodes on the right foot sole for stimulation of either the metatarsal or heel locations. (B) Timing of cutaneous stimulation relative to cortical and cervicomedullary stimulation. a latency (ms) is the time to the peak reflex response (occurring between 70 and 110 ms) measured in the soleus (SOL) following 100 electrical stimulations to either the HEEL or MET skin locations on the foot sole. b latency (ms) is the time to the peak of the evoked potential in the SOL occurring with TMS or cervicomedullary stimulation (CMEP). This is the estimated efferent conduction time. The c (ms) value, which is the interstimulus interval between the train of electrical stimulation to the plantar sole and the TMS or CMEP pulse, is calculated by a − b. Thus, c is the estimated afferent conduction time from the foot sole to the motor cortex. cwas calculated separately for TMS and CMS as these techniques have different latencies.
FIGURE 2
FIGURE 2
Average motor evoked potentials (MEPs) recorded from the soleus (SOL), medial gastrocnemius (MG) and the tibialis anterior (TA) of a representative individual during standing. Each trace is the average of 20 potentials. Solid black lines depict MEPs that were elicited following cutaneous foot sole stimulation; dashed gray lines depict MEPs that were elicited without preceding stimulation.
FIGURE 3
FIGURE 3
Group averages (means ± SD, n = 16) of MEP amplitudes elicited in the soleus (SOL), medial gastrocnemius (MG), and tibialis anterior (TA) with (white bars) or without (gray bars) preceding cutaneous foot sole stimulation. Individual data are represented by black circles. Foot sole stimulation was delivered at the heel (a) and the metatarsal (MET) locations (b). * indicates a significant difference between no foot stim and foot stim (*p < 0.05).
FIGURE 4
FIGURE 4
Average cervicomedullary motor evoked potentials (CMEPs) of the soleus (SOL), medial gastrocnemius (MG) and the tibialis anterior (TA) of a representative individual during standing. Each trace is an average of 10 potentials. Solid black lines depict CMEPs that occurred following cutaneous foot sole stimulation; dashed gray lines depict CMEPs that occurred without preceding stimulation.
FIGURE 5
FIGURE 5
Group averages (means ± SD, n = 8) of CMEP amplitudes elicited in the soleus (SOL), medial gastrocnemius (MG), and tibialis anterior (TA) with (white bars) or without (gray bars) preceding sucutaneous foot sole stimulation. Individual data are represented by black circles. Foot sole stimulation was delivered at the heel (a) and the metatarsal (MET) locations (b). * indicates a significant difference between no foot stim and foot stim (*p < 0.05). # indicates a significant main effect across both stimulation locations (p < 0.05)
FIGURE 6
FIGURE 6
Group averages (means ± SD, n = 8) of MEP and CMEP amplitudes, expressed as a percent change from control (no foot stimulation) trials, elicited in the soleus (SOL), medial gastrocnemius (MG), and tibialis anterior (TA). Gray and white bars depict MEP amplitudes and CMEP amplitudes, respectively, in panel a. Gray and white bars depict cutaneous foot sole stimulation at either the heel or metatarsal (MET) location, respectively, in panel b. Individual data are represented by black circles. Results are collapsed across location (a) and potential (b) to depict findings from 3‐way repeated measures ANOVA. * indicates a significant difference between either potentials (MEPs vs. CMEPs) or between locations (HEEL vs. MET) within a given muscle (*p < 0.05)
FIGURE 7
FIGURE 7
Group averages (means ± SD, n = 8) of MEP and CMEP amplitudes, expressed as a percent change from control (no foot stimulation) trials, elicited in (a) the soleus (SOL), (b) medial gastrocnemius (MG), and (c) tibialis anterior (TA). Gray and white bars depict MEP amplitudes (from experiment 1 data) and CMEP amplitudes (from experiment 2 data), respectively, following cutaneous foot sole stimulation at either the heel or metatarsal (MET) locations. Individual data are represented by black circles. * indicates a significant difference between potentials (MEPs vs. CMEPs) at a single location, determined via a priori planned paired t‐tests

Similar articles

References

    1. Aimonetti, J. , & Nielsen, J. B. (2001). Changes in intracortical excitability induced by stimulation of wrist afferents in man. The Journal of Physiology, 534, 891–902. 10.1111/j.1469-7793.2001.00891.x - DOI - PMC - PubMed
    1. Aniss, A. M. , Gandevia, S. C. , & Burke, D. (1992). Reflex responses in active muscles elicited by stimulation of low‐threshold afferents from the human foot. Journal of Neurophysiology, 67, 1375–1384. - PubMed
    1. Clouston, P. D. , Kiers, L. , Menkes, D. , Sander, H. , Chiappa, K. , & Cros, D. (1995). Modulation of motor activity by cutaneous input: Inhibition of the magnetic motor evoked potential by digital electrical stimulation. Electroencephalography and Clinical Neurophysiology/Electromyography and Motor Control, 97, 114–125. 10.1016/0924-980X(94)00310-4 - DOI - PubMed
    1. Collins, B. W. , Cadigan, E. W. J. , Stefanelli, L. , & Button, D. C. (2017). Corticospinal excitability of the biceps brachii is shoulder position dependent. Journal of Neurophysiology, 118, 3242–3251. 10.1152/jn.00527.2017 - DOI - PubMed
    1. Day, B. L. , Dressler, D. , Maertens de Noordhout, A. , Marsden, C. D. , Nakashima, K. , Rothwell, J. C. , & Thompson, P. D. (1989). Electric and magnetic stimulation of human motor cortex: Surface EMG and single motor unit responses. Journal of Physiology, 412, 449–473. 10.1113/jphysiol.1989.sp017626 - DOI - PMC - PubMed

Publication types

LinkOut - more resources