. 2022 Aug;21(8):e13662.
doi: 10.1111/acel.13662. Epub 2022 Jul 1.

Urolithin A improves mitochondrial health, reduces cartilage degeneration, and alleviates pain in osteoarthritis

Affiliations

Urolithin A improves mitochondrial health, reduces cartilage degeneration, and alleviates pain in osteoarthritis

Davide D'Amico et al. Aging Cell. 2022 Aug.

Abstract

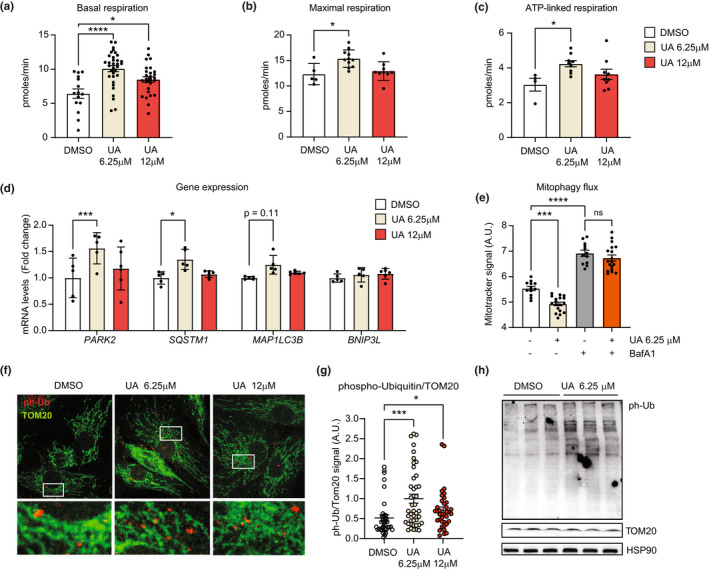
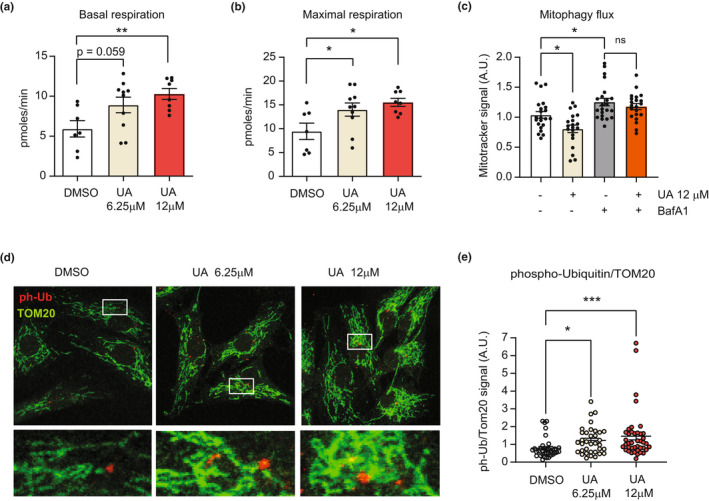
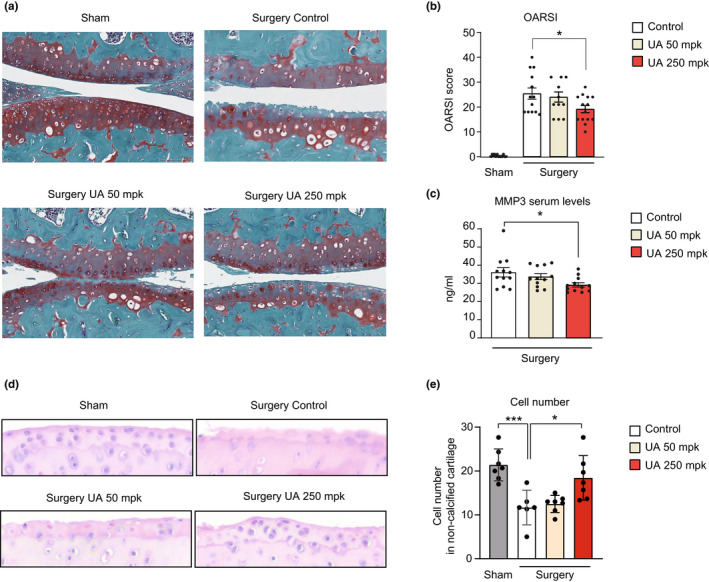
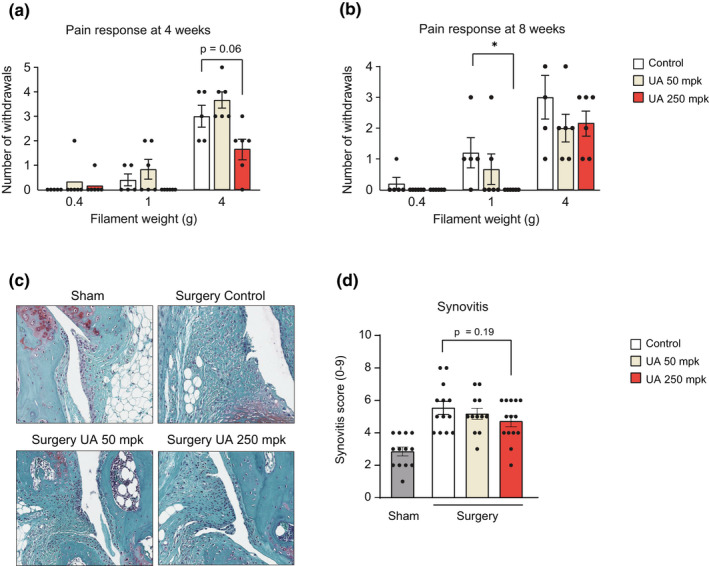
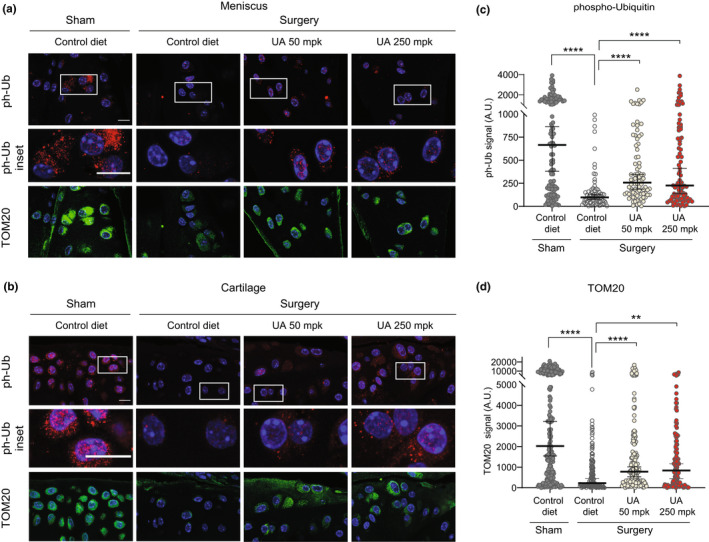
Osteoarthritis (OA) is the most common age-related joint disorder with no effective therapy. According to the World Health Organization, OA affects over 500 million people and is characterized by degradation of cartilage and other joint tissues, severe pain, and impaired mobility. Mitochondrial dysfunction contributes to OA pathology. However, interventions to rescue mitochondrial defects in human OA are not available. Urolithin A (Mitopure) is a natural postbiotic compound that promotes mitophagy and mitochondrial function and beneficially impacts muscle health in preclinical models of aging and in elderly and middle-aged humans. Here, we showed that Urolithin A improved mitophagy and mitochondrial respiration in primary chondrocytes from joints of both healthy donors and OA patients. Furthermore, Urolithin A reduced disease progression in a mouse model of OA, decreasing cartilage degeneration, synovial inflammation, and pain. These improvements were associated with increased mitophagy and mitochondrial content, in joints of OA mice. These findings indicate that UA promotes joint mitochondrial health, alleviates OA pathology, and supports Urolithin A's potential to improve mobility with beneficial effects on structural damage in joints.

Keywords: Mitopure; chondrocytes; mitochondria; mitophagy; osteoarthritis; urolithin.


Conflict of interest statement

The authors declare the following competing interests: D.D., A.M.F, and C.R. are current employees and P.V. and P.A.A. were prior employees of Amazentis SA; C.R. is board member of Amazentis SA.

Figures

FIGURE 1
FIGURE 1
(a–c) Oxygen consumption rates (OCR) showing basal (a) maximal (b) and ATP‐linked (c) mitochondrial respiration in primary healthy chondrocytes (HC), treated with DMSO or Urolithin A (UA) at 6.25 μM and 12 μM for 24 h. (technical replicates for a, 15–33; for b, 5–9; for c, 5–9). *p < 0.05; ****p < 0.0001 after one‐way ANOVA. Error bars represent mean ± SEM. (d) mRNA levels of mitophagy/autophagy genes PARK2, SQSTM1, MAP1LC3B, and BNIP3 in HC treated with DMSO or the indicated doses of UA for 24 h (N = 5). *p < 0.05; ***p < 0.001 after one‐way ANOVA. Error bars represent mean ± SEM. (e) Mitotracker green fluorescent signal, representing the mitochondria quantity in cells treated with DMSO, 6.25 μM UA, 100 nM bafilomycin A1 (BafA1) or cotreated with both 6.25 μM UA and 100 nM BafA1 for 24 h. (N = 12–18). ***p < 0.001; ****p < 0.0001 after one‐way ANOVA. Error bars represent mean ± SEM. (f, g) Representative images of HC treated as in (d) for 24 h and stained for TOM20 (green) and phospho‐ubiquitin (ph‐Ub, red). White squares indicate regions corresponding to insets. Nuclei were stained in blue with DAPI (f). Corresponding quantification of the intensity of ph‐Ub over TOM20 (g). (N = 27–43) *p < 0.05; ***p < 0.001 after one‐way ANOVA. Error bars represent mean ± SEM. (h) Western blot of HC treated DMSO or UA at 6.25 μM for 24 h and probed with antibodies against phospho‐ubiquitin (ph‐Ub), TOM20 and HSP90 mitochondrial and cellular loading controls
FIGURE 2
FIGURE 2
(a, b) Oxygen consumption rates (OCR) showing basal (a) and FCCP‐induced maximal respiration (b) in human primary chondrocytes (HC) from an OA patient, treated with DMSO or UA at 6.25 μM and 12 μM for 24 h (a). (N = 7–10). *p < 0.05; **p < 0.01; after one‐way ANOVA. Error bars represent mean ± SEM. (c) Mitotracker green fluorescent signal, in cells treated with DMSO, 12 μM UA,  100 nM bafilomycin A1 (BafA1) or cotreated with both 12 μM UA and 100 nM BafA1 for 24 h. (N = 22–24). *p < 0.05, after one‐way ANOVA. Error bars represent mean ± SEM. (d, e) Representative images of HC treated as above for 24 h and stained for TOM20 (green) and phospho‐ubiquitin (ph‐Ub, red). White squares indicate the regions corresponding to insets. Nuclei were stained in blue with DAPI (D). Corresponding quantification of the intensity of ph‐Ub over TOM20 (E). (N = 35–40) *p < 0.05; ***p < 0.001 after one‐way ANOVA. Error bars represent mean ± SEM
FIGURE 3
FIGURE 3
(a) Representative images of safranin‐O staining of knee joints of sham and operated leg. DMM surgery causes cartilage erosion in the middle zone in femur and tibia and additional loss of superficial zone and uncalcified cartilage. Scale bar 100 μM. (b) Mean OARSI score for each mouse, ranging from 0 (no damage) to 48 (maximal degeneration) (n = 13 control, n = 12 UA 50 mpk, and n = 14 UA 250 mpk). *p < 0.05, one‐way ANOVA. Error bars represent mean ± SEM. (c) Serum levels of metalloproteinase 3 (MMP3) in the indicated groups expressed as ng/mL (n = 13). *p < 0.05, one‐way ANOVA. Error bars represent mean ± SEM. (d) Representative joint sections form the indicated groups stained with hematoxylin‐eosin (H&E). Magnification: 10 × . (e) Quantitative analysis of cell number from (d) (N = 6). *p < 0.05, ***p < 0.001 one‐way ANOVA. Error bars represent mean ± SEM
FIGURE 4
FIGURE 4
(a, b) Von Frey test performed at 4‐ (a) and 8‐week (B) post‐surgery. The mean withdraw response ± SEM is shown for both legs in each mouse and ranges from 0 (no pain response) to 5 (maximal pain response). Von Frey filaments used correspond to 0.4, 1, and 4 g (n = 5 control, n = 6 UA 50 mpk, and n = 6 UA 250 mpk). *p < 0.05. One‐way ANOVA. Error bars represent mean ± SEM. (c) Representative images of knee synovial membrane in sham and operated leg in the indicated groups, stained with safranin‐O. (d) Quantification of Krenn score to determine synovitis from images as in (c). Data for each mouse range from 0 (no synovitis) to 9 (maximal inflammation) (n = 13 control, n = 12 UA 50 mpk, and n = 14 UA 250 mpk). One‐way ANOVA. Error bars represent mean ± SEM
FIGURE 5
FIGURE 5
(a) Representative confocal images of meniscus area from the indicated groups stained against phospho‐ubiquitin (ph‐Ub, red) and TOM20 (green). White squares indicate the regions corresponding to insets. Nuclei were stained in blue with DAPI. Scale bar 10 μM. (b) Representative confocal images of cartilage area from the indicated groups (n = 6 ) stained as in (a). Scale bar 10 μM. (c, d) Corresponding quantification of ph‐Ub (c) and TOM20 (d) fluorescent signal per cell (arbitrary units) in 2 to 3 independent regions from both meniscus and cartilage area from 4 to 5 mice per group. Each dot represents one cell (N = 70–112). **p < 0.01; ****p ≤ 0.0001. One‐way ANOVA. Error bars represent mean ± SEM

References

    1. Andreux, P. A. , Blanco‐Bose, W. , Ryu, D. , Burdet, F. , Ibberson, M. , Aebischer, P. , Auwerx, J. , Singh, A. , & Rinsch, C. (2019). The mitophagy activator urolithin a is safe and induces a molecular signature of improved mitochondrial and cellular health in humans. Nature Metabolism, 1, 595–603. - PubMed
    1. Ansari, M. Y. , Khan, N. M. , Ahmad, I. , & Haqqi, T. M. (2018). Parkin clearance of dysfunctional mitochondria regulates ROS levels and increases survival of human chondrocytes. Osteoarthritis and Cartilage, 26, 1087–1097. - PMC - PubMed
    1. Attur, M. , Krasnokutsky‐Samuels, S. , Samuels, J. , & Abramson, S. B. (2013). Prognostic biomarkers in osteoarthritis. Current Opinion in Rheumatology, 25(1), 136–144. - PMC - PubMed
    1. Barbero, A. , Grogan, S. , Schäfer, D. , Heberer, M. , Mainil‐Varlet, P. , & Martin, I. (2004). Age related changes in human articular chondrocyte yield, proliferation and post‐expansion chondrogenic capacity. Osteoarthritis and Cartilage, 12, 476–484. - PubMed
    1. Blanco, F. J. , & Rego‐Pérez, I. (2020). Mitochondrial DNA in osteoarthritis disease. Clinical Rheumatology, 39, 3255–3259. - PubMed

Publication types

Substances

LinkOut - more resources