

Conformational entropy limits the transition from nucleation to elongation in amyloid aggregation
- PMID: 35778843
- PMCID: PMC9388551
- DOI: 10.1016/j.bpj.2022.06.031
Conformational entropy limits the transition from nucleation to elongation in amyloid aggregation
Abstract
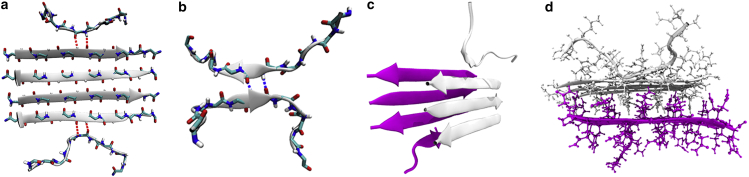
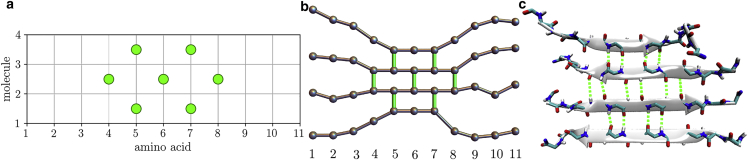
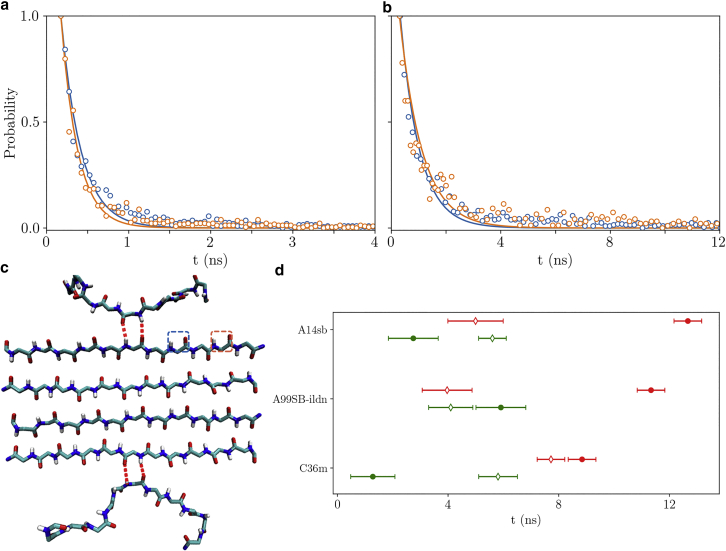
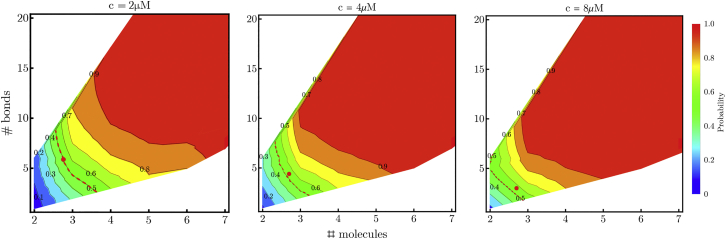
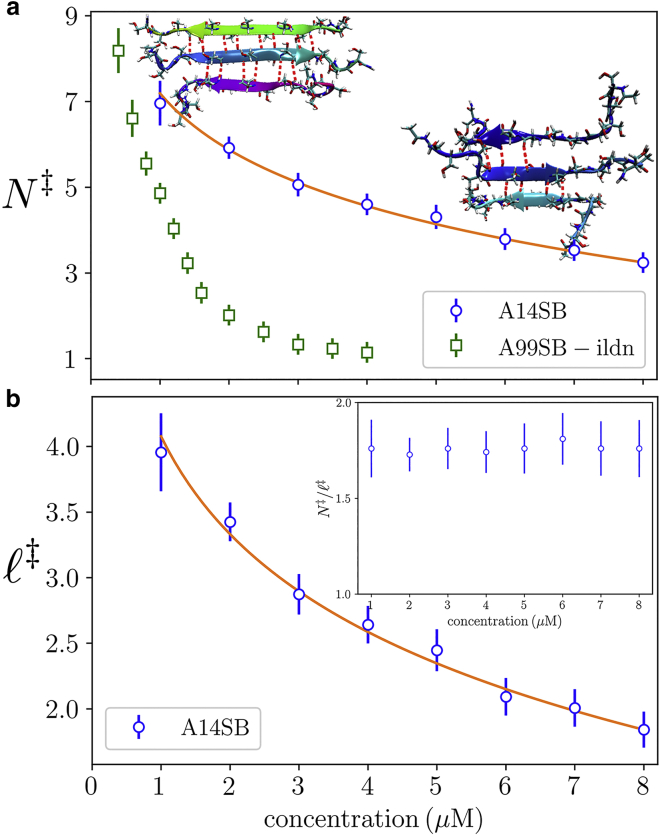
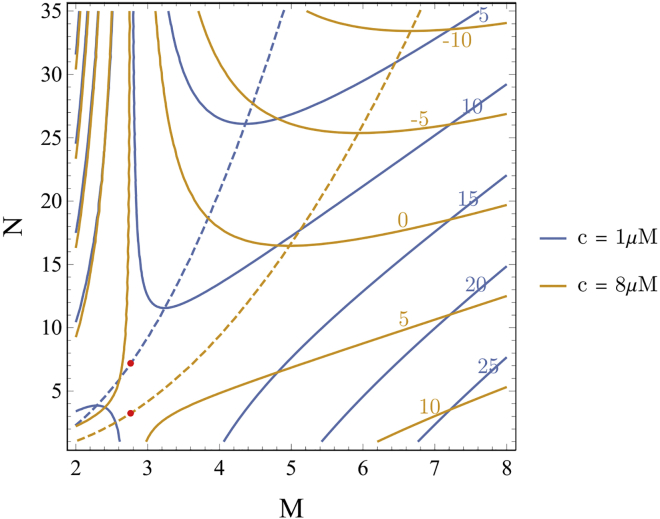
The formation of β-sheet-rich amyloid fibrils in Alzheimer's disease and other neurodegenerative disorders is limited by a slow nucleation event. To understand the initial formation of β-sheets from disordered peptides, we used all-atom simulations to parameterize a lattice model that treats each amino acid as a binary variable with β- and non-β-sheet states. We show that translational and conformational entropy give the nascent β-sheet an anisotropic surface tension that can be used to describe the nucleus with 2D classical nucleation theory. Since translational entropy depends on concentration, the aspect ratio of the critical β-sheet changes with protein concentration. Our model explains the transition from the nucleation phase to elongation as the point where the β-sheet core becomes large enough to overcome the conformational entropy cost to straighten the terminal molecule. At this point the β-strands in the nucleus spontaneously elongate, which results in a larger binding surface to capture new molecules. These results suggest that nucleation is relatively insensitive to sequence differences in coaggregation experiments because the nucleus only involves a small portion of the peptide.
Copyright © 2022 Biophysical Society. Published by Elsevier Inc. All rights reserved.
Conflict of interest statement
Declaration of interests The authors declare no competing interests.
Figures
Similar articles
-
SEVI Inhibits Aβ Amyloid Aggregation by Capping the β-Sheet Elongation Edges.J Chem Inf Model. 2023 Jun 12;63(11):3567-3578. doi: 10.1021/acs.jcim.3c00414. Epub 2023 May 29. J Chem Inf Model. 2023. PMID: 37246935 Free PMC article.
-
Critical Nucleus Structure and Aggregation Mechanism of the C-terminal Fragment of Copper-Zinc Superoxide Dismutase Protein.ACS Chem Neurosci. 2016 Mar 16;7(3):286-96. doi: 10.1021/acschemneuro.5b00242. Epub 2016 Feb 10. ACS Chem Neurosci. 2016. PMID: 26815332 Free PMC article.
-
Nucleation process of a fibril precursor in the C-terminal segment of amyloid-β.Phys Rev Lett. 2013 Apr 19;110(16):168103. doi: 10.1103/PhysRevLett.110.168103. Epub 2013 Apr 17. Phys Rev Lett. 2013. PMID: 23679641
-
Understanding amyloid fibril nucleation and aβ oligomer/drug interactions from computer simulations.Acc Chem Res. 2014 Feb 18;47(2):603-11. doi: 10.1021/ar4002075. Epub 2013 Dec 24. Acc Chem Res. 2014. PMID: 24368046 Review.
-
Alzheimer's beta-amyloid: insights into fibril formation and structure from Congo red binding.Subcell Biochem. 2005;38:203-24. doi: 10.1007/0-387-23226-5_10. Subcell Biochem. 2005. PMID: 15709480 Review.
Cited by
-
Multiscale simulations elucidate the mechanism of polyglutamine aggregation and the role of flanking domains in fibril polymorphism.bioRxiv [Preprint]. 2025 May 23:2025.05.19.654960. doi: 10.1101/2025.05.19.654960. bioRxiv. 2025. PMID: 40475647 Free PMC article. Preprint.
-
Transient interdomain interactions modulate the monomeric structural ensemble and self-assembly of Huntingtin Exon 1.bioRxiv [Preprint]. 2024 Dec 11:2024.05.03.592468. doi: 10.1101/2024.05.03.592468. bioRxiv. 2024. Update in: Adv Sci (Weinh). 2025 Jul;12(27):e2501462. doi: 10.1002/advs.202501462. PMID: 38766024 Free PMC article. Updated. Preprint.
-
The mechanism of amyloid fibril growth from Φ-value analysis.Nat Chem. 2025 Mar;17(3):403-411. doi: 10.1038/s41557-024-01712-9. Epub 2025 Jan 16. Nat Chem. 2025. PMID: 39820805
-
Competing addition processes give distinct growth regimes in the assembly of 1D filaments.Biophys J. 2025 Mar 4;124(5):778-788. doi: 10.1016/j.bpj.2025.01.018. Epub 2025 Jan 28. Biophys J. 2025. PMID: 39876561
-
Pathologic polyglutamine aggregation begins with a self-poisoning polymer crystal.Elife. 2023 Nov 3;12:RP86939. doi: 10.7554/eLife.86939. Elife. 2023. PMID: 37921648 Free PMC article.
References
-
- Chiti F., Dobson C.M. Protein misfolding, functional amyloid, and human disease. Annu. Rev. Biochem. 2006;75:333–366. - PubMed
-
- Erdemir D., Lee A.Y., Myerson A.S. Nucleation of crystals from solution: classical and two-step models. Acc. Chem. Res. 2009;42:621–629. - PubMed
-
- Chen J., Zhu E., et al. De Yoreo J.J. Building two-dimensional materials one row at a time: avoiding the nucleation barrier. Science. 2018;362:1135–1139. - PubMed
-
- Auer S., Dobson C.M., et al. Maritan A. Self-templated nucleation in peptide and protein aggregation. Phys. Rev. Lett. 2008;101:258101. - PubMed
Publication types
MeSH terms
Substances
Grants and funding
LinkOut - more resources
Full Text Sources
