. 2022 Dec;11(23):4641-4655.
doi: 10.1002/cam4.4844. Epub 2022 Jul 2.

Construction and validation of a prognostic model based on 11 lymph node metastasis-related genes for overall survival in endometrial cancer

Affiliations

Construction and validation of a prognostic model based on 11 lymph node metastasis-related genes for overall survival in endometrial cancer

Hong Wu et al. Cancer Med. 2022 Dec.

Abstract

Background: Endometrial cancer (EC) is one of the most common malignant tumors in female reproductive system. The incidence of lymph node metastasis (LNM) is only about 10% in clinically suspected early-stage EC patients. Discovering prognostic models and effective biomarkers for early diagnosis is important to reduce the mortality rate.

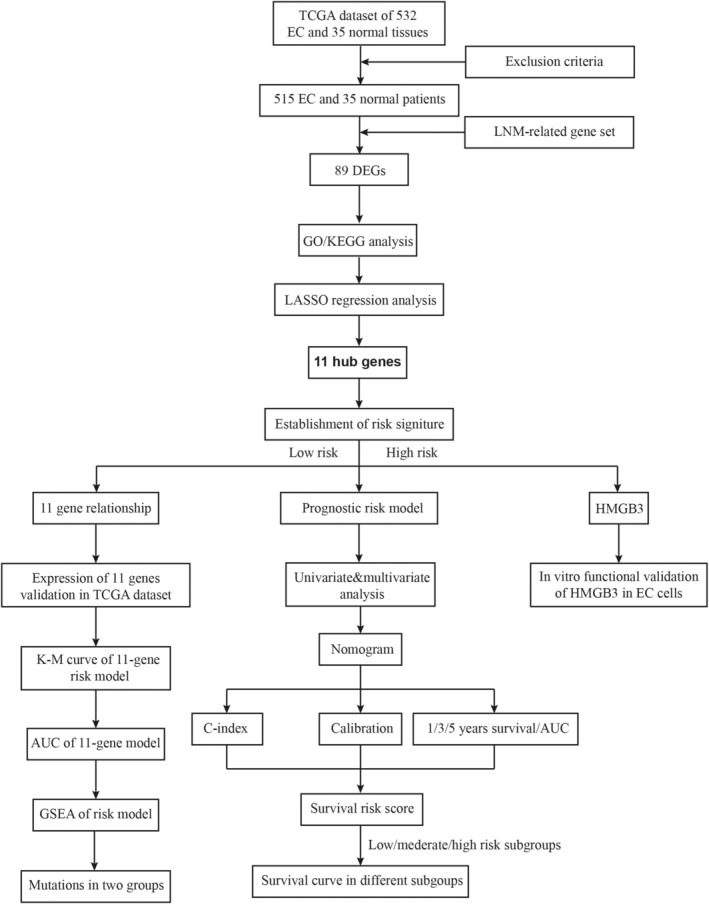
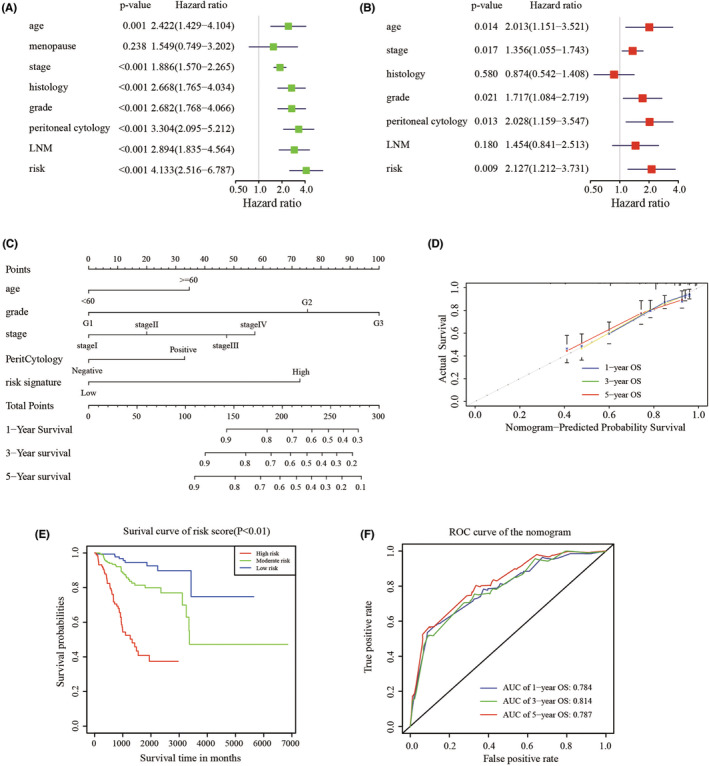
Methods: A least absolute shrinkage and selection operator (LASSO) regression was conducted to identify the characteristic dimension decrease and distinguish porgnostic LNM related genes signature. Subsequently, a novel prognosis-related nomogram was constructed to predict overall survival (OS). Survival analysis was carried out to explore the individual prognostic significance of the risk model and key gene was validated in vitro.

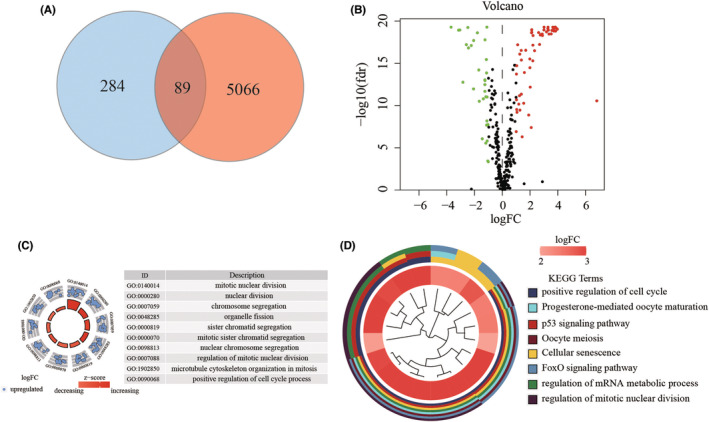
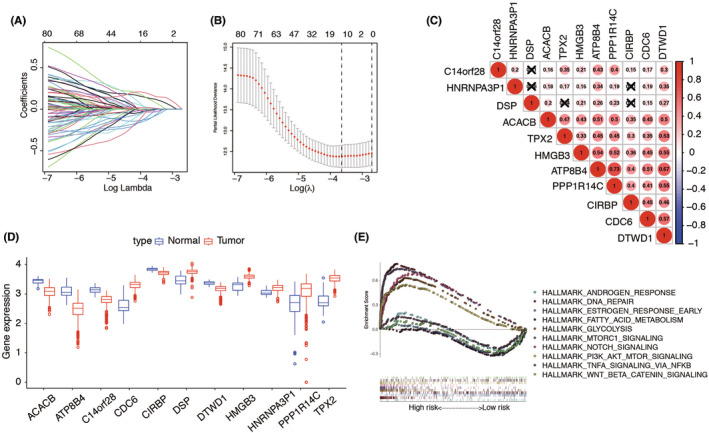
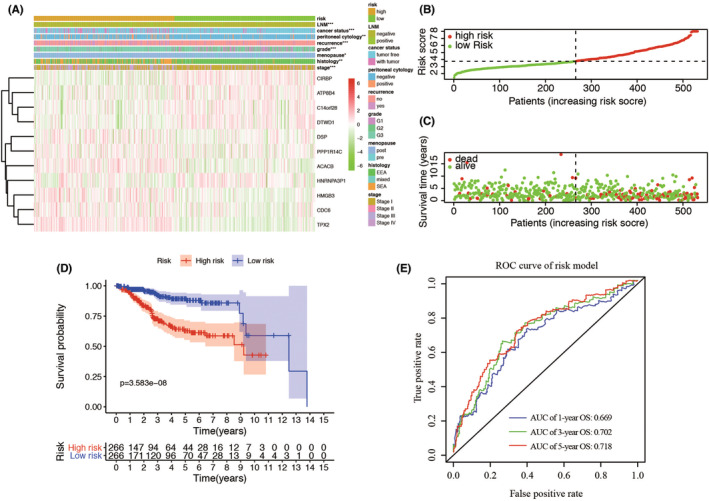
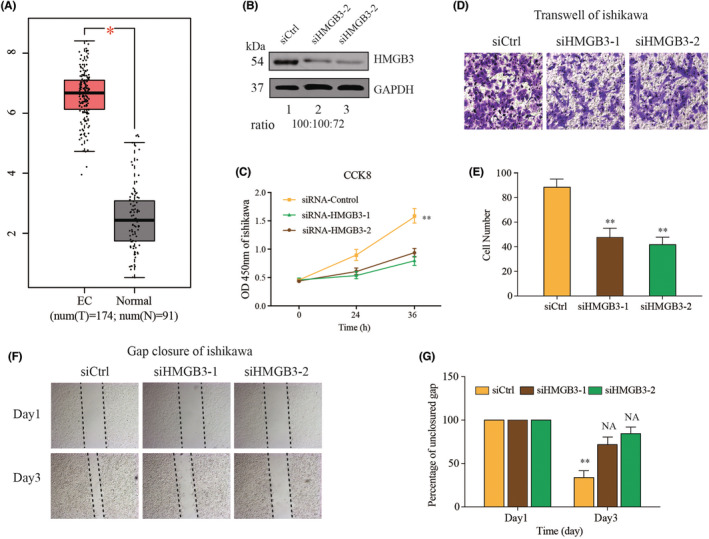
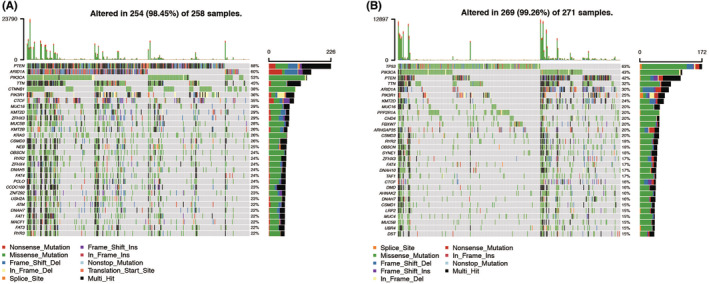
Results: In total, 89 lymph node related genes (LRGs) were identified. Based on the LASSO Cox regression, 11 genes were selected for the development of a risk evaluation model. The Kaplan-Meier curve indicated that patients in the low-risk group had considerably better OS (p = 3.583e-08). The area under the ROC curve (AUC) of this model was 0.718 at 5 years of OS. Then, we developed an OS-associated nomogram that included the risk score and clinicopathological features. The concordance index of the nomogram was 0.769. The survival verification performed in three subgroups from the nomogram demonstrated the validity of the model. The AUC of the nomogram was 0.787 at 5 years OS. Proliferation and metastasis of HMGB3 were explored in EC cell line. External validation with 30 patients in our hospital showed that patients with low-risk scores had a longer OS (p-value = 0.03). Finally, we revealed that the most frequently mutated genes in the low-risk and high-risk groups are PTEN and TP53, respectively.

Conclusions: Our results suggest that LNM plays an important role in the prognosis, and HMGB3 was potential as a biomarker for EC patients.

Keywords: HMGB3; endometrial cancer; lymph node metastasis; mutation; risk signature.


Conflict of interest statement

The authors have no conflicts of interest to disclose.

Figures

FIGURE 1
FIGURE 1
Flowchart for identifying the LNM‐related prognostic signature.
FIGURE 2
FIGURE 2
Identification and functional analysis of LRGs in EC. (A). The intersect LNM‐related genes were associated with DEGs between normal and EC tissues. (B). Volcano plot was drawn to show the differentially expressed LNM‐related genes. (C). Enrichment analysis reveals the top 10 GO terms and (D). KEGG pathways.
FIGURE 3
FIGURE 3
Construction of risk signature with LRGs. (A). LASSO coefficients. (B). Plots of the 10‐time cross‐validation for tuning parameter selection in the least absolute shrinkage and selection operator (LASSO) model. The dashes signify the value of the minimal error and greater λ value. (C). Spearman correlation analysis of the 11 LNM‐related genes. (D). The expression of 11 LRGs between TCGA endometrial cancer (EC) and normal tissues. (E). GSEA showed significant enrichment of the tumor‐related signaling pathways.
FIGURE 4
FIGURE 4
Prognostic analysis of the risk model in the TCGA patients. (A). The heatmap shows the expression of the 11 genes in high‐risk and low‐risk group of EC. The distribution of clinicopathological characteristics was compared between the high‐risk and low‐risk groups. (B–C). The distributions of the five‐gene signature and survival status of the patients in the risk signature. (D). Kaplan–Meier survival analysis with patients in low‐ and high‐risk groups. (E). 1‐, 3‐, 5‐year survival time‐dependent receiver operating characteristic (ROC) curve. p < 0.05; **, p < 0.01; ***, p < 0.001. ROC, receiver operating characteristic; AUC, area under the ROC curve. E. The 1‐, 3‐, and 5‐year AUC of ROC curves.
FIGURE 5
FIGURE 5
Construction and validation of nomogram. (A‐B). Univariate and multivariate Cox analyses of cervical cancer. (C). Nomogram used to predict prognosis in patients with endometrial cancer at 1, 3, and 5 years. (D). Calibration curves for the nomogram at 1‐. 3‐, and 5‐year overall survival. (E). Survival curve of patients in low‐, moderate‐, and high‐score according to the total score of the nomogram. (F). ROC curve of 1‐, 3‐, 5‐year survival depend on the nomogram.
FIGURE 6
FIGURE 6
In vitro functional validation of the HMGB3. (A). The relative expression of HMGB3 in GEPIA. (B). Knockdown efficiency of HMGB3 by two small interferon RNA transfection. (C). Proliferative effect of HMGB3 on Ishikawa evaluated by Cell Counting Kit‐8 tests. (D). Effects of HMGB3 on the invasion of Ishikawa cells evaluated by Transwell assays. (E). Statistical analysis of the Transwell invasion. (F) Effects of MMP12 on the migration of Ishikawa cells evaluated by gap closure assays. (G) Statistical analysis of the gap closure. *p < 0.05, **p < 0.01.
FIGURE 7
FIGURE 7
Landscape of mutation genes in low‐ and high‐risk groups. Waterfall plot showing mutation profiles of each gene in each endometrial cancer sample. (A). Low risk group. (B). High risk group.

Similar articles

Cited by

References

    1. Siegel RL, Miller KD, Jemal A. Cancer statistics, 2018. CA Cancer J Clin. 2018;68:7‐30. - PubMed
    1. Chen W, Zheng R, Baade PD, et al. Cancer statistics in China, 2015. CA Cancer J Clin. 2016;66:115‐132. - PubMed
    1. Pecorelli S. Revised FIGO staging for carcinoma of the vulva, cervix, and endometrium. Int J Gynaecol Obstet. 2009;105:103‐104. - PubMed
    1. Kourou K, Exarchos TP, Exarchos KP, Karamouzis MV, Fotiadis DI. Machine learning applications in cancer prognosis and prediction. Comput Struct Biotechnol J. 2015;13:8‐17. - PMC - PubMed
    1. Pfaff E, Aichmuller C, Sill M, et al. Molecular subgrouping of primary pineal parenchymal tumors reveals distinct subtypes correlated with clinical parameters and genetic alterations. Acta Neuropathol. 2020;139:243‐257. - PMC - PubMed

Substances