. 2022 Jul 2;39(7):msac134.
doi: 10.1093/molbev/msac134.

Warthog Genomes Resolve an Evolutionary Conundrum and Reveal Introgression of Disease Resistance Genes

Affiliations

Warthog Genomes Resolve an Evolutionary Conundrum and Reveal Introgression of Disease Resistance Genes

Genís Garcia-Erill et al. Mol Biol Evol. .

Abstract

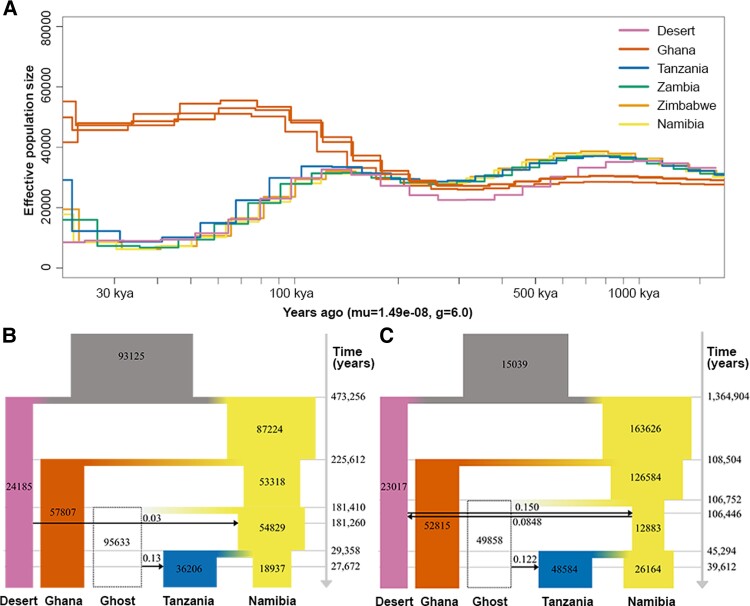
African wild pigs have a contentious evolutionary and biogeographic history. Until recently, desert warthog (Phacochoerus aethiopicus) and common warthog (P. africanus) were considered a single species. Molecular evidence surprisingly suggested they diverged at least 4.4 million years ago, and possibly outside of Africa. We sequenced the first whole-genomes of four desert warthogs and 35 common warthogs from throughout their range. We show that these two species diverged much later than previously estimated, 400,000-1,700,000 years ago depending on assumptions of gene flow. This brings it into agreement with the paleontological record. We found that the common warthog originated in western Africa and subsequently colonized eastern and southern Africa. During this range expansion, the common warthog interbred with the desert warthog, presumably in eastern Africa, underlining this region's importance in African biogeography. We found that immune system-related genes may have adaptively introgressed into common warthogs, indicating that resistance to novel diseases was one of the most potent drivers of evolution as common warthogs expanded their range. Hence, we solve some of the key controversies surrounding warthog evolution and reveal a complex evolutionary history involving range expansion, introgression, and adaptation to new diseases.

Keywords: Phacochoerus evolution; African phylogeography; disease resistance; introgression; population structure.


Figures

Fig. 1.
Fig. 1.
Sampling localities and population structure. (A) Sampling localities and number of individuals remaining after filtering (see supplementary material table S1, Supplementary Material online). Approximate geographic limits of the four currently recognized subspecies of common warthog are shown. Species and subspecies ranges based on Vercammen and Mason (1993), Muwanika et al. (2003), Butynski and De Jong (2018), De Jong and Butynski (2018), De Jong et al. (2018, in press). (B) Plot of common warthog samples, colored by sample country, on the first two principal components inferred with PCAngsd. (C) Admixture proportions of common warthog samples, estimated with NGSadmix assuming five ancestral clusters. (D) Genome-wide heterozygosity of all desert and common warthog samples, calculated from genotype likelihoods with realSFS. Similar levels were obtained for the high-depth individuals with genotype calls (supplementary material fig. S4, Supplementary Material online). Above the plot, we show the topology of the TreeMix tree without migrations (see supplementary material fig. S8, Supplementary Material online for full TreeMix result).
Fig. 2.
Fig. 2.
Warthog phylogeographic synthesis. (A) Summary of the main phylogeographic findings in the present study. Solid arrows show the inferred directionality of the range expansions; their width is proportional to inferred genetic diversity. The transparent arrow marks the introgression between desert warthogs and common warthogs. Also shown is an approximate current outline of the Central African rainforest (FAO 2012). (B) Posterior mean migration rates among common warthog localities, estimated with EEMS. (C) Population pairwise FST values based on single, high-depth individuals (above diagonal), and several low-depth individuals (below diagonal) per population. (D) FST between pairs of common warthog populations, estimated with realSFS, against the geographical distance between corresponding pairs of localities. Geographic distance is the shortest distance when either taking into account the Central African rainforest as a barrier (squares) or taking the great circle distance among localities (circles). Notice the improved linear fit when including the rainforest as a barrier, compared with the great circle distance.
Fig. 3.
Fig. 3.
Introgression between desert warthogs and common warthogs. (A) D-statistics when using desert warthog samples as P3 and common warthog samples as P1 and P2, grouped by the country of origin of the two common warthog samples. D-statistics are estimated both from called genotypes for the high-depth samples, using qpDstat, and by single read sampling for all possible combinations of low-depth samples from the corresponding P1, P2, and P3 populations, using ANGSD. (B) Cartoon visualization of an admixture graph fitted to a reduced data set, showing the relationships among common warthogs from the three main lineages and the desert warthog. The admixture graph was estimated with qpGraph from called genotypes using a single high-depth sample per population. See in supplementary material fig. S7, Supplementary Material online estimates of branch length for the graph, and all other compatible admixture graphs for the same set of populations identified with qpBrute.
Fig. 4.
Fig. 4.
Demographic history of desert warthogs and common warthogs. (A) Effective population size of common warthog and desert warthog populations changes across time, estimated from high-depth samples using PSMC. (B) Schematic diagram depicting the fastsimcoal2 demographic model and parameter point estimates, when using the best-fitting qpgraph to fix the topology of the admixture graph and admixture proportions (1-admixture model). All inferred demographic parameters and 95% confidence intervals are shown in supplementary material table S5, Supplementary Material online. (C) Schematic diagram depicting a more general demographic model, where the admixture proportions are estimated parameters and bidirectional migration involving common warthogs to desert warthogs introgression is allowed (3-admixture model). All inferred demographic parameters and 95% confidence intervals are shown in supplementary material table S6, Supplementary Material online.
Fig. 5.
Fig. 5.
Adaptive introgression scan. (A) Manhattan plot of fd values estimated for 100 kb windows, estimated from called genotypes using the four high-depth common warthog from eastern and southern Africa samples with desert warthog ancestry as P2, the Ghana common warthog as P1, the desert warthog sample as P3, and the domestic pig as out-group. For windows with high desert warthog admixture, the names of the genes overlapping them are shown. (B) Distribution of the fd values plotted in A, indicating the 99.9% quantile used as a threshold to detect outliers. (C) Plot of fd and FST within two outlying FST windows and its surrounding genomic region, together with its annotated protein coding genes. Light gray-shaded areas indicate sites excluded from the analyses. Supplementary material fig. S10, Supplementary Material online shows local context plots for all outlying windows in the genome scan.

References

    1. FAO . 2012. Global Ecological Zones for FAO Forest Reporting: 2010 Update. Rome, Italy: Food and Agriculture Organization of the United Nations.
    1. Andrews S. 2010. FastQC: a quality control tool for high throughput sequence data [cited 2022 Jun 21]. Available from: http://www.bioinformatics.babraham.ac.uk/projects/fastqc/.
    1. Antón SC, Potts R, Aiello LC. 2014. Evolution of early Homo: an integrated biological perspective. Science. 345:1236828. - PubMed
    1. Arctander P, Johansen C, Coutellec-Vreto MA. 1999. Phylogeography of three closely related African bovids (tribe Alcelaphini). Mol Biol Evol. 16:1724–1739. - PubMed
    1. Bergeron LA, Besenbacher S, Turner T, Versoza CJ, Wang RJ, Price AL, Armstrong E, Riera M, Carlson J, Chen H-Y, et al. 2022. The Mutationathon highlights the importance of reaching standardization in estimates of pedigree-based germline mutation rates. Elife. 11:e73577. - PMC - PubMed

Publication types