. 2022 Aug:54:102379.
doi: 10.1016/j.redox.2022.102379. Epub 2022 Jun 24.

Transketolase in human Müller cells is critical to resist light stress through the pentose phosphate and NRF2 pathways

Affiliations

Transketolase in human Müller cells is critical to resist light stress through the pentose phosphate and NRF2 pathways

Yingying Chen et al. Redox Biol. 2022 Aug.

Abstract

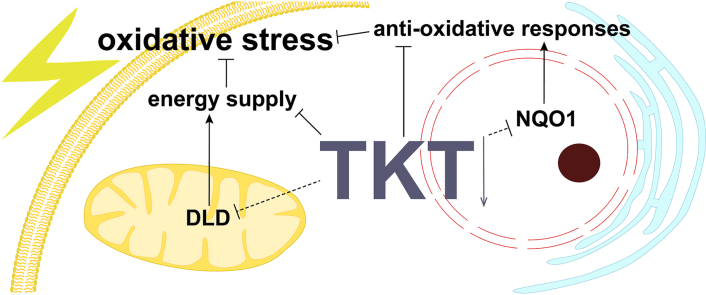
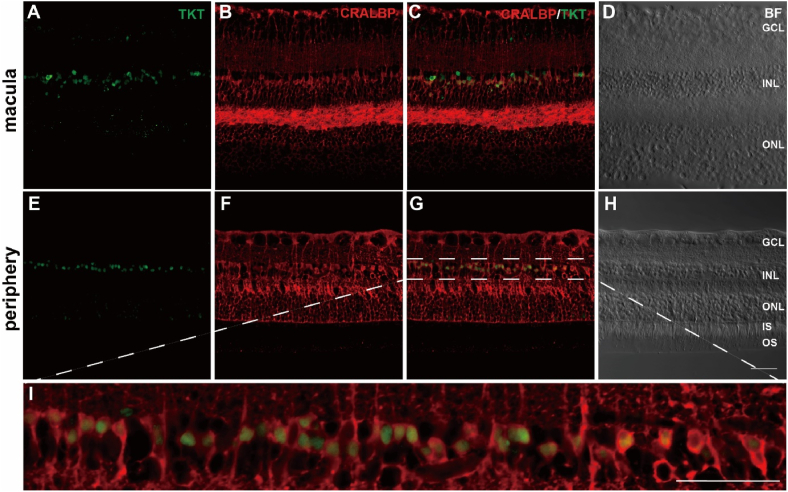
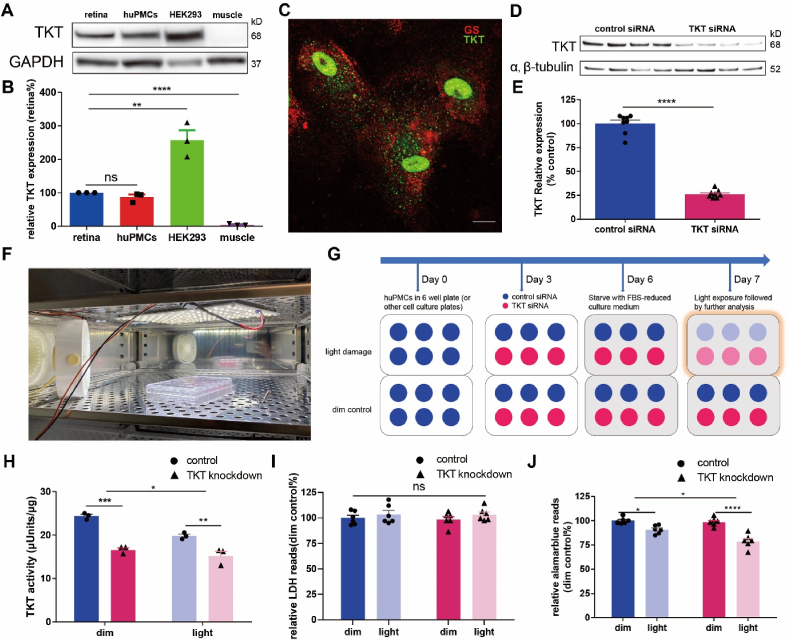
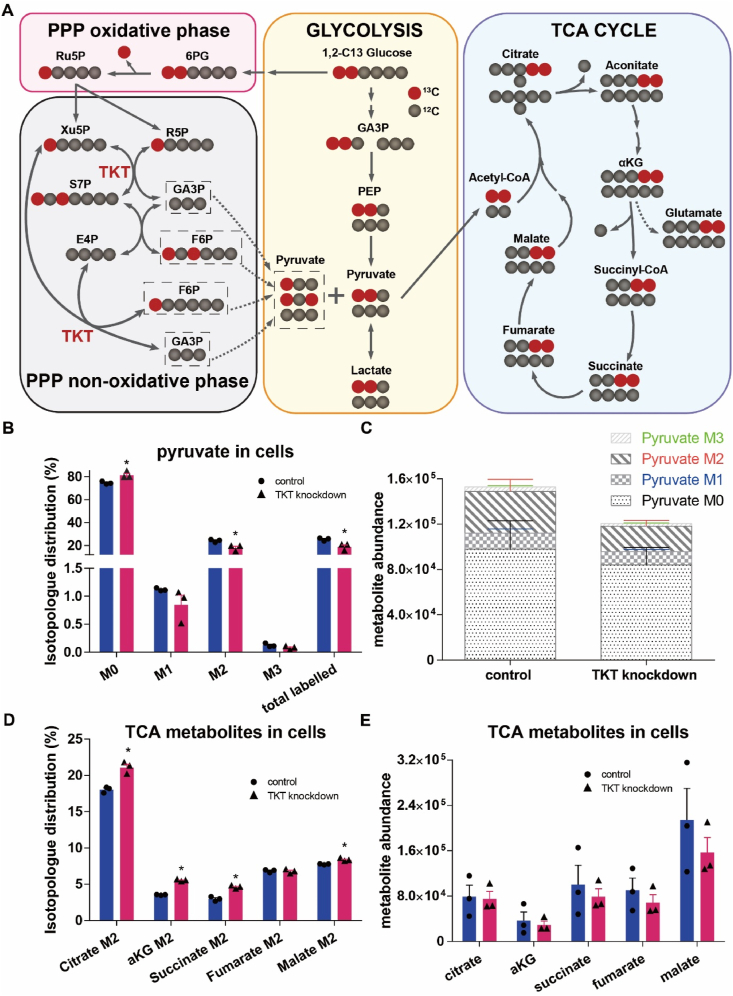
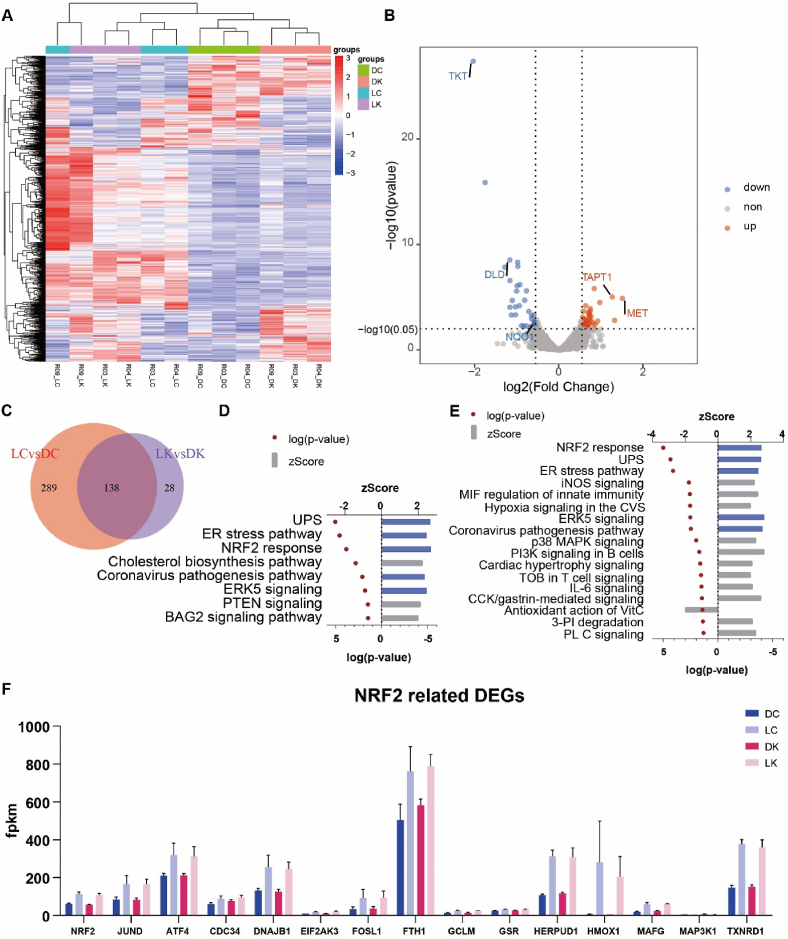
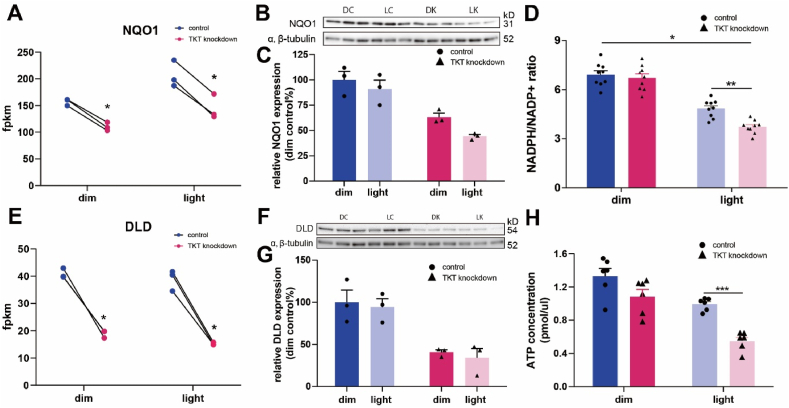
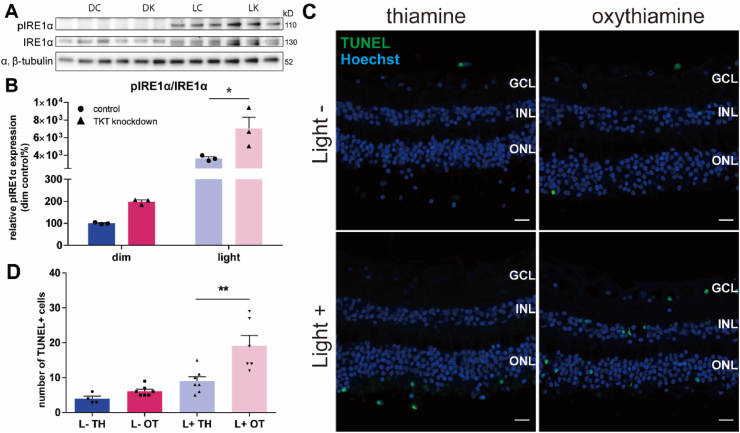
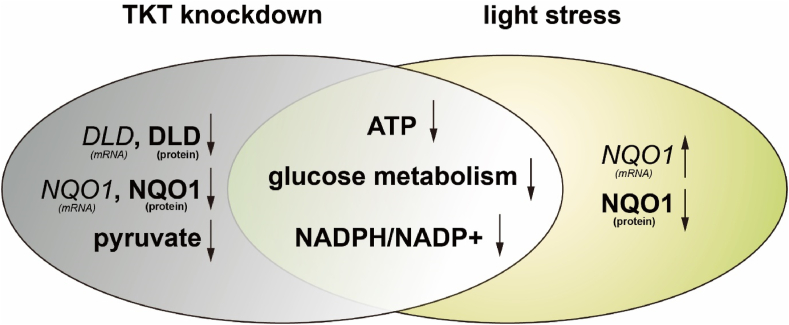
The Pentose Phosphate Pathway (PPP), a metabolic offshoot of the glycolytic pathway, provides protective metabolites and molecules essential for cell redox balance and survival. Transketolase (TKT) is the critical enzyme that controls the extent of "traffic flow" through the PPP. Here, we explored the role of TKT in maintaining the health of the human retina. We found that Müller cells were the primary retinal cell type expressing TKT in the human retina. We further explored the role of TKT in human Müller cells by knocking down its expression in primary cultured Müller cells (huPMCs), isolated from the human retina (11 human donors in total), under light-induced oxidative stress. TKT knockdown and light stress reduced TKT enzymatic activities and the overall metabolic activities of huPMCs with no detectable cell death. TKT knockdown restrained the PPP traffic flow, reduced the expression of NAD(P)H Quinone Dehydrogenase 1 (NQO1), impaired the antioxidative response of NRF2 to light stress and aggravated the endoplasmic reticulum (ER) stress. TKT knockdown also inhibited overall glucose intake, reduced expression of Dihydrolipoamide dehydrogenase (DLD) and impaired the energy supply of the huPMCs. In summary, Müller cell-mediated TKT activity plays a critical protective role in the stressed retina. Knockdown of TKT disrupted the PPP and impaired overall glucose utilisation by huPMCs and rendered huPMCs more vulnerable to light stress by impairing energy supply and antioxidative NRF2 responses.

Keywords: Müller cells; NQO1; NRF2; Oxidative stress; Pentose phosphate pathway; Transketolase (TKT).


Conflict of interest statement

The authors declare that they have no conflict of interest.

Figures

Image 1
Graphical abstract
Fig. 1
Fig. 1
TKT expression in the healthy human macula (A-D) and peripheral retina (E-I). A, B, E, F Human retina immunoreactivity for TKT (green, A and E) and CRALBP (red, Müller cell marker, B and F). C, G CRALBP and TKT double staining. D, H Bright-field images. I Field-enlarged image from G (dotted box). Both scale bars are equal to 50 μm. BF: bright field. GCL: ganglion cell layer. INL: inner nuclear layer. IS: inner segments. ONL: outer nuclear layer. OS: outer segments. TKT: transketolase. (For interpretation of the references to colour in this figure legend, the reader is referred to the Web version of this article.)
Fig. 2
Fig. 2
TKT function in human Müller cells. A WB analysis of TKT and GAPDH in the human retina, human primary Müller cells, HEK293 cells (positive control) and human extraocular muscle (negative control). B Quantitative analysis of TKT expression in the cells and tissue. TKT expression level is normalised against GAPDH. C Immunofluorescence of huPMCs with TKT (green) and Müller cell marker GS (red) staining. Scale bar = 20 μm. D WB analysis of TKT and α/β tubulin in huPMCs with control siRNA or TKT siRNA treatment. E Quantitative analysis of TKT expression with control siRNA or TKT siRNA treatment. TKT expression level is normalised against α/β tubulin. n = 8 per group. Error bars = SEM. F Light exposure apparatus within the cell culture incubator. G Experimental design schematic of light exposure following TKT knockdown: third passage (P3) huPMCs were seeded on day 0 and treated with siRNAs treatment on day 3. Three days later, cells were starved overnight. Light exposure experiments were conducted on day 7, followed by further analysis. H Reduction in TKT enzymatic activity after TKT knockdown and light stress. n = 3 per group. Error bars = SEM. I LDH assay and J AlamarBlue assay after TKT knockdown and light stress. All reads were normalised to the average read of the dim control group. n = 6 per group. Error bars = SEM. All comparisons between two groups (short lines) were conducted using a t-test. Longline in Figures H and J indicated an interaction between TKT knockdown and light exposure detected using two-way ANOVA. Long dash in figure I indicated no significant difference between all four groups. ns: not statically significant; *: p < 0.05; **: p < 0.01; ***: p < 0.001; ****: p < 0.0001. Errors bars = SEM. CRALBP: Cellular retinaldehyde–binding protein. GAPDH: Glyceraldehyde 3-phosphate dehydrogenase. huPMCs: human primary Müller cells. LDH: Lactate dehydrogenase. siRNA: small interfering RNA. TKT: transketolase. WB: Western blot. (For interpretation of the references to colour in this figure legend, the reader is referred to the Web version of this article.)
Fig. 3
Fig. 3
Metabolic analysis of huPMCs following TKT knockdown. A Schematic of metabolic pathways with intermediates labelled from 1, 2–13C glucose. Glucose enters the tricarboxylic acid (TCA) cycle (blue block) after glycolysis (yellow block). Alternatively, glucose enters the PPP with the oxidative phase (pink block) and non-oxidative phase (grey block). GA3P and F6P in PPP non-oxidative phase can re-enter glycolysis in a TKT-dependent fashion. B Isotopologue analysis of pyruvate. Mn: molecules with n13C (n: number of 13C). C Abundance of pyruvate isotopologues. D Isotopologue analysis of M2 metabolites (citrate, aKG, succinate, fumarate, and malate) in TCA cycle. E Abundance of total citrate, aKG, succinate, fumarate, and malate. B, D: All comparisons were conducted using a t-test. n = 3 per group. Error bars = SEM. *: p < 0.05. 6 PG: 6-phosphogluconate. αKG: α-ketoglutarate. E4P: erythrose 4-phosphate. F6P: fructose 6-phosphate. GA3P: glyceraldehyde 3-phosphate. GC-MS: Gas Chromatography-Mass Spectrometry. PEP: phosphoenolpyruvate. PPP: pentose phosphate pathway. R5P: ribose 5-phosphate. Ru5P: ribulose 5-phosphate. S7P: sedoheptulose 7-phosphate. TCA: tricarboxylic acid cycle. TKT: transketolase. Xu5P: xylulose 5-phosphate. (For interpretation of the references to colour in this figure legend, the reader is referred to the Web version of this article.)
Fig. 4
Fig. 4
Transcriptomic analysis of huPMCs after transketolase (TKT) knockdown and light stress. A heatmap of clustered differentially expressed genes (DEGs). Samples were from three donors (R03, R04, R09), shown at the bottom of the heatmap. Each donor had four groups, “dim control” (DC), “dim knockdown” (DK), “light control” (LC), “light knockdown” (LK), shown above. Red indicated a higher expression level, while blue indicated a lower expression level. B volcano plot showing DEGs between “DK vs DC”. Gene fold changes are represented on the horizontal axis, with statistically significant changes on the vertical axis. Individual genes were represented by points (grey, not significant; red, significantly upregulated; blue, significantly downregulated). C Venn chart comparing “LC vs DC” DEGs and “LK vs DK” DEGs. D and E Ingenuity Pathway Analysis (IPA) of “LC vs DC” DEGs and “LK vs DK” DEGs. Pathways that were upregulated or downregulated were represented on the vertical axis. The Z-score was represented on the upper horizontal axis. Red dots indicate the -log (p-value), with bars representing activated or inhibited pathways unique to each comparison (grey) or common to both (blue). UPS: unfolded protein response; ER: endoplasmic reticulum; CVS: cardiovascular system; CCK: cholecystokinin; VitC: vitamin C; PI: phosphoinositide; PL: phospholipase; F Prominent NRF2 related DEGs. n = 3 per group. Error bars = SEM. (For interpretation of the references to colour in this figure legend, the reader is referred to the Web version of this article.)
Fig. 5
Fig. 5
NQO1, DLD and anti-oxidation responses. A NQO1 mRNA from huPMCs after control or TKT siRNA knockdown treatment followed by bright or dim light exposure. B WB analysis of NQO1 and α/β tubulin in huPMCs after different treatments. C Quantitative analysis of the NQO1 expression in the cells. NQO1 expression level is normalised to α/β tubulin. n = 3 per group. Error bars = SEM. D NADPH/NADP+ ratio in huPMCs after different treatments. p-value indicated the significance of the variance contributed by the interaction between TKT and light stress. Comparisons were conducted by two-way ANOVA. n = 9 per group. Error bars = SEM. E DLD mRNA from huPMCs after different treatments. F WB analysis of DLD and α/β tubulin in huPMCs after different kinds of treatments. G Quantitative analysis of the DLD expression in the cells. DLD expression level is normalised to α/β tubulin. n = 3 per group. Error bars = SEM. H ATP concentration in huPMCs after different treatments. Comparisons were conducted by two-way ANOVA. n = 6 per group. Error bars = SEM. *: p < 0.05; **: p < 0.01. ATP: Adenosine triphosphate. DC: dim control, DK: dim knockdown, LC: light control, LK: light knockdown. DLD: Dihydrolipoamide dehydrogenase. Fpkm: Fragments Per Kilobase of transcript per Million mapped reads. HuPMCs: human primary Müller cells. NADPH/NADP+: Nicotinamide adenine dinucleotide phosphate. NQO1: NAD(P)H Quinone Dehydrogenase 1. WB: Western blot.
Fig. 6
Fig. 6
TKT was critical for ER stress responses and cell survival in the human retina. A, B WB and quantitative analysis of pIRE1α, IRE1α, and α/β tubulin expression in huPMCs after TKT knockdown and light stress. The expression level is normalised to IRE1α. n = 3 per group. *: p < 0.05. Comparisons were conducted by two-way ANOVA. Error bars = SEM. C TUNEL (green) and Hoechst (blue) staining of retinal explant after thiamine or oxythiamine treatment followed by light stress. Scale bars: 20 μm. GCL: ganglion cell layer. INL: inner nuclear layer. ONL: outer nuclear layer. D Quantitative analysis of the TUNEL staining. **: p < 0.01. Comparisons were conducted by one-way ANOVA. n = 4–7 per group. Error bars = SEM. DC: dim control, DK: dim knockdown, LC: light control, LK: light knockdown. HuPMCs: human primary Müller cells. OT: oxythiamine, TH: thiamine. WB: Western blot. (For interpretation of the references to colour in this figure legend, the reader is referred to the Web version of this article.)
Fig. 7
Fig. 7
A summary of factors involved in TKT knockdown and light stress. TKT knockdown decreased the mRNA and the protein level of both DLD and NQO1. TKT knockdown also inhibited pyruvate synthesis and oxidation. Light stress increased NQO1 mRNA level as a response to oxidative stress. The protein level of NQO1 decreased after a short time of exposure to light. Taken together, TKT knockdown and light stress contributed to the drop of cellular ATP level, glucose metabolism and NADPH/NADP+ ratio. ATP: Adenosine triphosphate. DLD: Dihydrolipoamide dehydrogenase. NADPH/NADP+: Nicotinamide adenine dinucleotide phosphate. NQO1: NAD(P)H Quinone Dehydrogenase 1. TKT: transketolase.

Similar articles

Cited by

References

    1. Reichenbach A., Bringmann A. Glia of the human retina. Glia. 2020;68(4):768–796. - PubMed
    1. Reichenbach A., Bringmann A. New functions of Muller cells. Glia. 2013;61(5):651–678. - PubMed
    1. Coorey N.J., Shen W., Chung S.H., Zhu L., Gillies M.C. The role of glia in retinal vascular disease. Clin. Exp. Optom. 2012;95(3):266–281. - PubMed
    1. Verardo M.R., Lewis G.P., Takeda M., Linberg K.A., Byun J., Luna G., et al. Abnormal reactivity of muller cells after retinal detachment in mice deficient in GFAP and vimentin. Invest. Ophthalmol. Vis. Sci. 2008;49(8):3659–3665. - PMC - PubMed
    1. Coughlin B.A., Feenstra D.J., Mohr S. Muller cells and diabetic retinopathy. Vis. Res. 2017;139:93–100. - PMC - PubMed

Publication types