. 2022 Jul 12;55(7):1284-1298.e3.
doi: 10.1016/j.immuni.2022.06.004. Epub 2022 Jun 7.

Mass cytometry reveals a conserved immune trajectory of recovery in hospitalized COVID-19 patients

Collaborators, Affiliations

Mass cytometry reveals a conserved immune trajectory of recovery in hospitalized COVID-19 patients

Cassandra E Burnett et al. Immunity. .

Abstract

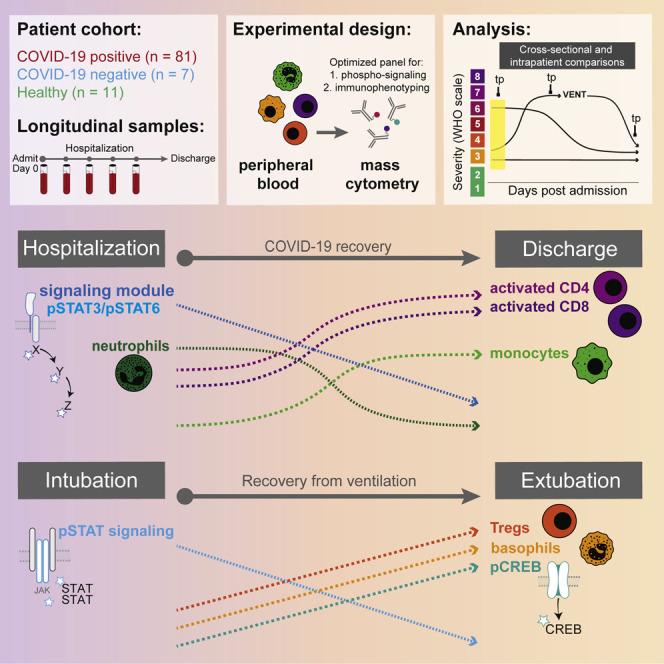
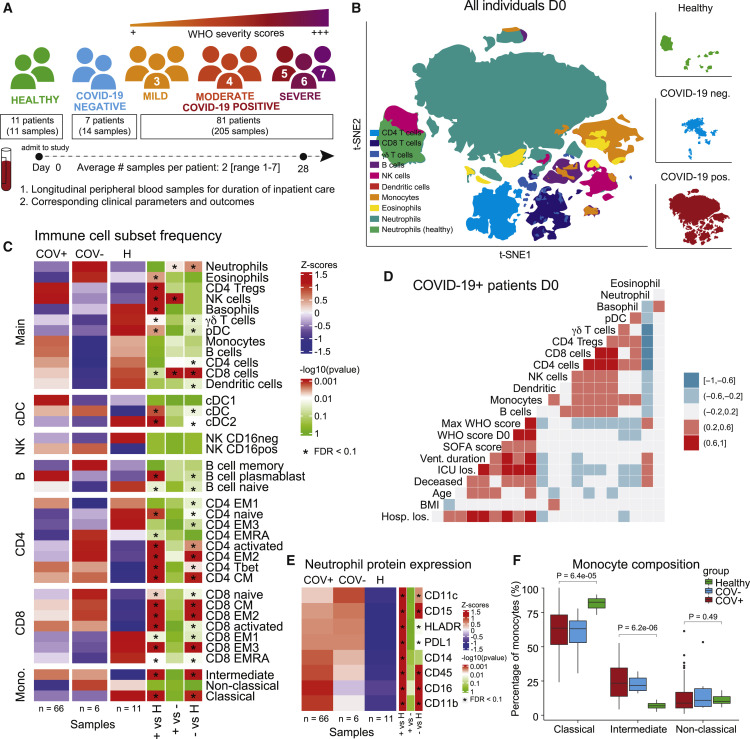
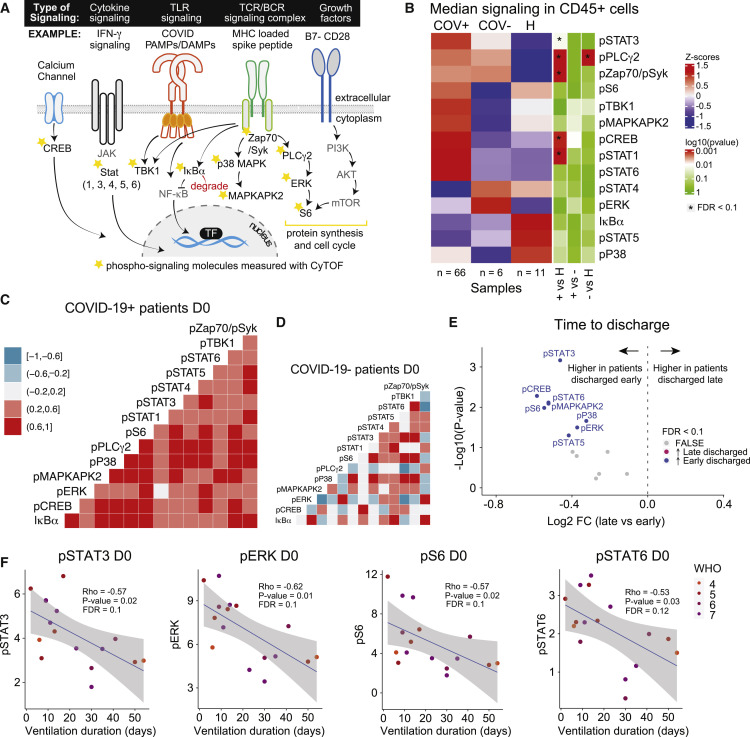
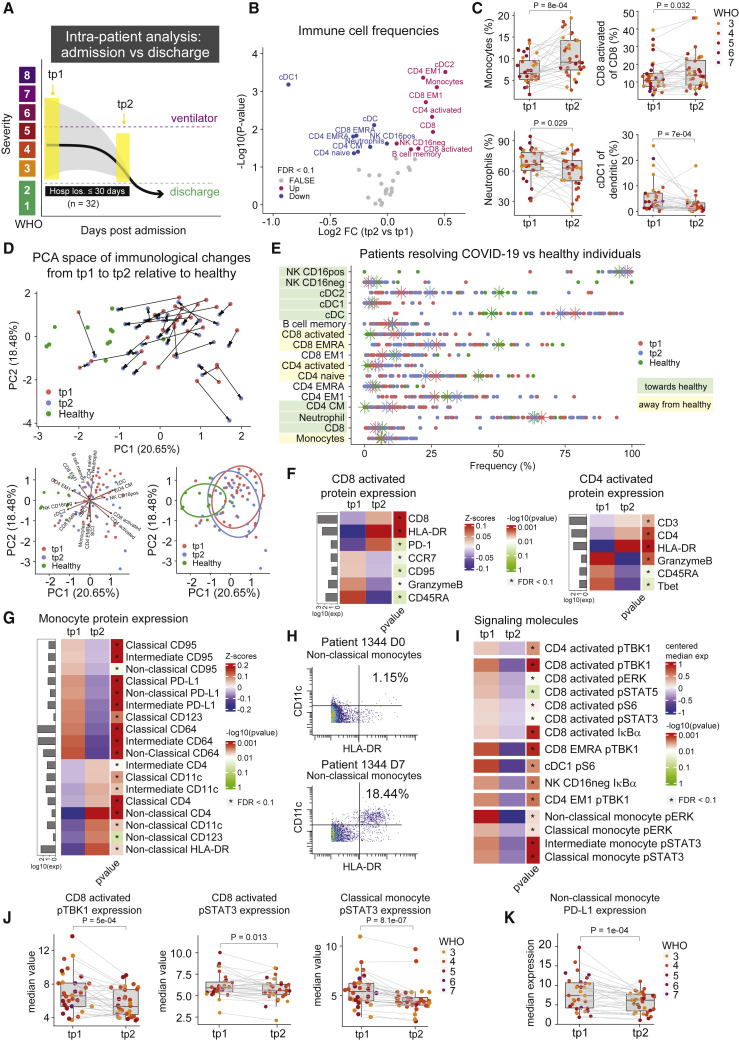
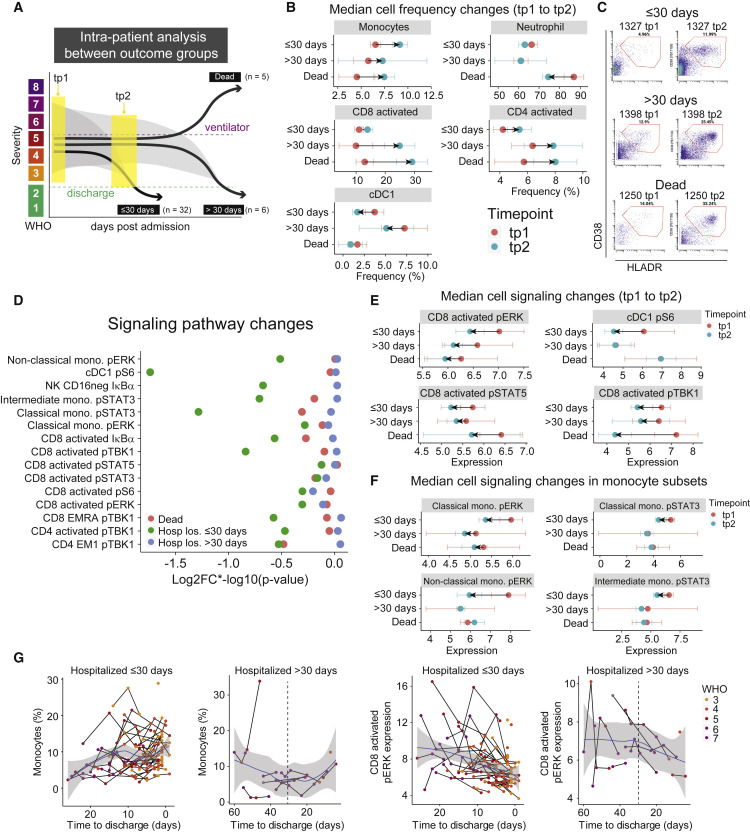
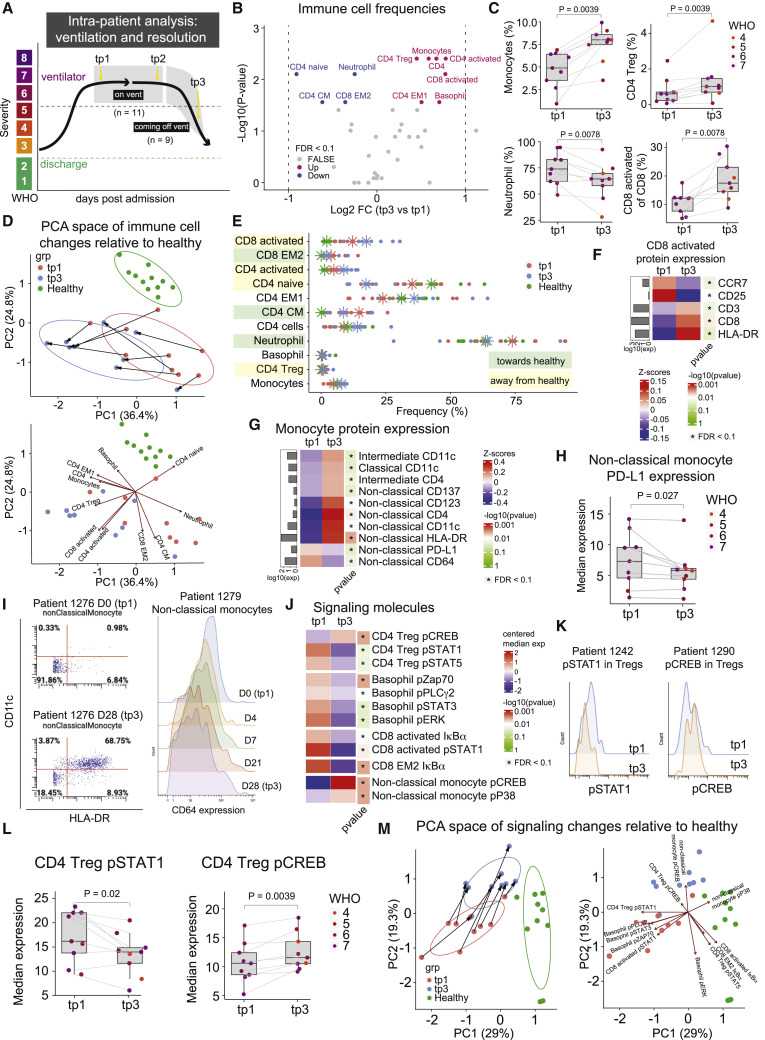
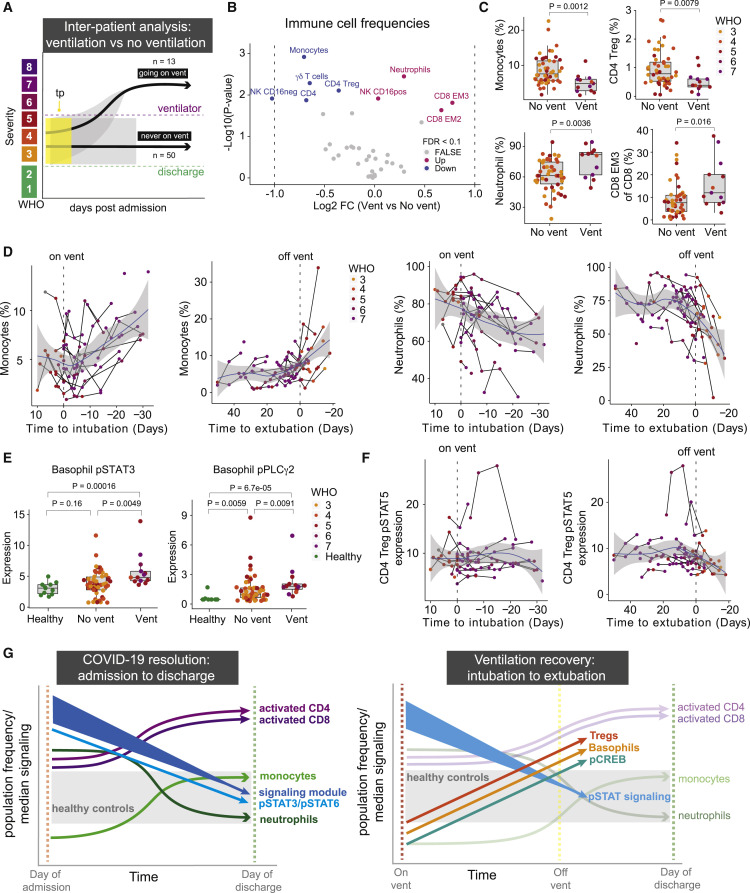
While studies have elucidated many pathophysiological elements of COVID-19, little is known about immunological changes during COVID-19 resolution. We analyzed immune cells and phosphorylated signaling states at single-cell resolution from longitudinal blood samples of patients hospitalized with COVID-19, pneumonia and/or sepsis, and healthy individuals by mass cytometry. COVID-19 patients showed distinct immune compositions and an early, coordinated, and elevated immune cell signaling profile associated with early hospital discharge. Intra-patient longitudinal analysis revealed changes in myeloid and T cell frequencies and a reduction in immune cell signaling across cell types that accompanied disease resolution and discharge. These changes, together with increases in regulatory T cells and reduced signaling in basophils, also accompanied recovery from respiratory failure and were associated with better outcomes at time of admission. Therefore, although patients have heterogeneous immunological baselines and highly variable disease courses, a core immunological trajectory exists that defines recovery from severe SARS-CoV-2 infection.

Keywords: COVID-19; disease resolution; immune cell signaling; immune response; recovery.


Conflict of interest statement

Declaration of interests M.H.S. is a board member and equity holder in Teiko.bio and has received research support from Roche/Genentech, Bristol Myers Squibb, Pfizer, and Valitor. C.S.C. has received funding from NHLBI, FDA, DOD, Genentech, and Quantum Leap Healthcare Collaborative and is on consulting/advisory boards for Vasomune, Gen1e Life Sciences, Janssen, and Cellenkos. C.M.H. has been consulting for Spring Discovery. P.G.W. has a contract from Genentech to study COVID-19.

Figures

None
Graphical abstract
Figure 1
Figure 1
COVID-19 immune phenotype and composition is highly divergent from healthy individuals and has distinct features compared to other severe respiratory infections (A) Overview of cohort. Patients were admitted to the hospital and enrolled in the study at day 0. Peripheral blood samples were collected up until day 28 of hospitalization. Corresponding clinical parameters and WHO scores were documented. 205 samples from 81 COVID-19-positive patients were included in the final cohort. Additionally, 14 samples from 7 COVID-19-negative patients with other respiratory diseases and 11 healthy individuals were included in the study. On average, we obtained 2 (range of 1–7) usable blood samples per patient. (B) t-SNE plot of all patient samples at day 0 (n = 83) using phenotypic markers colored by major immune cell populations. Upper right panel: t-SNE plot of healthy samples (n = 11); middle right panel: t-SNE plot of COVID-19-negative samples (n = 6); lower right panel: t-SNE plot of COVID-19-positive samples (n = 66). (C) Immune cell population abundance at day 0 in COVID-19-positive (+), COVID-19-negative (-) patients, and healthy individuals (H). Nominal p values obtained by Wilcoxon Rank Sum Test, followed by Benjamini-Hochberg correction with FDR < 0.1. (D) Correlation between cell population abundance at day 0 and clinical outcomes, e.g., ventilation duration (vent duration) and hospital length of stay (hosp los) for COVID-19-positive patients (n = 65, excluding the patient that is hospitalized for 260 days). Correlation estimates are obtained by Spearman correlation. (E) Protein expression on neutrophils (F) in COVID-19-positive (COV+), COVID-19-negative (COV-) patients, and healthy controls at day 0 (Wilcoxon Rank Sum Test, Benjamini-Hochberg correction with FDR < 0.1). (F) Frequency of monocyte subsets in COVID-19-positive (COV+), COVID-19=negative (COV-) patients, and healthy controls at day 0. Nominal p values obtained by Wilcoxon Rank Sum Test. See also Figure S1.
Figure 2
Figure 2
Early, coordinated, and activated immune cell signaling is associated with early hospital discharge in COVID-19 patients (A) Signaling schematic. Stars denote phosphorylated signaling molecules that are measured in the CyTOF panel. (B) Expression of signaling molecules in CD45+ CD235a/b-negative peripheral blood immune cells at day 0 in COVID-19-positive (+), COVID-19-negative (-) patients, and healthy individuals (H). Nominal p values obtained by Wilcoxon Rank Sum Test, followed by Benjamini-Hochberg correction with FDR < 0.1. (C and D) Correlation between signaling molecule expressions at day 0 for COVID-19+ patients (n = 66) (C) and COVID-19- patients (n = 6) (D). Correlation estimates are obtained by Spearman correlation. (E) Differential expression analysis of signaling molecules at day 0 between COVID-19+ patients that are discharged early (≤ 30 days of admission, n = 59) and late (>30 days after admission, n = 7). Nominal p values obtained by Wilcoxon Rank Sum Test. The log2 fold changes (late versus early) are plotted against the negative log10 (nominal p values). Colors indicate whether signaling molecules are significantly higher in early discharged patients (blue) or late discharged patients (purple) or not differentially expressed (FALSE, gray) after Benjamini-Hochberg correction, FDR < 0.1. (F) Correlation between pSTAT3, pERK, pS6, and pSTAT6 signaling at day 0 and ventilation duration for ventilated COVID-19+ patients (n = 16). Correlation estimates and nominal p values are obtained by Spearman correlation, followed by Benjamini-Hochberg correction. Blue lines and gray shadows represent the best-fitted smooth line and 95% confidence interval. See also Figure S2.
Figure 3
Figure 3
Conserved immunological processes and changes in cell signaling states accompany disease resolution and discharge (A) Illustration of intra-patient analysis from admission to discharge for patients who are successfully discharged from the hospital within 30 days of admission (n = 32). (B) Paired differential abundance analysis of immune cell populations between the first (tp1) and second (tp2) timepoints illustrated in 3A (paired Wilcoxon Rank Sum Test). The log2 fold changes (tp2 versus tp1) are plotted against the negative log10 (nominal p values). Colors indicate if cell populations are significantly down- (blue) or upregulated (purple) from tp1 to tp2 or not differentially expressed (FALSE, gray) after Benjamini-Hochberg correction, FDR < 0.1. (C) Frequency of monocytes, neutrophils, cDC1, and CD8 activated T cells at tp1 and tp2. Lines connect samples from the same patient. Nominal p values obtained by paired Wilcoxon Rank Sum Test. CD8 activated T cells and cDC1 cells are shown as a percentage of parent populations (e.g., CD8 T cells and dendritic cells, respectively), while monocytes and neutrophils are shown as a percentage of all cells. (D) Principal component analysis of significant immune cell subsets in 3B for tp1, tp2, and healthy controls. Immune cell directionality and contribution to PCA space denoted on right (top). Summary ellipsoid of tp1, tp2, and healthy patients in PCA space on right (bottom). (E) Population frequencies of significant immune cell subsets in 3B for tp1, tp2, and healthy controls. Stars indicate median value for each group. Cell populations are highlighted in green if tp2 is closer to healthy than tp1 and highlighted in yellow if tp2 is moving away from healthy. (F and G) Protein expression on CD8- and CD4 activated T cells (F) and on monocyte subsets (G) at tp1 and tp2. Mean protein expression values have been log10 transformed, scaled, and centered on heatmap. Bars indicate mean protein expression across all samples. Only significant proteins are shown (Wilcoxon Rank Sum Test, Benjamini-Hochberg correction with FDR < 0.1). (H) Scatter plots of CD11c and HLA-DR expression on non-classical monocytes in patient 1344 at day 0 (top) and day 7 (bottom). (I) Expression of signaling molecules in significant immune cell subsets in 3B at tp1 and tp2. Median signaling expression values have been centered on heatmap. Only significant signaling molecules are shown (Wilcoxon Rank Sum Test, Benjamini-Hochberg correction with FDR < 0.1 within each cell type). (J) Expression of pTBK1 in CD8 activated T cells, and pSTAT3 expression in CD8 activated T cells and classical monocytes at tp1 and tp2. Lines connect samples from the same patient. Nominal p values obtained by paired Wilcoxon Rank Sum Test. (K) Expression of PD-L1 on non-classical monocytes at tp1 and tp2. Lines connect samples from the same patient. Nominal p values obtained by paired Wilcoxon Rank Sum Test. See also Figure S3.
Figure 4
Figure 4
Immune changes associated with COVID-19 resolution differ in patients who are hospitalized for more than 30 days or die from COVID-19 (A) Illustration of intra-patient analysis of patients who are hospitalized for >30 days (n = 6) and patients who die (n = 5). (B) Median cell population frequencies at tp1 (red) and tp2 (blue) for patients who are discharged ≤ 30 days, >30 days, and deceased. Error bars represent standard errors. (C) Representative scatter plots of activated CD8 T cells (defined by CD38 and HLA-DR expression), at tp1 (left) and tp2 (right) for patients who are discharged ≤ 30 days, >30 days, and deceased. (D) Magnitude of change illustrated by log2FC-log10 (p value) of signaling molecules (identified in Figure 3I) for patients who are discharged within 30 days (≤30 days, green), discharged after 30 days (>30 days, blue), and die (red). Nominal p values obtained by paired Wilcoxon Rank Sum Test. (E and F) Median signaling molecule expression at tp1 (red) and tp2 (blue) for patients who are discharged ≤30 days, >30 days, and deceased. Error bars represent standard errors. (G) Monocyte frequencies (left plots) and CD8 activated pERK expressions (right plots) relative to time to discharge in all samples from patients who are discharged ≤30 days (n = 142 samples) or >30 days (n = 30 samples). Black lines connect samples from the same patient. Blue lines and gray shadows represent the best-fitted smooth line and 95% confidence interval. Dotted lines intersect the x-axis at day 30. See also Figure S4.
Figure 5
Figure 5
Recovery from severe COVID-19 requires core immune resolution features and additional regulatory T cell and basophil upregulation (A) Illustration of intra-patient analysis of ventilated patients. Three timepoints are considered: tp1 (first sample after a patient has been put on a ventilator), tp2 (last sample before the patient is removed from a ventilator), and tp3 (first sample after a patient is successfully removed from ventilation support). (B) Paired differential abundance analysis of immune cell populations between the first (tp1) and third (tp3) timepoints illustrated in 5A (paired Wilcoxon Rank Sum Test). The log2 fold changes (tp3 versus tp1) are plotted against the negative log10 (nominal p values). Colors indicate whether cell populations are significantly down- (blue) or upregulated (purple) from tp1 to tp3 or not differentially expressed (FALSE, gray) after Benjamini-Hochberg correction, FDR < 0.1. (C) Frequency of monocytes, neutrophils, CD4 Treg, and CD8 activated T cells at tp1 and tp3. Lines connect samples from the same patient. Nominal p values obtained by paired Wilcoxon Rank Sum Test. CD8 activated T cells are shown as a percentage of parent population (e.g., CD8 T cells), while monocytes, neutrophils, and CD4 Tregs are shown as a percentage of all cells. (D) Principal component analysis of significant immune cell subsets in 5B for tp1, tp3, and healthy controls. Immune cell directionality and contribution to PCA space denoted on the right. (E) Population frequencies of significant immune cell subsets in 3B for tp1, tp3, and healthy controls. Stars indicate median value for each group. Cell populations are highlighted in green if tp3 is closer to healthy than tp1 and highlighted in yellow if tp3 is moving away from healthy. (F and G) Protein expression on CD8 activated T cells (F) and on monocyte subsets (G) at tp1 and tp3. Mean protein expression values have been log10 transformed, scaled, and centered on heatmap. Bars indicate mean protein expression across all samples. Only significant proteins are shown (Wilcoxon Rank Sum Test, Benjamini-Hochberg correction with FDR < 0.1). (H) Expression of PD-L1 on non-classical monocytes at tp1 and tp3. Lines connect samples from the same patient. Nominal p values obtained by paired Wilcoxon Rank Sum Test. (I) Left: Scatter plots of CD11c and HLA-DR expression on non-classical monocytes in patient 1276 at day 0 (tp1, top) and day 28 (tp3, bottom). Right: Expression of CD64 on non-classical monocytes for patient 1279 from day 0 (tp1) to day 28 (tp3). (J) Expression of signaling molecules in significant immune cell subsets in 5B at tp1 and tp3. Median signaling expression values have been centered on heatmap. Only significant signaling molecules are shown (Wilcoxon Rank Sum Test, Benjamini-Hochberg correction with FDR < 0.1 within each cell type). (K) Expression of pSTAT1 (left) and pCREB (right) in CD4 Tregs at tp1 (blue) and tp3 (orange) for representative patients. (L) Expression of pSTAT1 and pCREB in CD4 Tregs at tp1 and tp3. Lines connect samples from the same patient. Nominal p values obtained by paired Wilcoxon Rank Sum Test. (M) Principal component analysis of significant signaling molecules in 5I for tp1, tp3, and healthy controls. Immune cell directionality and contribution to PCA space denoted on the right. See also Figure S5.
Figure 6
Figure 6
Core immune resolution features define patients with better clinical outcomes at time of admission (A) Illustration of inter-patient analysis of ventilated patients (vent, n = 13) versus patients who are never ventilated (no vent, n = 50). For ventilated patients, the latest sample before the patient is put on a ventilator is used. For non-ventilated patients, day 0 is used. (B) Differential abundance analysis of immune cell populations between ventilated and non-ventilated patients illustrated in 6A (Wilcoxon Rank Sum Test). The log2 fold changes (vent versus no vent) are plotted against the negative log10 (nominal p values). Colors indicate if cell populations are significantly down- (blue) or upregulated (purple) for vent versus no vent or not differentially expressed (FALSE, gray) after Benjamini-Hochberg correction, FDR < 0.1. (C) Frequency of monocytes, neutrophils, CD4 Tregs, and CD8 EM3 T cells in vent and no vent patients. Nominal p values obtained by Wilcoxon Rank Sum Test. CD8 EM3 T cells parent population (e.g., CD8 T cells), while monocytes, neutrophils, and CD4 Tregs are shown as a percentage of all cells. (D) Monocyte (left plots) and neutrophil (right plots) frequencies relative to intubation/extubation in all samples from ventilated patients. Black lines connect samples from the same patient. Blue lines and gray shadows represent the best-fitted smooth line and 95% confidence interval. Dotted lines intersect the x axis at day of intubation or extubation. (E) Expression of pSTAT3 and pPLCg2 in basophils in non-ventilated and ventilated patients as well as healthy individuals. Nominal p values obtained by Wilcoxon Rank Sum Test. (F) Expression of pSTAT5 in CD4 Tregs relative to intubation or extubation in all samples from ventilated patients. G) Graphical summary depicting the trajectories of key immune features involved in COVID-19 resolution and ventilation recovery. See also Figure S6.

Update of

References

    1. Allen B.M., Hiam K.J., Burnett C.E., Venida A., DeBarge R., Tenvooren I., Marquez D.M., Cho N.W., Carmi Y., Spitzer M.H. Systemic dysfunction and plasticity of the immune macroenvironment in cancer models. Nat. Med. 2020;26:1125–1134. - PMC - PubMed
    1. Angus D.C., Derde L., Al-Beidh F., Annane D., Arabi Y., Beane A., van Bentum-Puijk W., Berry L., Bhimani Z., Bonten M., et al. Effect of hydrocortisone on mortality and organ support in patients with severe COVID-19: the REMAP-CAP COVID-19 corticosteroid domain randomized clinical trial. JAMA: the journal of the American Medical Association. 2020;324:1317–1329. - PMC - PubMed
    1. Asano T., Boisson B., Onodi F., Matuozzo D., Moncada-Velez M., Maglorius Renkilaraj M.R.L., Zhang P., Meertens L., Bolze A., Materna M., et al. X-linked recessive TLR7 deficiency in ∼1% of men under 60 years old with life-threatening COVID-19. Sci. Immunol. 2021;6:eabl4348. doi: 10.1126/sciimmunol.abl4348. - DOI - PMC - PubMed
    1. Bange E.M., Han N.A., Wileyto P., Kim J.Y., Gouma S., Robinson J., Greenplate A.R., Hwee M.A., Porterfield F., Owoyemi O., et al. CD8+ T cells contribute to survival in patients with COVID-19 and hematologic cancer. Nat. Med. 2021;27:1280–1289. - PMC - PubMed
    1. Centers for Disease Control and Prevention CDC COVID data tracker, trends in number of COVID-19 cases and deaths in the US reported to CDC, by State/Territory. Available at: 2021. https://covid.cdc.gov/covid-data-tracker/#trends_dailydeaths

Publication types