

Changes in life expectancy and disease burden in Norway, 1990-2019: an analysis of the Global Burden of Disease Study 2019
- PMID: 35779543
- PMCID: PMC9253891
- DOI: 10.1016/S2468-2667(22)00092-5
Changes in life expectancy and disease burden in Norway, 1990-2019: an analysis of the Global Burden of Disease Study 2019
Abstract
Background: Geographical differences in health outcomes are reported in many countries. Norway has led an active policy aiming for regional balance since the 1970s. Using data from the Global Burden of Disease Study (GBD) 2019, we examined regional differences in development and current state of health across Norwegian counties.
Methods: Data for life expectancy, healthy life expectancy (HALE), years of life lost (YLLs), years lived with disability (YLDs), and disability-adjusted life-years (DALYs) in Norway and its 11 counties from 1990 to 2019 were extracted from GBD 2019. County-specific contributors to changes in life expectancy were compared. Inequality in disease burden was examined by use of the Gini coefficient.
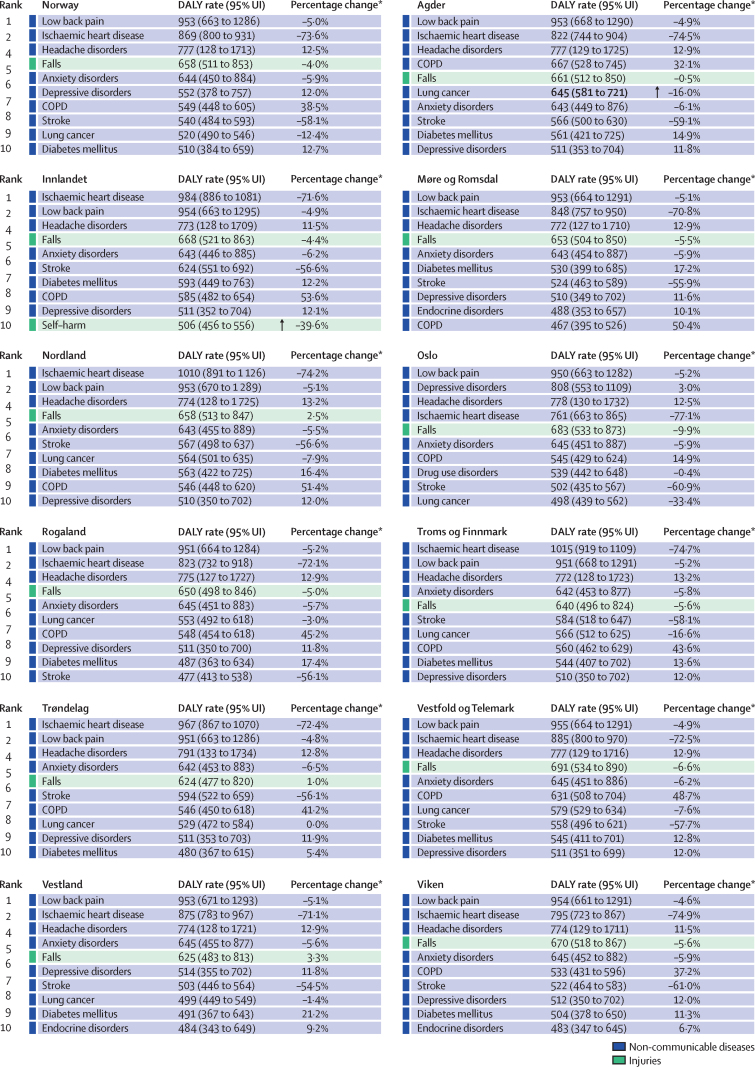
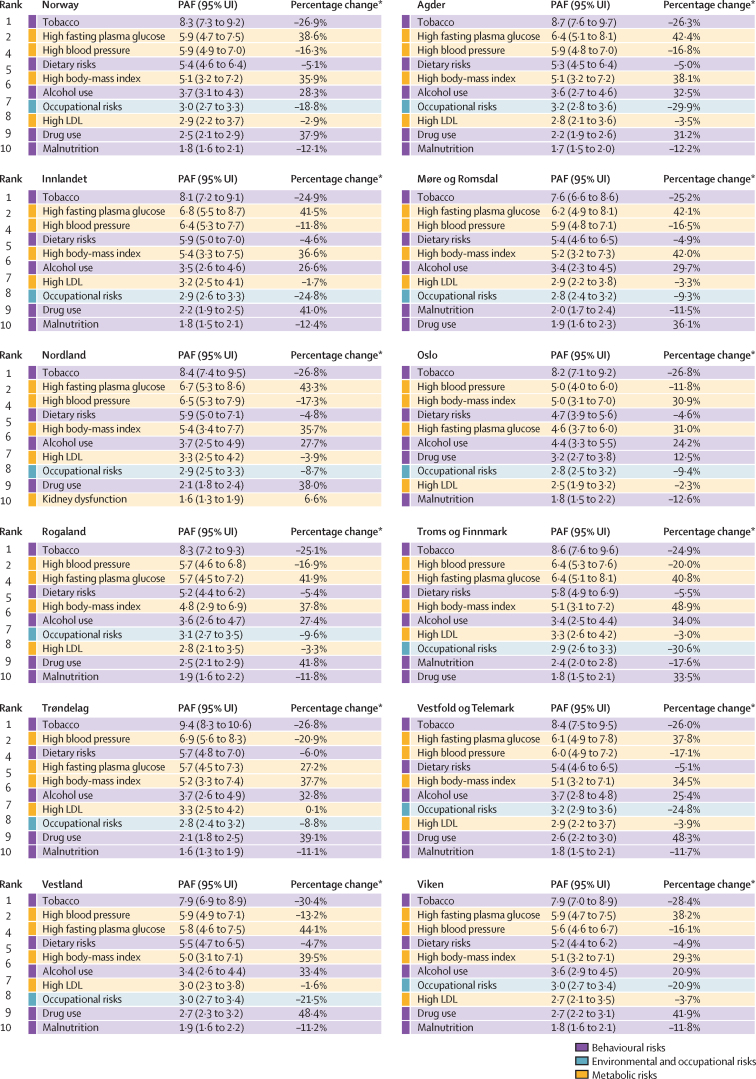
Findings: Life expectancy and HALE improved in all Norwegian counties from 1990 to 2019. Improvements in life expectancy and HALE were greatest in the two counties with the lowest values in 1990: Oslo, in which life expectancy and HALE increased from 71·9 years (95% uncertainty interval 71·4-72·4) and 63·0 years (60·5-65·4) in 1990 to 81·3 years (80·0-82·7) and 70·6 years (67·4-73·6) in 2019, respectively; and Troms og Finnmark, in which life expectancy and HALE increased from 71·9 years (71·5-72·4) and 63·5 years (60·9-65·6) in 1990 to 80·3 years (79·4-81·2) and 70·0 years (66·8-72·2) in 2019, respectively. Increased life expectancy was mainly due to reductions in cardiovascular disease, neoplasms, and respiratory infections. No significant differences between the national YLD or DALY rates and the corresponding age-standardised rates were reported in any of the counties in 2019; however, Troms og Finnmark had a higher age-standardised YLL rate than the national rate (8394 per 100 000 [95% UI 7801-8944] vs 7536 per 100 000 [7391-7691]). Low inequality between counties was shown for life expectancy, HALE, all level-1 causes of DALYs, and exposure to level-1 risk factors.
Interpretation: Over the past 30 years, Norway has reduced inequality in disease burden between counties. However, inequalities still exist at a within-county level and along other sociodemographic gradients. Because of insufficient Norwegian primary data, there remains substantial uncertainty associated with regional estimates for non-fatal disease burden and exposure to risk factors.
Funding: Bill & Melinda Gates Foundation, Research Council of Norway, and Norwegian Institute of Public Health.
Copyright © 2022 The Author(s). Published by Elsevier Ltd. This is an Open Access article under the CC BY 4.0 license. Published by Elsevier Ltd.. All rights reserved.
Conflict of interest statement
Declaration of interests We declare no competing interests.
Figures


References
-
- GBD 2019 Demographics Collaborators Global age-sex-specific fertility, mortality, healthy life expectancy (HALE), and population estimates in 204 countries and territories, 1950–2019: a comprehensive demographic analysis for the Global Burden of Disease Study 2019. Lancet. 2020;396:1160–1203. - PMC - PubMed
-
- Statistics Norway General government revenue and expenditure. 2021. https://www.ssb.no/en/offentlig-sektor/offentlig-forvaltning/statistikk/...
-
- The World Bank Gini index (World Bank estimate)—Norway. 2017. https://data.worldbank.org/indicator/SI.POV.GINI?locations=NO
Publication types
MeSH terms
LinkOut - more resources
Full Text Sources
Miscellaneous
