. 2022 Jul 2;14(15):5966-5983.
doi: 10.18632/aging.204153. Epub 2022 Jul 2.

mtDNA variability determines spontaneous joint aging damage in a conplastic mouse model

Affiliations

mtDNA variability determines spontaneous joint aging damage in a conplastic mouse model

Morena Scotece et al. Aging (Albany NY). .

Abstract

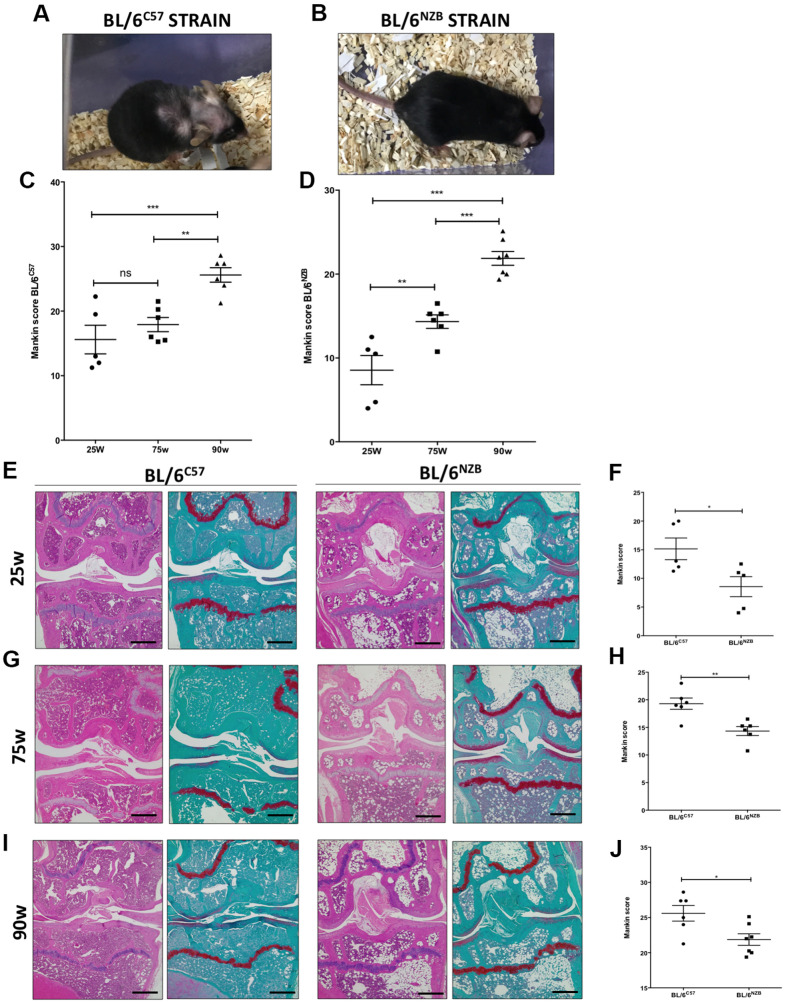
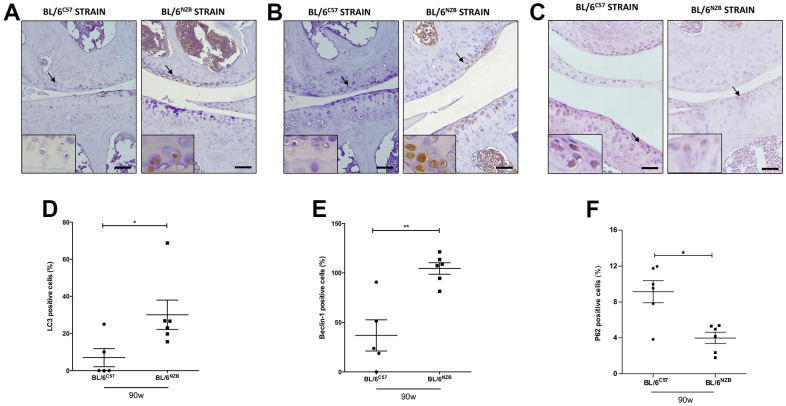
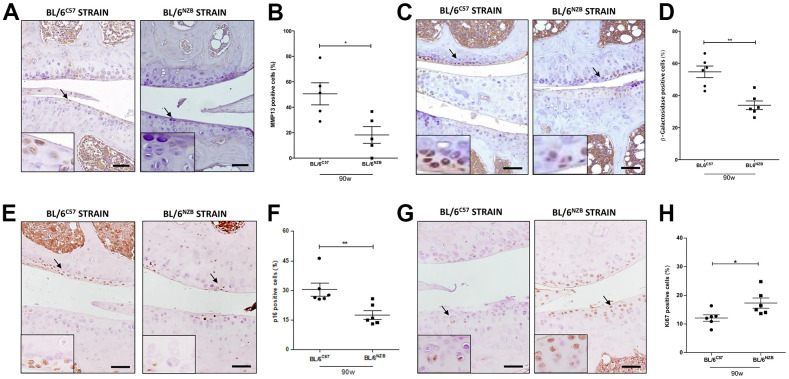
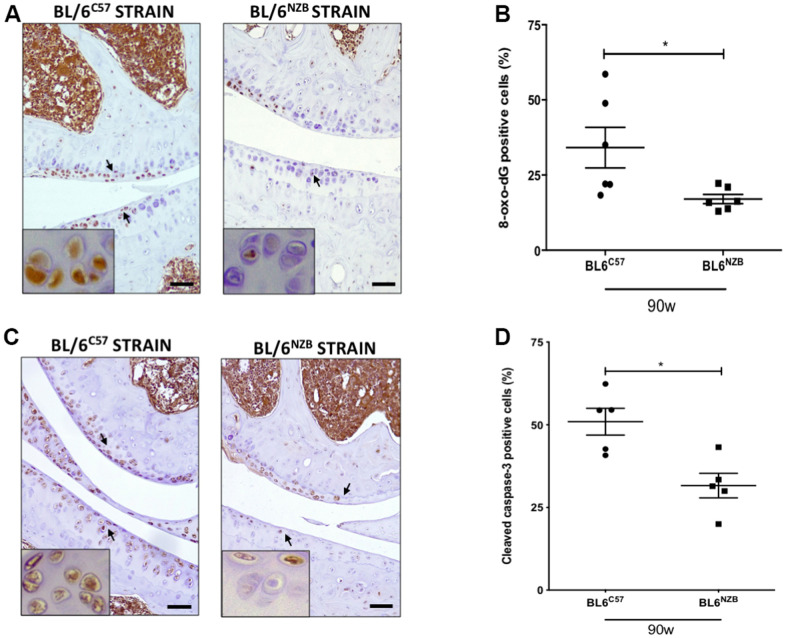
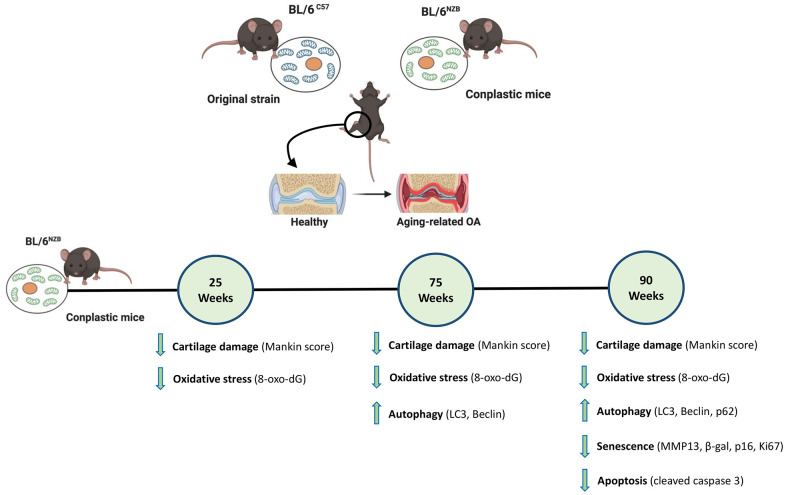
Mitochondria and mtDNA variations contribute to specific aspects of the aging process. Here, we aimed to investigate the influence of mtDNA variation on joint damage in a model of aging using conplastic mice. A conplastic (BL/6NZB) mouse strain was developed with the C57BL/6JOlaHsd nuclear genome and NZB/OlaHsd mtDNA, for comparison with the original C57BL/6JOlaHsd strain (BL/6C57). Conplastic (BL/6NZB) and BL/6C57 mice were sacrificed at 25, 75, and 90 weeks of age. Hind knee joints were processed for histological analysis and joint pathology graded using the Mankin scoring system. By immunohistochemistry, cartilage expression of markers of autophagy (LC3, Beclin-1, and P62) and markers of senescence (MMP13, beta-Galactosidase, and p16) and proliferation (Ki67) were analyzed. We also measured the expression of 8-oxo-dG and cleaved caspase-3. Conplastic (BL/6NZB) mice presented lower Mankin scores at 25, 75, and 90 weeks of age, higher expression of LC3 and Beclin-1 and lower of P62 in cartilage than the original strain. Moreover, the downregulation of MMP13, beta-Galactosidase, and p16 was detected in cartilage from conplastic (BL/6NZB) mice, whereas higher Ki67 levels were detected in these mice. Finally, control BL/6C57 mice showed higher cartilage expression of 8-oxo-dG and cleaved caspase-3 than conplastic (BL/6NZB) mice. This study demonstrates that mtDNA genetic manipulation ameliorates joint aging damage in a conplastic mouse model, suggesting that mtDNA variability is a prognostic factor for aging-related osteoarthritis (OA) and that modulation of mitochondrial oxidative phosphorylation (OXPHOS) could be a novel therapeutic target for treating OA associated with aging.

Keywords: autophagy; conplastic mice; mtDNA; oxidative stress; senescence.


Conflict of interest statement

CONFLICTS OF INTEREST: The authors declare no conflicts of interest.

Figures

Figure 1
Figure 1
Analysis of Mankin scores in joints from BL/6C57 and conplastic (BL/6NZB) mice during the aging process. (A) Representative image of 90-weeks-old BL/6C57 mice. (C) Quantification of total Mankin score of the joint sections from BL/6C57 mice. (B) Representative image of 90-weeks-old conplastic (BL/6NZB) mice. (D) Quantification of total Mankin score of the joint sections from conplastic (BL/6NZB) mice. Total Mankin score was obtained from the scores of all quadrants of the joint (medial tibial plateau, medial femoral condyle, lateral tibial plateau, and lateral femoral condyle) that were scored separately and averaged. Three criteria were selected for histological assessment of each quadrant: structure, cellularity, and matrix staining. Graphs represent means ± SEM; n=5 in BL/6C57 and conplastic (BL/6NZB) mice at 25 weeks; n=6 in BL/6C57 and BL/6NZB at 75 weeks; n=6 in BL/6C57 and n=7 in BL/6NZB at 90 weeks. **p<0.01; ***p<0.001; ns=not significant by non-parametric Mann-Whitney test. (E) Representative images from joint sections of BL/6C57 and conplastic (BL/6NZB) mice at 25 weeks of age, stained with Hematoxylin-Eosin and Safranin O/Fast Green. (F) Quantification of total Mankin score of the joint sections from BL/6C57 vs. conplastic (BL/6NZB) mice at 25 weeks. (G) Representative images from joint sections of BL/6C57 and conplastic (BL/6NZB) mice at 75 weeks of age, stained with Hematoxylin-Eosin and Safranin O/Fast Green. (H) Quantification of total Mankin score of the joint sections from BL/6C57 vs. conplastic (BL/6NZB) mice at 75 weeks. (I) Representative images from joint sections of BL/6C57 and conplastic (BL/6NZB) mice at 90 weeks of age, stained with Hematoxylin-Eosin and Safranin O/Fast Green. (J) Quantification of total Mankin score of the joint sections from BL/6C57 vs. conplastic (BL/6NZB) mice at 90 weeks. Original magnification: 4×. Scale bar, 500 μm. Graphs represent means ± SEM; n=5 in BL/6C57 and conplastic (BL/6NZB) mice at 25 weeks; n=6 in BL/6C57 and conplastic (BL/6NZB) mice at 75 weeks; n=6 in BL/6C57 and n=7 in conplastic (BL/6NZB) mice at 90 weeks. *p<0.05; **p<0.01 vs. BL/6C57 by non-parametric Mann-Whitney test.
Figure 2
Figure 2
Immunohistochemistry for markers of autophagy on mouse knee joint sections. Representative images of medial compartment of knee joints from BL/6C57 and conplastic (BL/6NZB) mice at 90 weeks of age stained with LC3 (A), Beclin-1 (B) and P62 (C). Quantitative analysis of LC3-positive cells (D), Beclin-1-positive cells (E), and P62-positive cells (F) of knee joints from BL/6C57 and conplastic (BL/6NZB) mice at 90 weeks. Original magnification: 20×. Scale bar, 50 μm. Black arrow indicates positively stained chondrocyte. Chondrocyte magnification (40×) is shown in the bottom-left corner of the images. Graphs represent means ± SEM; n=5 in BL/6C57 and n=6 conplastic (BL/6NZB) mice for LC3 and Beclin-1, and n=6 in BL/6C57 and n=6 conplastic (BL/6NZB) mice for P62. *p<0.05; **p<0.01 by non-parametric Mann-Whitney test.
Figure 3
Figure 3
Age-associated changes in cartilage expression of senescence and proliferation markers in BL/6C57 and conplastic (BL/6NZB) mice. (A) Representative images of medial compartment of knee joints from BL/6C57 and conplastic (BL/6NZB) mice at 90 weeks of age stained with matrix metalloproteinase 13 (MMP13). (B) Quantitative analysis of MMP13-positive cells of knee joints from BL/6C57 and conplastic (BL/6NZB) mice at 90 weeks of age. (C) Representative images of medial compartment of knee joints from BL/6C57 and conplastic (BL/6NZB) mice at 90 weeks of age stained with β-Galactosidase. (D) Quantitative analysis of β-Galactosidase-positive cells of knee joints from BL/6C57 and conplastic (BL/6NZB) mice at 90 weeks of age. (E) Representative images of medial compartment of knee joints from BL/6C57 and conplastic (BL/6NZB) mice at 90 weeks of age stained with p16. (F) Quantitative analysis of p16-positive cells of knee joints from BL/6C57 and conplastic (BL/6NZB) mice at 90 weeks of age. (G) Representative images of medial compartment of knee joints from BL/6C57 and conplastic (BL/6NZB) mice at 90 weeks of age stained with Ki67. (H) Quantitative analysis of Ki67-positive cells of knee joints from BL/6C57 and conplastic (BL/6NZB) mice at 90 weeks of age. Original magnification: 20×. Scale bar, 50 μm. Black arrow indicates positively stained chondrocyte. Chondrocyte magnification (40×) is shown in the bottom-left corner of the images. Graphs represent means ± SEM; n=5 in BL/6C57 and n=5 in conplastic (BL/6NZB) mice at 90 weeks of age for MMP13, and n=6 in BL/6C57 and n=6 in conplastic (BL/6NZB) mice at 90 weeks of age for β-Galactosidase, p16, and Ki67. *p<0.05, * *p<0.01 by non-parametric Mann-Whitney test.
Figure 4
Figure 4
Reduction of 8-oxo-dG and cleaved caspase-3 expression in cartilage from conplastic (BL/6NZB) mice. (A) Representative images of medial compartment of knee joints from BL/6C57 and conplastic (BL/6NZB) mice at 90 weeks of age stained with 8-oxo-2′-deoxyguanosine (8-oxo-dG). (B) Quantitative analysis of 8-oxo-dG-positive cells of knee joints from BL/6C57 and conplastic (BL/6NZB) mice at 90 weeks. (C) Representative images of medial compartment of knee joints from BL/6C57 and conplastic (BL/6NZB) mice at 90 weeks of age stained with cleaved caspase-3. (D) Quantitative analysis of cleaved caspase-3-positive cells of knee joints from BL/6C57 and conplastic (BL/6NZB) mice at 90 weeks of age. Original magnification: 20×. Scale bar, 50 μm. Black arrow indicates positively stained chondrocyte. Chondrocyte magnification (40×) is shown in the bottom-left corner of the images. 8-oxo-dG: Graphs represent means ± SEM; n=6 in BL/6C57 and n=6 in conplastic (BL/6NZB) mice at 90 weeks of age. Cleaved caspase-3: Graphs represent means ± SEM; n=5 in BL/6C57 and n=5 in conplastic (BL/6NZB) mice at 90 weeks of age; *p<0.05 by non-parametric Mann-Whitney test.
Figure 5
Figure 5
Schematic representation of the joint aging model in conplastic (BL/6NZB) mice and the original strain BL/6C57. 8-oxo-2′-deoxyguanosine (8-oxo-dG); Cleaved caspase-3 (CC3); Matrix metalloproteinase 13 (MMP13). Created with BioRender.com.

Similar articles

Cited by

References

    1. López-Otín C, Blasco MA, Partridge L, Serrano M, Kroemer G. The hallmarks of aging. Cell. 2013; 153:1194–217. 10.1016/j.cell.2013.05.039 - DOI - PMC - PubMed
    1. Lotz MK, Caramés B. Autophagy and cartilage homeostasis mechanisms in joint health, aging and OA. Nat Rev Rheumatol. 2011; 7:579–87. 10.1038/nrrheum.2011.109 - DOI - PMC - PubMed
    1. Horton WE Jr, Bennion P, Yang L. Cellular, molecular, and matrix changes in cartilage during aging and osteoarthritis. J Musculoskelet Neuronal Interact. 2006; 6:379–81. - PubMed
    1. Sun N, Youle RJ, Finkel T. The Mitochondrial Basis of Aging. Mol Cell. 2016; 61:654–66. 10.1016/j.molcel.2016.01.028 - DOI - PMC - PubMed
    1. D’Aquila P, Rose G, Panno ML, Passarino G, Bellizzi D. SIRT3 gene expression: a link between inherited mitochondrial DNA variants and oxidative stress. Gene. 2012; 497:323–9. 10.1016/j.gene.2012.01.042 - DOI - PubMed

Publication types