. 2022 Aug:111:226-244.
doi: 10.1016/j.matbio.2022.06.008. Epub 2022 Jun 30.

Collagen VII maintains proteostasis in dermal fibroblasts by scaffolding TANGO1 cargo

Affiliations

Collagen VII maintains proteostasis in dermal fibroblasts by scaffolding TANGO1 cargo

Qingqing Cao et al. Matrix Biol. 2022 Aug.

Abstract

Lack of type VII collagen (C7) disrupts cellular proteostasis yet the mechanism remains undescribed. By studying the relationship between C7 and the extracellular matrix (ECM)-associated proteins thrombospondin-1 (TSP1), type XII collagen (C12) and tissue transglutaminase (TGM2) in primary human dermal fibroblasts from multiple donors with or without the genetic disease recessive dystrophic epidermolysis bullosa (RDEB) (n=31), we demonstrate that secretion of each of these proteins is increased in the presence of C7. In dermal fibroblasts isolated from patients with RDEB, where C7 is absent or defective, association with the COPII outer coat protein SEC31 and ultimately secretion of each of these ECM-associated proteins is reduced and intracellular levels are increased. In RDEB fibroblasts, overall collagen secretion (as determined by the levels of hydroxyproline in the media) is unchanged while traffic from the ER to Golgi of TSP1, C12 and TGM2 occurs in a type I collagen (C1) dependent manner. In normal fibroblasts association of TSP1, C12 and TGM2 with the ER exit site transmembrane protein Transport ANd Golgi Organization-1 (TANGO1) as determined by proximity ligation assays, requires C7. In the absence of wild-type C7, or when ECM-associated proteins are overexpressed, C1 proximity and intracellular levels increase resulting in elevated cellular stress responses and elevated TGFβ signaling. Collectively, these data demonstrate a role for C7 in loading COPII vesicle cargo and provides a mechanism for disrupted proteostasis, elevated cellular stress and increased TGFβ signaling in patients with RDEB. Furthermore, our data point to a threshold of cargo loading that can be exceeded with increased protein levels leading to pathological outcomes in otherwise normal cells.

Keywords: Collagen VII; ER stress; TANGO1; and TGFβ signaling; recessive dystrophic epidermolysis bullosa; thrombospondin.


Conflict of interest statement

Competing Interest Statement A.P.S. holds stock in Krystal Biotech Inc. and consults for and has ownership interests in Zikani Therapeutics.

Figures
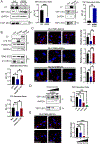
Figure 1.
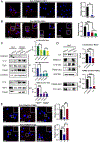
Figure 1.. Wild-type C7 directs ECM-associated protein secretion.
(A). Left: Immunoblot of type VII collagen (C7), and TSP1 from total cell lysates (intracellular; IC) and conditioned media (extracellular; EC) from primary normal human fibroblasts (NHF) and primary RDEB patient fibroblasts (RDEBF). Quantification graph showing ratios of extracellular to intracellular TSP1 densitometry relative to GAPDH from 2 separate primary fibroblast populations. Mean ± SEM from replicate experiments (n=3), ***: p<0.001. Right: Immunoblot of intracellular and extracellular TSP1 from NHF and RDEBF with recombinant wild-type C7 expression. Graph shows densitometry ratios of extracellular to intracellular TSP1 from immunoblot quantification. Mean ± SEM from replicate experiments (n=3), **: p<0.01. (B). Immunoblot of C7, type XII collagen (C12) and transglutaminase 2 (TGM2) from cell lysate (IC) and conditioned media (EC) from NHF, RDEBF and RDEBF expressing recombinant wild-type C7. Quantification graphs showing ratios of extracellular to intracellular TGM2 and C12 densitometry relative to GAPDH. Mean ± SEM from replicate experiments (n=3), *, p<0.05, **, p<0.01 (C). Proximity Ligation Assay (PLA) between TSP1/SEC31, TGM2/SEC31 and C12/SEC31. 30 cells were counted in each experiment. Scale bar: 20μm. Graphs show mean ± SEM from replicate experiments (n=3), *: p<0.05, **: p < 0.01, ***: p<0.001, ****, p<0.0001. (D) Immunoblot of intra- and extra-cellular TSP1 of RDEBF from three different patients with increasing disease severity (see Table 1 for full details). Samples were run on the same blot as 1A and quantified relative to NHF. Quantification graph showing ratios of extracellular to intracellular TSP1. Mean ± SEM from replicate experiments (n=3), *: p<0.05, **: p < 0.01, ***: p<0.001. (E). Left: PLA between TSP1 and SEC31 measured in primary NHF and three RDEB patient fibroblasts with different mutations and disease severity: top panels show NHF and generalized (intermediate) RDEB while bottom panels show severe generalized RDEB (see Table 1 for full details). 20 cells were counted in each experiment. Scale bar: 20 μm. Data are shown as mean ± SEM from replicate experiments (n=3). **: p < 0.01, ***: p<0.001, ****, p<0.0001.
Figure 2.
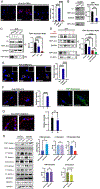
Figure 2.. TANGO1 facilitates ECM-associated protein secretion in the presence of wild-type C7.
(A) PLA showing proximity between TSP1 and TANGO1 in primary NHF and RDEBF from two separate donors. Scale bar: 20 μm. Quantification graph shows mean ± SEM signal intensity, 30 cells were counted from each replicate experiment (n=3), **: p<0.01. (B) PLA showing proximity between TSP1 and SEC31 in primary normal and RDEB fibroblast populations with siRNA against TANGO1 (siTANGO1) or scrambled siRNA (siMock). Scale bar: 20 μm. Graph shows mean± SEM signal intensity from 30 cells counted from replicate experiments (n=3), **: p < 0.01, ***: p<0.001 ns: not significant. (C): Immunoblot of TANGO1, C12, TSP1 and TGM2 from total cell lysates (IC) and conditioned media (EC) from primary NHF and RDEBF populations treated with siMock or siTANGO1. Graph showing C12, TSP1 and TGM2 secretion levels measured by immunoblot quantification of C12 (cell media)/C12 (cell lysate), TSP1 (cell media)/TSP1 (cell lysate) and TGM2 (cell media)/TGM2 (cell lysate), with mean ± SEM from replicate experiments (n=2). **: p<0.01, ****: p<0.0001, ns: not significant. (D) Immunoblot of C7, TANGO1 from total cell lysate as well as C12 and TGM2 from total cell lysates (IC) and conditioned media (EC) isolated from NHF treated with siMock, C7 siRNA (siC7) or siTANGO1. Graphs show C12 and TGM2 secretion levels measured by immunoblot quantification of C12 (cell media)/C12 (cell lysate) and TGM2 (cell media)/TGM2 (cell lysate), with mean ± SEM from replicate experiments (n=3). *: p<0.05, ***: p<0.001. (E) PLA showing proximity between TGM2 and TANGO1, as well as C12 and TANGO1 in primary NHF, RDEBF and RDEBF overexpressing C7. Scale bar: 20 μm. Quantification graph shows mean ± SEM signal intensity of 30 cells from each replicate experiment (n=3), *: p<0.05, **: p<0.01, ***: p<0.001.
Figure 3.
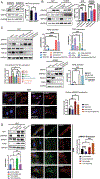
Figure 3.. TSP1 secretion is associated with type I collagen when C7 is absent or when TSP1 is ectopically expressed.
(A) Left: PLA showing proximity between TSP1 and C1 in primary NHF and RDEBF with or without recombinant C7 expression. Scale bar: 20 μm. Right: Graph shows mean ± SEM signal intensity, 30 cells were counted from each replicate experiment (n=3), ****: p<0.0001. (B) Left: Immunoblot of C1, and TSP1 from total cell lysates (IC) and conditioned media (EC) from primary RDEBF treated with scramble siRNA (siMock) or C1 siRNA (siC1). Right: Graph shows TSP1 secretion levels measured by immunoblot quantification of TSP1 (cell media)/TSP1 (cell lysate), with mean ± SEM from replicate experiments (n=3). ***: p<0.001. (C) Left: Immunoblot of C1 and C7 from total cell lysate as well as TSP1 from total cell lysates (IC) and conditioned media (EC) isolated from NHF treated with siMock, siC1 or C7 siRNA (siC7). Right: Graph shows TSP1 secretion levels measured by immunoblot quantification of TSP1 (cell media)/TSP1 (cell lysate), with mean ± SEM from replicate experiments (n=2). ***: p<0.001, ****: p<0.0001. (D) Left: Immunoblot of C1 from conditioned media and TANGO1 from total cell lysate as well as TSP1 from total cell lysates (IC) and conditioned media (EC) isolated from NHF treated with siMock (first column), siC1, TANGO1 siRNA (siTANGO1) or combination of both siC1 and siTANGO1. Right: Graph shows TSP1 secretion levels measured by immunoblot quantification of TSP1 (cell media)/TSP1 (cell lysate), with mean ± SEM from replicate experiments (n=3). *: p<0.05, **: p<0.01, ****: p<0.0001. (E) Left: PLA showing proximity between TGM2 and C1 in primary NHF, RDEBF and RDEBF with recombinant C7 expression. Scale bar: 20 μm. Right: Graph shows mean ± SEM signal intensity, 30 cells were counted from each replicate experiment (n=3), ****: p<0.0001. (F) Left: PLA showing proximity between TSP1 and C1 in primary NHF transiently transfected with an empty vector (NHF+Mock) or CMV-driven TSP1 vector (NHF+TSP1). Scale bar: 20 μm. Graph shows mean ± SEM PLA signal intensity, 30 cells were counted from each replicate experiment (n=3), ****: p<0.0001. Right: Immunostaining with anti-TSP1 antibody confirms transfection of TSP1. Scale bar: 20 μm. (G) Left: PLA between TSP1 and TANGO1 in NHF transiently transfected by empty vector (NHF+Mock) or CMV-driven TSP1 vector (NHF+TSP1). Scale bar: 20 μm. Right: Graph shows mean ± SEM PLA signal intensity, 30 cells were counted from each replicate experiment (n=3), ns: not significant. (H). Left: Immunoblot of TSP1, C7, C12 and C1 from both IC and EC, pSMAD3 and SMAD3 from IC after being transiently transfected with empty plasmid (pUC19) or TSP1 containing pUC19 vector (TSP1). GAPDH serves as loading control. Right: Graphs show mean ± SEM of TGFβ activation by quantifying the ratio of pSMAD3/SMAD3, and the secretion levels of TSP1, C7, C12 and C1 calculated by IC/EC ratios from replicate experiments (n=3). *: p<0.05; ns: not significant.
Figure 4.
Figure 4.. Binding between C7 and TSP1 promotes TSP1 secretion.
(A) Schematic showing the structure of full-length C7 and TSP1. The reported TSP1 binding domains (FN6FN7) are indicated by the red rectangle. (B) Co-immunoprecipitation pulling down proteins using FLAG-tagged C7 demonstrating binding TSP1/C7 and TANGO1/C7. Proteins were detected by immunoblot with indicated antibodies. 5% of the total lysate was used for input and GAPDH was used for loading control. (C) Left: PLA between TSP1 and SEC31 measured in RDEBF after expression of recombinant wild-type C7, mutant C7 (ΔFN6FN7) or antisense C7 (control). Scale bars: 20 μm. Right: Graph shows mean § SEM PLA signal intensity, 30 cells were counted from each replicate experiment (n=3), ****: p<0.0001, ns: not significant. (D) Left: Immunoblot of C7 and p-SMAD3 from total cell lysate, and TSP1 from total cell lysates (IC) and conditioned media (EC) from primary RDEBF after expression of antisense C7, recombinant wild-type C7, or mutant C7. Right: Graph shows mean ± SEM p-SMAD3 densitometry normalized to GAPDH from replicate experiments (n=3), *: p<0.05, ns: not significant.
Figure 5.
Figure 5.. Intracellular TSP1 increases TGFβ signaling and ER-stress in dermal fibroblasts.
(A) Immunoblot of TSP1 and GRP78 from total cell lysate isolated from two primary RDEBF populations treated with scrambled control (siMock) or TSP1 siRNA (siTSP1). Graph shows mean ± SEM GRP78 densitometry normalized to GAPDH from replicate experiments (n=3), *: p<0.05. (B) Left: Immunoblot of GRP78, total SMAD3 and p-SMAD3 from total cell lysate isolated from primary NHF and RDEBF populations treated with DMSO (control), 0.5μM Thapsigargin or 5μg/ml Tunicamycin. Right: Graph shows mean ± SEM p-SMAD3 densitometry normalized to total SMAD3 from replicate experiments (n=3), *: p<0.05, **: p<0.01. (C). Upper row: Immunoblot showing total lysate levels of GRP78, pSMAD3, SMAD3 and TGFβ in NHF treated by DMSO, TGFβ recombinant protein, SB431542, TGFβ recombinant protein + SB431542, Tunicamycin, Tunicamycin + SB431542. Graphs show mean ± SEM p-SMAD3 relative to total SMAD3, TGFβ expression relative to GAPDH from replicate experiments (n=3), *: p<0.05, ***, p<0.001, ****, p<0.0001. Middle row: ELISA showing TGF-β1 secretion, DMEM serves as the baseline control (left graph). *: p<0.05, **: p<0.01. Immunoblot (middle) showing GRP78, pSMAD3, SMAD3 and TGFβ in RDEBF treated by DMSO. SB431542, Tunicamycin and Tunicamycin + SB431542. Graph (right) shows mean ± SEM p-SMAD3 relative to total SMAD3 from immunoblot. ***, p<0.001. Bottom row: Confocal images showing DAPI (blue) and pSMAD3 (red) in NHF treated with DMSO, SB431542 and SB431542+Tunicamycin. Scale bars: 10 μm. Quantification graph shows mean ± SEM nuclear signal intensity from 20 cells imaged in each replicate experiment (n=3), *: p<0.05, ns: not significant. (D). Left: Immunoblot showing TSP1, pSMAD3, SMAD3 and TGFβ expression in NHF from total lysate after transfection with empty vector (PUC19), PUC19 + SB435142, TSP1 vector and TSP1 + SB431542. Graph below shows mean ± SEM of pSMAD3 relative to SMAD3 from replicate experiments (n=3). *: p<0.05, **: p<0.01. Bottom row: Confocal images (middle) showing TSP1 (green) and pSMAD3 (red) in NHF transiently transfected with empty vector and treated with DMSO (Control+DMSO) or SB431542 (Control+ SB431542), and NHF transiently transfected with TSP1 and treated with DMSO (TSP1+DMSO) or SB431542 (TSP1+SB431542). Quantification graph (right) shows mean ± SEM nuclear signal intensity from 20 cells imaged in each replicate experiment (n=3) *: p<0.05, ***, p<0.001, ****, p<0.0001.
Figure 6.
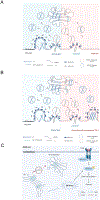
Figure 6.. Model of ECM-associated protein secretion and intracellular accumulation in dermal fibroblasts.
(A) In normal dermal fibroblasts, C7 acts as a scaffold to load the ECM-associated proteins TSP1, TGM2 and C12 via TANGO1–dependent carriers (left panel) while in RDEB dermal fibroblasts, where full length wild-type C7 is absent, ECM-associated proteins are trafficked through an alternate pathway associated with close proximity to C1 via TANGO1-independent carriers (right panel). (B) In normal cells when ECM-associated proteins increase to levels where the TANGO1-C7-TSP1 loading of TANGO1-dependent carriers is saturated, excess TSP1 traffics through an alternate, C1 associated pathway. (C) In situations where TSP1 is increased, intracellular TSP1 saturates both TANGO1 and C1-associated secretory pathways leading to increased ER stress and increased TGFβ signaling.

Similar articles

Cited by

References

    1. Christiano AM, Anhalt G, Gibbons S, Bauer EA, Uitto J, Premature termination codons in the type VII collagen gene (COL7A1) underlie severe, mutilating recessive dystrophic epidermolysis bullosa, Genomics 21 (1) (1994) 160–168. - PubMed
    1. Fine JD, Bruckner-Tuderman L, Eady RA, Bauer EA, Bauer JW, Has C, Heagerty A, Hintner H, Hovnanian A, Jonkman MF, Leigh I, Marinkovich MP, Martinez AE, McGrath JA, Mellerio JE, Moss C, Murrell DF, Shimizu H, Uitto J, Woodley D, Zambruno G, Inherited epidermolysis bullosa: updated recommendations on diagnosis and classification, J Am Acad Dermatol 70 (6) (2014) 1103–1126. - PubMed
    1. Fine JD, Johnson LB, Weiner M, Li KP, Suchindran C, Epidermolysis bullosa and the risk of life-threatening cancers: the National EB Registry experience, 1986-2006, J Am Acad Dermatol 60 (2) (2009) 203–211. - PubMed
    1. Burgeson RE, Type VII collagen, anchoring fibrils, and epidermolysis bullosa, J Invest Dermatol 101 (3) (1993) 252–255. - PubMed
    1. Atanasova VS, Russell RJ, Webster TG, Cao Q, Agarwal P, Lim YZ, Krishnan S, Fuentes I, Guttmann-Gruber C, McGrath JA, Salas-Alanis JC, Fertala A, South AP, Thrombospondin-1 Is a Major Activator of TGF-beta Signaling in Recessive Dystrophic Epidermolysis Bullosa Fibroblasts, J Invest Dermatol 139 (7) (2019) 1497–1505 e5. - PubMed

Publication types

MeSH terms

LinkOut - more resources