

Exploring the clinical and genetic associations of adult weight trajectories using electronic health records in a racially diverse biobank: a phenome-wide and polygenic risk study
- PMID: 35780037
- PMCID: PMC9612590
- DOI: 10.1016/S2589-7500(22)00099-1
Exploring the clinical and genetic associations of adult weight trajectories using electronic health records in a racially diverse biobank: a phenome-wide and polygenic risk study
Abstract
Background: Weight trajectories might reflect individual health status. In this study, we aimed to examine the clinical and genetic associations of adult weight trajectories using electronic health records (EHRs) in the BioMe Biobank.
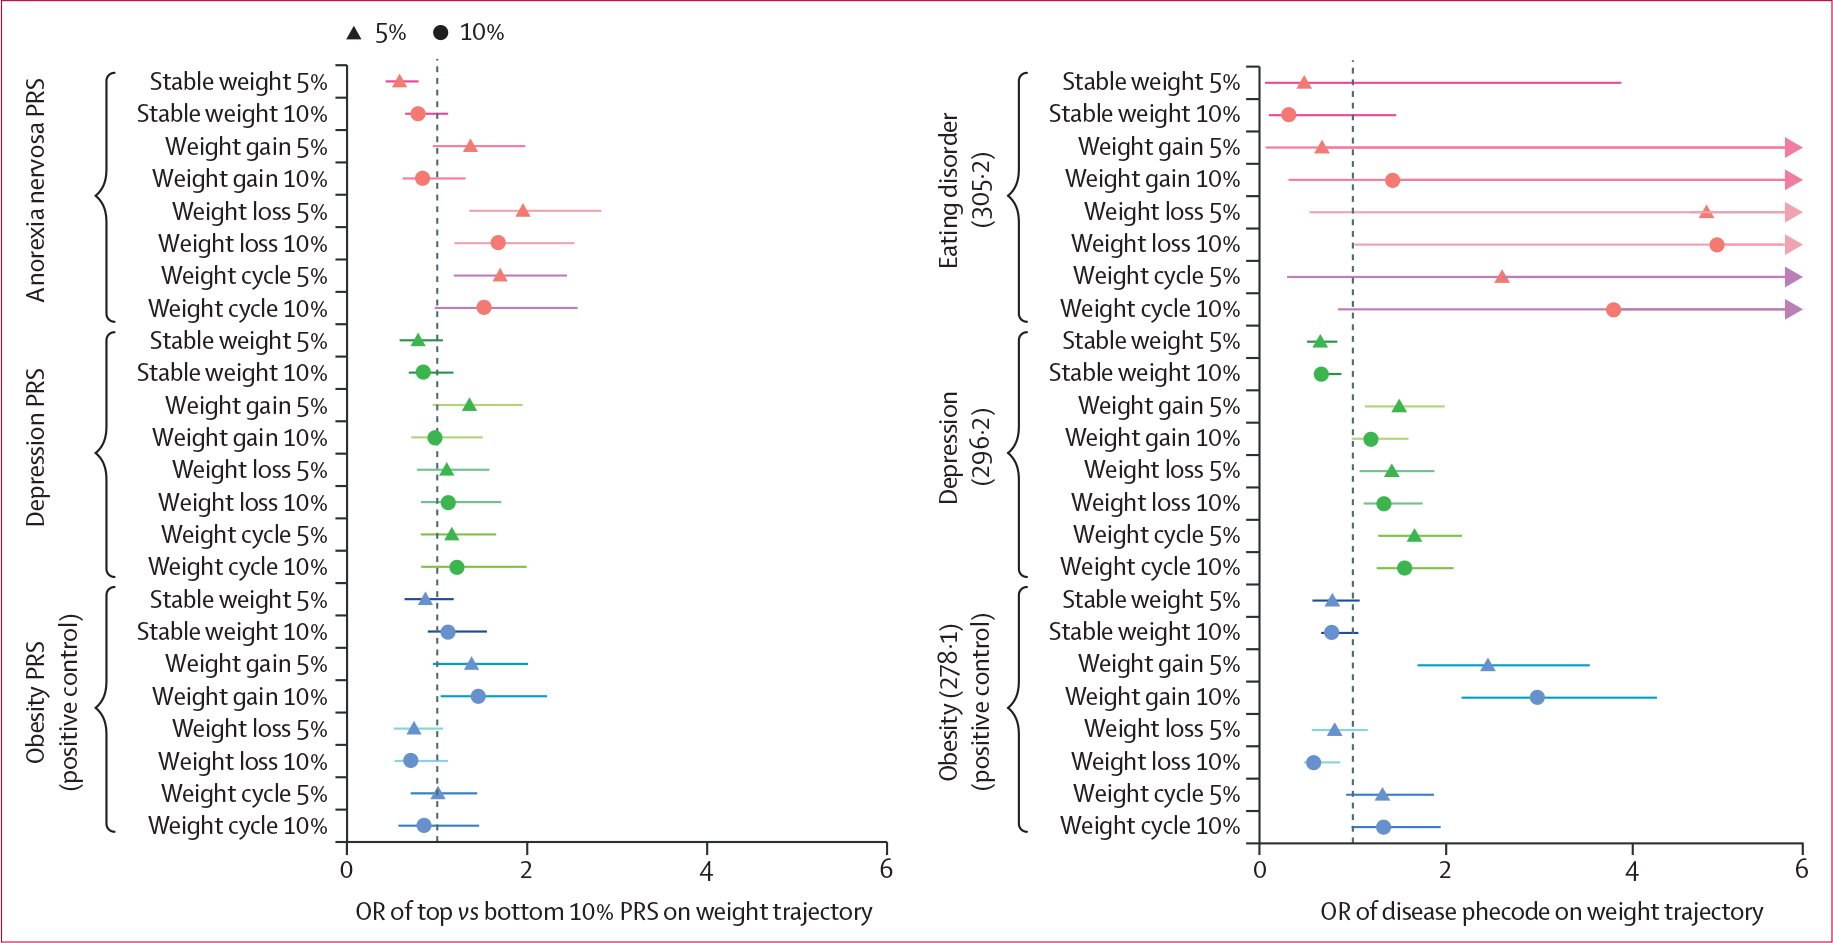
Methods: We constructed four weight trajectories based on a-priori definitions of weight changes (5% or 10%) using annual weight in EHRs (stable weight, weight gain, weight loss, and weight cycle); the final weight dataset included 21 487 participants with 162 783 annual weight measures. To confirm accurate assignment of weight trajectories, we manually reviewed weight trajectory plots for 100 random individuals. We then did a hypothesis-free phenome-wide association study (PheWAS) to identify diseases associated with each weight trajectory. Next, we estimated the single-nucleotide polymorphism-based heritability (hSNP2) of weight trajectories using GCTA-GREML, and we did a hypothesis-driven analysis of anorexia nervosa and depression polygenic risk scores (PRS) on these weight trajectories, given both diseases are associated with weight changes. We extended our analyses to the UK Biobank to replicate findings from a patient population to a generally healthy population.
Findings: We found high concordance between manually assigned weight trajectories and those assigned by the algorithm (accuracy ≥98%). Stable weight was consistently associated with lower disease risks among those passing Bonferroni-corrected p value in our PheWAS (p≤4·4 × 10-5). Additionally, we identified an association between depression and weight cycle (odds ratio [OR] 1·42, 95% CI 1·31-1·55, p≤7·7 × 10-16). The adult weight trajectories were heritable (using 5% weight change as the cutoff: hSNP2 of 2·1%, 95% CI 0·9-3·3, for stable weight; 4·1%, 1·4-6·8, for weight gain; 5·5%, 2·8-8·2, for weight loss; and 4·7%, 2·3-7·1%, for weight cycle). Anorexia nervosa PRS was positively associated with weight loss trajectory among individuals without eating disorder diagnoses (OR1SD 1·16, 95% CI 1·07-1·26, per 1 SD higher PRS, p=0·011), and the association was not attenuated by obesity PRS. No association was found between depression PRS and weight trajectories after permutation tests. All main findings were replicated in the UK Biobank (p<0·05).
Interpretation: Our findings suggest the importance of considering weight from a longitudinal aspect for its association with health and highlight a crucial role of weight management during disease development and progression.
Funding: Klarman Family Foundation, US National Institute of Mental Health (NIMH).
Copyright © 2022 The Author(s). Published by Elsevier Ltd. This is an Open Access article under the CC BY-NC-ND 4.0 license. Published by Elsevier Ltd.. All rights reserved.
Conflict of interest statement
Declaration of interests CMB has served on advisory boards for Shire/Takeda (Scientific Advisory Board member), Equip Health (clinical advisory board), and has been a consultant for Idorsia; she is a grant recipient of Lundbeckfonden, and receives royalties from Pearson (author); she also has received honoraria for a plenary talk for the Royal College of Psychiatrists and as a keynote speaker for the Emily Program/Veritas. ML has received lecture honoraria from Lundbeck Pharmaceutical. MAK has received speaking fees from Janssen-Cilag PTY. All other authors declare no competing interests.
Figures


References
-
- Alharbi TA, Paudel S, Gasevic D, Ryan J, Freak-Poli R, Owen AJ. The association of weight change and all-cause mortality in older adults: a systematic review and meta-analysis. Age Ageing 2021; 50: 697–704. - PubMed
-
- Hyppönen E, Mulugeta A, Zhou A, Santhanakrishnan VK. A data-driven approach for studying the role of body mass in multiple diseases: a phenome-wide registry-based case-control study in the UK Biobank. Lancet Digit Health 2019; 1: e116–26. - PubMed
Publication types
MeSH terms
Grants and funding
LinkOut - more resources
Full Text Sources
