Population genomics and sexual signals support reproductive character displacement in Uperoleia (Anura: Myobatrachidae) in a contact zone
- PMID: 35780470
- PMCID: PMC9542136
- DOI: 10.1111/mec.16597
Population genomics and sexual signals support reproductive character displacement in Uperoleia (Anura: Myobatrachidae) in a contact zone
Abstract
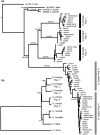
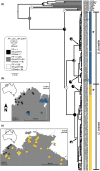
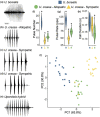
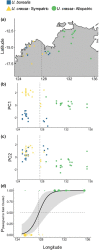
When closely related species come into contact via range expansion, both may experience reduced fitness as a result of the interaction. Selection is expected to favour traits that minimize costly interspecies reproductive interactions (such as mismating) via a phenomenon called reproductive character displacement (RCD). Research on RCD frequently assumes secondary contact between species, but the geographical history of species interactions is often unknown. Population genomic data permit tests of geographical hypotheses about species origins and secondary contact through range expansion. We used population genomic data from single nucleotide polymorphisms (SNPs), mitochondrial sequence data, advertisement call data and morphological data to investigate a species complex of toadlets (Uperoleia borealis, U. crassa, U. inundata) from northern Australia. Although the three species of frogs were morphologically indistinguishable in our analysis, we determined that U. crassa and U. inundata form a single species (synonymized here) based on an absence of genomic divergence. SNP data identified the phylogeographical origin of U. crassa as the Top End, with subsequent westward invasion into the range of U. borealis in the Kimberley. We identified six F1 hybrids, all of which had the U. borealis mitochondrial haplotype, suggesting unidirectional hybridization. Consistent with the RCD hypothesis, U. borealis and U. crassa sexual signals differ more in sympatry than in allopatry. Hybrid males have intermediate calls, which probably reduces attractiveness to females. Integrating population genomic data, mitochondrial sequencing, morphology and behavioural approaches provides an unusually detailed collection of evidence for reproductive character displacement following range expansion and secondary contact.
Keywords: mitochondrial genome; range expansion; reproductive interference; speciation; unidirectional hybridization.
© 2022 The Authors. Molecular Ecology published by John Wiley & Sons Ltd.
Conflict of interest statement
The authors declare no conflicts of interest.
Figures


Similar articles
-
Contact zone dynamics during early stages of speciation in a chorus frog (Pseudacris crucifer).Heredity (Edinb). 2016 Feb;116(2):239-47. doi: 10.1038/hdy.2015.96. Epub 2015 Dec 2. Heredity (Edinb). 2016. PMID: 26626576 Free PMC article.
-
Reproductive character displacement and signal ontogeny in a sympatric assemblage of electric fish.Evolution. 2011 Jun;65(6):1650-66. doi: 10.1111/j.1558-5646.2011.01245.x. Epub 2011 Mar 4. Evolution. 2011. PMID: 21644955
-
Reproductive character displacement of female, but not male song discrimination in an avian hybrid zone.Evolution. 2017 Jul;71(7):1776-1786. doi: 10.1111/evo.13267. Epub 2017 May 24. Evolution. 2017. PMID: 28493350
-
The Genetic Architecture of Local Adaptation and Reproductive Character Displacement in Scutiger boulengeri Complex (Anura: Megophryidae).Mol Ecol. 2025 Jan;34(2):e17611. doi: 10.1111/mec.17611. Epub 2024 Dec 16. Mol Ecol. 2025. PMID: 39681833
-
Character displacement: in situ evolution of novel phenotypes or sorting of pre-existing variation?J Evol Biol. 2007 Mar;20(2):448-59. doi: 10.1111/j.1420-9101.2006.01187.x. J Evol Biol. 2007. PMID: 17305810 Review.
Cited by
-
Mitonuclear and phenotypic discordance in an Atlantic Forest frog hybrid zone.Ecol Evol. 2024 Sep 13;14(9):e70262. doi: 10.1002/ece3.70262. eCollection 2024 Sep. Ecol Evol. 2024. PMID: 39279790 Free PMC article.
-
Museum Skins Enable Identification of Introgression Associated with Cytonuclear Discordance.Syst Biol. 2024 Sep 5;73(3):579-593. doi: 10.1093/sysbio/syae016. Syst Biol. 2024. PMID: 38577768 Free PMC article.
-
Boundary Effects Cause False Signals of Range Expansions in Population Genomic Data.Mol Biol Evol. 2024 May 3;41(5):msae091. doi: 10.1093/molbev/msae091. Mol Biol Evol. 2024. PMID: 38743590 Free PMC article.
-
The blowfly Chrysomya latifrons inhabits fragmented rainforests, but shows no population structure.Oecologia. 2023 Mar;201(3):703-719. doi: 10.1007/s00442-023-05333-w. Epub 2023 Feb 11. Oecologia. 2023. PMID: 36773072 Free PMC article.
References
-
- Austerlitz, F. , Jung‐Muller, B. , Godelle, B. , & Gouyon, P.‐H. (1997). Evolution of coalescence times, genetic diversity and structure during colonization. Theoretical Population Biology, 51(2), 148–164. 10.1006/tpbi.1997.1302 - DOI
Publication types
MeSH terms
Associated data
LinkOut - more resources
Full Text Sources
Miscellaneous

