

PGE2 -EP3 axis promotes brown adipose tissue formation through stabilization of WTAP RNA methyltransferase
- PMID: 35781818
- PMCID: PMC9379545
- DOI: 10.15252/embj.2021110439
PGE2 -EP3 axis promotes brown adipose tissue formation through stabilization of WTAP RNA methyltransferase
Abstract
Brown adipose tissue (BAT) functions as a thermogenic organ and is negatively associated with cardiometabolic diseases. N6 -methyladenosine (m6 A) modulation regulates the fate of stem cells. Here, we show that the prostaglandin E2 (PGE2 )-E-prostanoid receptor 3 (EP3) axis was activated during mouse interscapular BAT development. Disruption of EP3 impaired the browning process during adipocyte differentiation from pre-adipocytes. Brown adipocyte-specific depletion of EP3 compromised interscapular BAT formation and aggravated high-fat diet-induced obesity and insulin resistance in vivo. Mechanistically, activation of EP3 stabilized the Zfp410 mRNA via WTAP-mediated m6 A modification, while knockdown of Zfp410 abolished the EP3-induced enhancement of brown adipogenesis. EP3 prevented ubiquitin-mediated degradation of WTAP by eliminating PKA-mediated ERK1/2 inhibition during brown adipocyte differentiation. Ablation of WTAP in brown adipocytes abrogated the protective effect of EP3 overexpression in high-fat diet-fed mice. Inhibition of EP3 also retarded human embryonic stem cell differentiation into mature brown adipocytes by reducing the WTAP levels. Thus, a conserved PGE2 -EP3 axis promotes BAT development by stabilizing WTAP/Zfp410 signaling in a PKA/ERK1/2-dependent manner.
Keywords: E-prostanoid 3 receptor; WTAP; brown pre-adipocytes; differentiation; m6A.
© 2022 The Authors.
Figures

- A
Uniform manifold approximation and projection (UMAP) plot of the pre‐adipocytes and mature adipocytes from human deep‐neck BAT (E‐MTAB‐8564).
- B
Violin plots showing the expression of prostaglandin (PG) receptors in pre‐adipocytes and mature adipocytes from human deep‐neck BAT (E‐MTAB‐8564).
- C
Expression levels of PG receptors in mature brown adipocytes of mouse interscapular BAT (iBAT) showed by violin plots (E‐MTAB‐8562).
- D
Relative mRNA levels of PG receptors in mouse iBAT at 1 day, and 1, 2, 3, 4, and 5 weeks after birth detected by RT–qPCR (n = 6–8).
- E
PG levels in mouse BAT at 1 day, and 1, 2, 3, 4, and 5 weeks after birth detected by LC–MS/MS (n = 4–6).
- F
Relative mRNA levels of PG receptors in differentiated BAs at 2, 5, and 8 days after adipogenesis induction detected by RT–qPCR (n = 4–7).
- G
Oil Red O staining of mouse BAs differentiated from brown pre‐adipocytes with the treatment of EP1, EP3, and FP receptor inhibitors. Scale bar: 100 μm.
- H
qRT–PCR analysis of the relative mRNA levels of brown marker genes in mouse BAs differentiated from brown pre‐adipocytes with the treatment of PG receptor inhibitor (n = 4–7).

- A
Oil Red O staining of mouse BAs differentiated from normal or EP3‐deficient brown pre‐adipocytes. Scale bar: 50 μm.
- B
Mean lipid droplet area of differentiated BAs from normal or EP3‐deficient brown pre‐adipocytes (n = 6).
- C
Relative mRNA levels of brown marker genes in differentiated mouse BAs from normal or EP3‐deficient brown pre‐adipocytes detected by RT–qPCR (n = 7–8).
- D
Representative image of hematoxylin and eosin (H&E) staining for iBAT from EP3F/F and EP3F/FMyf5Cre mice. Scale bar: 50 μm.
- E
Mean adipocyte area of BAs in iBAT from EP3F/F and EP3F/FMyf5Cre mice (n = 8).
- F
Relative mRNA levels of brown marker genes in iBAT from EP3F/F and EP3F/FMyf5Cre mice detected by RT–qPCR (n = 8).
- G
Body weight analysis of EP3F/F and EP3F/FMyf5Cre mice fed HFD (n = 12).
- H
Food intake of EP3F/F and EP3F/FMyf5Cre mice during HFD feeding (n = 7).
- I, J
Intraperitoneal glucose tolerance test (GTT) (I) and insulin tolerance test (ITT) (J) in EP3F/F and EP3F/FMyf5Cre mice fed HFD (n = 7–8).
- K
Representative image of H&E staining of iBAT from EP3F/F and EP3F/FMyf5Cre mice fed HFD. Scale bar: 50 μm.
- L
Mean adipocyte area of BAs in iBAT from EP3F/F and EP3F/FMyf5Cre mice fed HFD (n = 8).
- M
Relative mRNA levels of brown marker genes in iBAT from EP3F/F and EP3F/FMyf5Cre mice fed HFD detected by RT–qPCR (n = 6–8).

- A
Representative picture of BAs differentiated from EP3−/− brown pre‐adipocytes re‐expressed with EP3 isoforms. Bar: 50 μm.
- B–D
Relative expression levels of EP3 isoforms in EP3−/− brown pre‐adipocytes after re‐expression of EP3 isoforms, respectively (n = 4–5).
- E–L
Expression levels of brown marker genes in BAs differentiated from EP3γ‐re‐expressed EP3−/− brown pre‐adipocytes (n = 6–7).

- A
N6‐methyladenosine (m6A) modification levels of mRNAs in normal and EP3‐deficient brown pre‐adipocytes with or without brown adipogenesis induction, detected by m6A RNA Methylation Quantification Kit (Colorimetric) (n = 4–6).
- B
qRT–PCR analysis of the relative mRNA levels of m6A writers (METTL3, METTL4, METTL14, and WTAP) and erasers (FTO and ALKBH5) in normal and EP3‐deficient brown pre‐adipocytes with or without brown adipogenesis induction (n = 6–9).
- C
Western blotting analysis of m6A writers and erasers in normal and EP3‐deficient brown pre‐adipocytes with or without brown adipogenesis induction.
- D
Quantification of protein levels in C (n = 4–6).
- E
Western blotting analysis of WTAP in iBAT from EP3F/F and EP3F/FMyf5Cre mice fed HFD for 1 week.
- F
Western blotting analysis of WTAP in BAs differentiated from EP3γ‐expressed brown pre‐adipocytes.
- G
Relative mRNA levels of WTAP gene in BAs differentiated from EP3γ‐expressed brown pre‐adipocytes detected by RT–qPCR (n = 6–7).
- H
qRT–PCR analysis of the relative mRNA levels of EP3γ gene in BAs differentiated from EP3γ‐expressed EP3−/− brown pre‐adipocytes after transfection with WTAP siRNA (n = 8).
- I
qRT–PCR analysis of the relative mRNA levels of WTAP gene in BAs differentiated from EP3γ‐expressed EP3−/− brown pre‐adipocytes after transfection with WTAP siRNA (n = 8).
- J
Representative picture of Oil Red O‐stained BAs differentiated from EP3γ‐expressed EP3−/− brown pre‐adipocytes with WTAP siRNA treatment. Scale bar: 50 μm.
- K–Q
qRT–PCR analysis of the relative mRNA levels of brown marker genes in BAs differentiated from EP3γ‐expressed EP3−/− brown pre‐adipocytes after transfection with WTAP siRNA (n = 6–8).

- A
Body weights of HFD‐fed WTAPF/F and WTAPF/FMyf5Cre mice after intra‐iBAT administration of AAV9‐CAG‐EP3γ vectors (n = 8–9).
- B–E
GTT (B, C) and ITT (D, E) in HFD‐fed WTAPF/F and WTAPF/FMyf5Cre mice with adenovirus‐mediated overexpression of EP3γ in iBAT (n = 6–9).
- F
Representative H&E staining of iBAT in HFD‐fed WTAPF/F and WTAPF/FMyf5Cre mice after intra‐iBAT administration of AAV9‐CAG‐EP3γ vectors. Scale bar: 50 μm.
- G
Expression levels of brown marker genes in iBAT of HFD‐fed WTAPF/F and WTAPF/FMyf5Cre mice after intra‐iBAT administration of AAV9‐CAG‐EP3γ (n = 6–8).
- H–J
Energy expenditure (H), locomotor activity (I), and food intake (J) in HFD‐fed WTAPF/F and WTAPF/FMyf5Cre mice after intra‐iBAT administration of AAV9‐CAG‐EP3γ vectors (n = 6–8).
- A
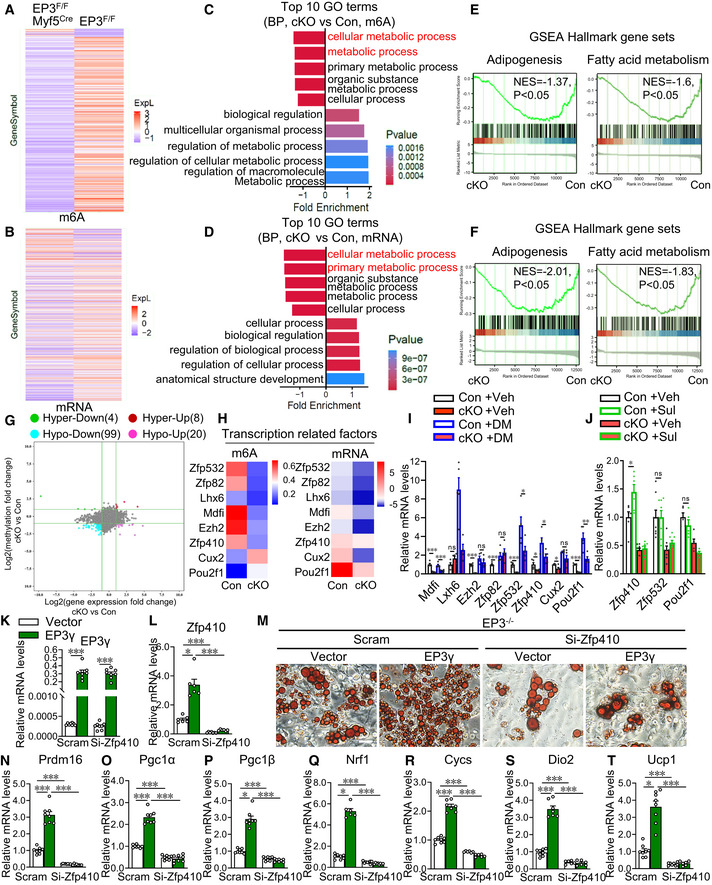
Heatmap of mRNA m6A modification profile changes between the control and EP3‐deficient brown pre‐adipocytes detected by the m6A mRNA epitranscriptomic microarray.
- B
Heatmap of mRNA profile changes between the control and EP3‐deficient brown pre‐adipocytes detected by the m6A mRNA epitranscriptomic microarray.
- C
Top 10 enriched gene ontology (GO) terms of genes with up‐ and downregulated mRNA m6A levels in EP3‐deficient brown pre‐adipocytes in the biological process.
- D
Top 10 enriched GO terms of up‐ and downregulated genes in EP3‐deficient brown pre‐adipocytes in the biological process.
- E
Gene set enrichment analysis (GSEA) plot depicting the enrichment of genes with downregulated m6A modification in “adipogenesis” and “fatty acid metabolism” signature (MSigDB Hallmark annotation sets) in EP3‐deficient brown pre‐adipocytes as compared to control cells.
- F
GSEA plot depicting the enrichment of downregulated genes in “adipogenesis” and “fatty acid metabolism” signature (MSigDB Hallmark annotation sets) in EP3‐deficient brown pre‐adipocytes as compared to control cells.
- G
Association analysis of m6A methylation and mRNA expression.
- H
Heatmap of m6A and mRNA expression levels of 8 transcription‐related genes (Cux2, Pou2f1, Mdfi, Lxh6, Ezh2, Zfp532, Zfp82, and Zfp410) in the control and EP3‐deficient brown pre‐adipocytes from the m6A mRNA epitranscriptomic microarray.
- I
qRT–PCR analysis of the relative mRNA levels of the 8 genes in control and EP3‐deficient brown pre‐adipocytes with or without DM treatment (n = 4–5).
- J
qRT–PCR analysis of the relative mRNA levels of Zfp410, Zfp532, and Pou2f1 genes in control and EP3‐deficient brown pre‐adipocytes with or without sulprostone treatment (n = 5–8).
- K
qRT–PCR analysis of the relative mRNA levels of EP3γ in BAs differentiated from EP3γ‐expressed EP3−/− brown pre‐adipocytes with Zfp410 siRNA treatment (n = 8).
- L
qRT–PCR analysis of the relative mRNA levels of Zfp410 in BAs differentiated from EP3γ‐expressed EP3−/− brown pre‐adipocytes with Zfp410 siRNA treatment (n = 6–8).
- M
Representative picture of Oil Red O‐stained BAs differentiated from EP3γ‐expressed EP3−/− brown pre‐adipocytes with Zfp410 siRNA treatment. Scale bar: 50 μm.
- N–T
qRT–PCR analysis of the relative mRNA levels of brown marker genes in BAs differentiated from EP3γ‐expressed EP3−/− brown pre‐adipocytes with Zfp410 siRNA treatment (n = 6–8).

- A
CUT&TAG heatmaps showing normalized signals for Zfp410 in brown pre‐adipocytes with or without adipogenesis induction.
- B
GO analysis of Zfp410 target genes during brown adipogenesis.
- C–H
Genome browser tracks of Zfp410 at genomic regions near CHD4, brown genes, and muscle gene during brown adipogenesis.

- A
Effect of the transcription inhibitor, actinomycin D (Act D), on Zfp410 mRNA expression levels in sulprostone‐treated brown pre‐adipocytes (n = 5–9).
- B
RNA immunoprecipitation (RIP)–qPCR analysis of m6A levels on Zfp410 mRNA in the control and EP3‐deficient brown pre‐adipocytes (n = 6).
- C
RIP–qPCR analysis of m6A levels on Zfp410 mRNA in sulprostone‐treated brown pre‐adipocytes transduced with WTAP siRNA (n = 6–7).
- D
Zfp410 mRNA levels in sulprostone‐treated brown pre‐adipocytes transduced with WTAP siRNA (n = 8).
- E
RIP–qPCR analysis of enrichment of WTAP on Zfp410 mRNA in sulprostone‐treated brown pre‐adipocytes (n = 8).
- F
Construction of plasmids with WT or m6A site mutant in Zfp410 mRNA 3′‐untranslated region (UTR).
- G
Effect of WTAP on mouse Zfp410 mRNA 3′‐UTR‐mediated luciferase activity in brown pre‐adipocytes with or without sulprostone treatment (n = 4–8).
- H
The half‐life of Zfp410 mRNA in sulprostone‐treated brown pre‐adipocytes with or without WTAP siRNA treatment (n = 7–8).

- A
Western blotting analysis of ubiquitination of WTAP in the control and EP3‐deficient brown pre‐adipocytes with or without sulprostone treatment.
- B
Western blotting analysis of ERK1/2 phosphorylation in the control and EP3‐deficient brown pre‐adipocytes.
- C
Effect of ERK1/2 inhibitor, ravoxertinib, on ubiquitin‐dependent degradation of WTAP in sulprostone‐treated brown pre‐adipocytes.
- D
Effect of wortmannin (Wor), pertussis toxin (PTX), U73122, barbadin, and melittin on ubiquitin‐dependent degradation of WTAP in sulprostone‐treated brown pre‐adipocytes.
- E
Analysis of PKA activity in the control and EP3‐deficient brown pre‐adipocytes (n = 4).
- F
Effect of PKA inhibitor, H89, on ubiquitin‐dependent degradation of WTAP in EP3−/− brown pre‐adipocytes.
- G
Effect of ERK1/2 phosphorylation site mutation (HA‐WTAP‐2A) on EP3‐mediated ubiquitin‐dependent degradation of WTAP in brown pre‐adipocytes.
- H
Representative picture of Oil Red O‐stained BAs differentiated from sulprostone‐treated brown pre‐adipocyte with the treatment of PTX, dbcAMP, or ravoxertinib. Scale bar: 50 μm.
- I
Western blotting assay of ERK1/2, WTAP, ZFP410, PRDM16, and UCP1 in BAs differentiated from sulprostone‐treated brown pre‐adipocyte with the treatment of PTX, dbcAMP, or ravoxertinib.
- J
Schematic illustration of EP3‐mediated BA differentiation via the PKA/ERK1/2/WTAP/ZFP410 signaling pathway.

- A
Effect of cycloheximide (CHX) on WTAP protein levels in sulprostone‐treated brown pre‐adipocytes.
- B
Effect of MG132 on WTAP protein levels in EP3−/− brown pre‐adipocytes.
- C, D
Determination of WTAP protein half‐life in control and EP3−/− brown pre‐adipocytes by AHA pulse‐chase assay (n = 5).
- E, F
Determination of WTAP protein half‐life in sulprostone‐treated brown pre‐adipocytes in the presence or absence of ravoxertinib by AHA pulse‐chase assay (n = 5).
- G, H
Determination of HA‐WTAP and HA‐WTAP‐2A protein half‐life in brown pre‐adipocytes in the presence or absence of sulprostone by AHA pulse‐chase assay (n = 5).

- A
Experimental scheme for the differentiation of hESCs into BAs.
- B
Representative pictures of Nile red‐stained human BAs differentiated from hESC‐derived brown progenitors. Scale bar: 50 μm.
- C
Time course analysis of the relative mRNA levels of EP3 receptors in hESC‐derived BAs during BA differentiation detected by RT–qPCR (n = 7–8).
- D
Representative pictures of hESC‐derived BAs treated with L798106 alone or combined with H89. Scale bar: 50 μm.
- E
Effect of H89 on the relative mRNA level of brown marker gene in hESC‐derived BAs treated with L798106 detected by RT–qPCR (n = 6–8).
- F
Effect of H89 on WTAP mRNA expression in hESC‐derived BAs treated with L798106 (n = 6–7).
- G
Effect of H89 on ZNF410 mRNA expression in hESC‐derived BAs treated with L798106 (n = 7–8).
- H
Western blotting assay of ERK1/2, WTAP, ZNF410, PRDM16, and UCP1 in hESC‐derived BAs treated with L798106 alone or combined with H89.
References
-
- Aubert J, Saint‐Marc P, Belmonte N, Dani C, Negrel R, Ailhaud G (2000) Prostacyclin IP receptor up‐regulates the early expression of C/EBPbeta and C/EBPdelta in preadipose cells. Mol Cell Endocrinol 160: 149–156 - PubMed
Publication types
MeSH terms
Substances
Associated data
- Actions
- Actions
- Actions
LinkOut - more resources
Full Text Sources
Molecular Biology Databases
Research Materials
Miscellaneous
