. 2022 May 18;13(6):3476-3492.
doi: 10.1364/BOE.455783. eCollection 2022 Jun 1.

In situ autofluorescence lifetime assay of a photoreceptor stimulus response in mouse retina and human retinal organoids

Affiliations

In situ autofluorescence lifetime assay of a photoreceptor stimulus response in mouse retina and human retinal organoids

Kayvan Samimi et al. Biomed Opt Express. .

Abstract

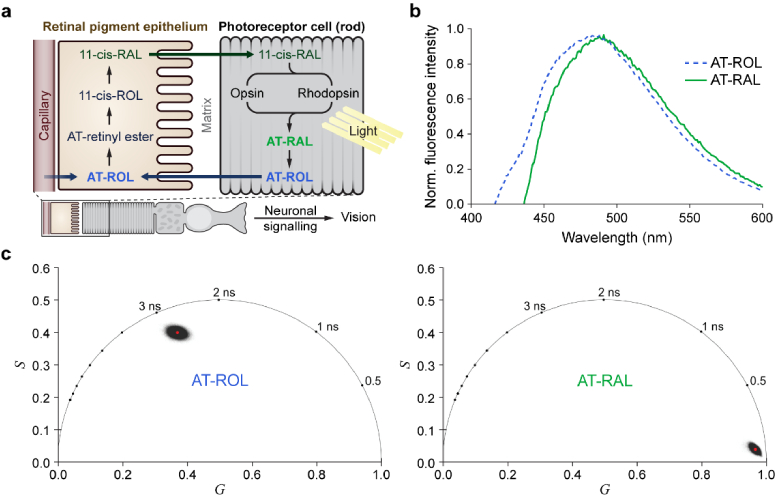
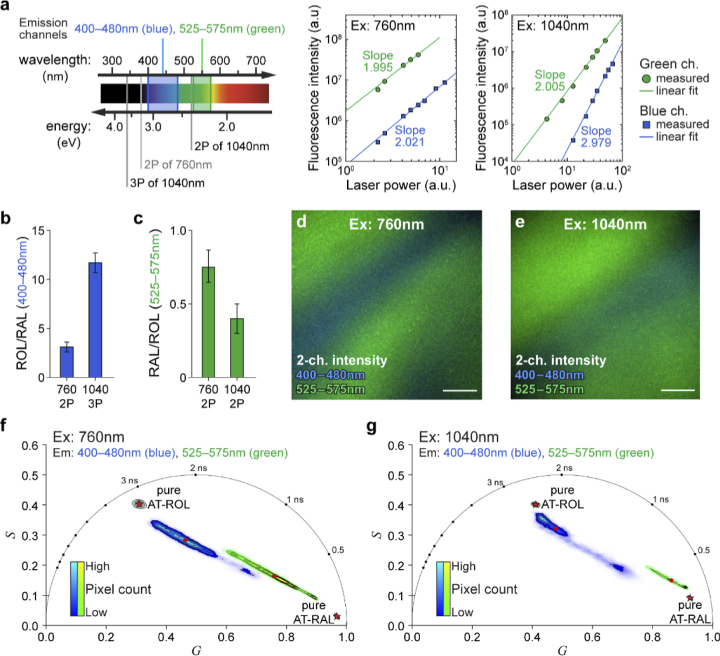
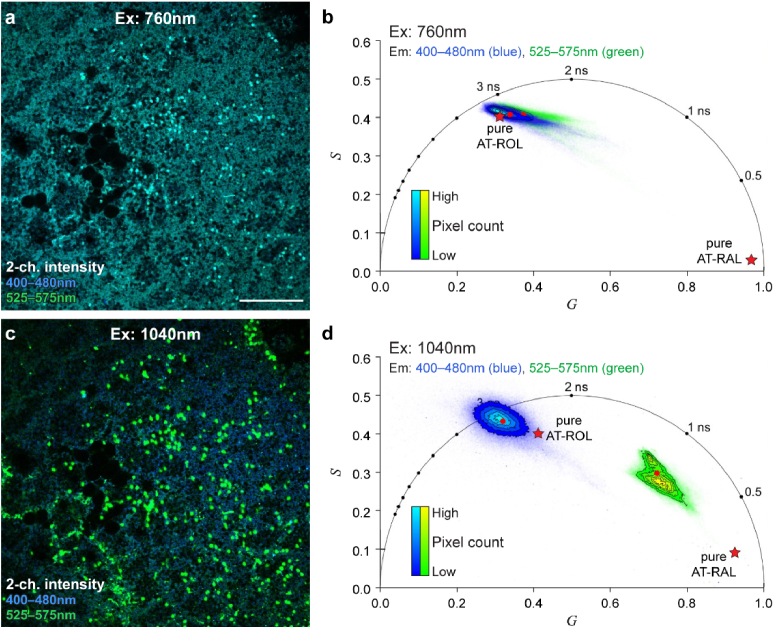
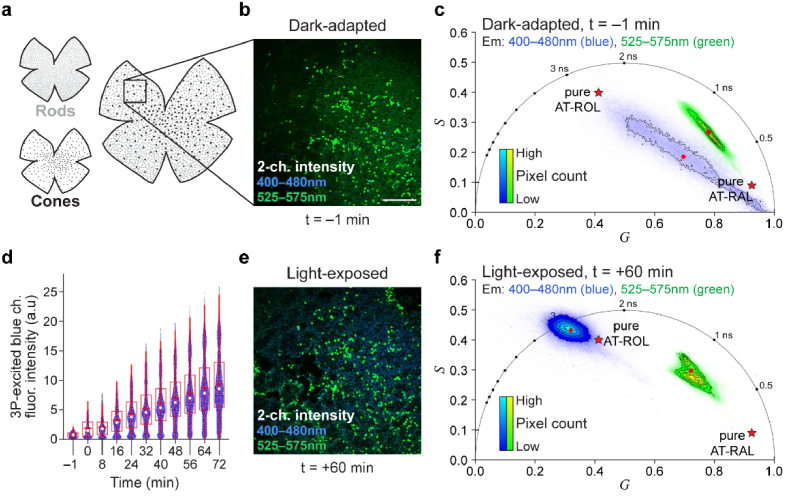
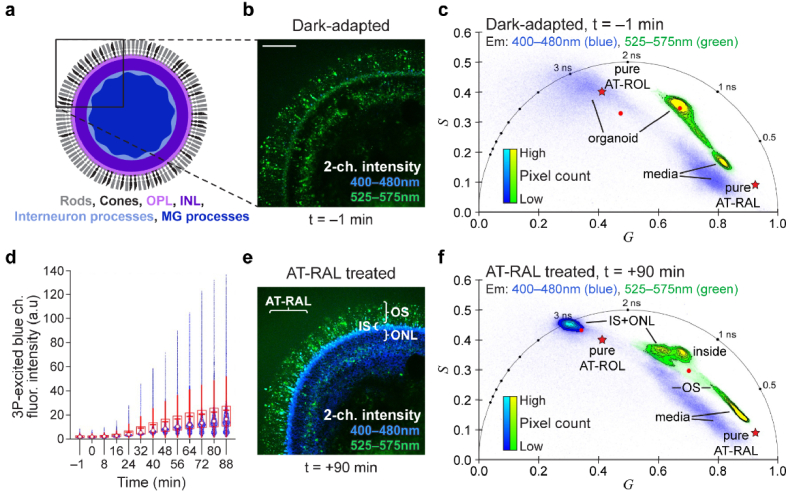
Photoreceptors are the key functional cell types responsible for the initiation of vision in the retina. Phototransduction involves isomerization and conversion of vitamin A compounds, known as retinoids, and their recycling through the visual cycle. We demonstrate a functional readout of the visual cycle in photoreceptors within stem cell-derived retinal organoids and mouse retinal explants based on spectral and lifetime changes in autofluorescence of the visual cycle retinoids after exposure to light or chemical stimuli. We also apply a simultaneous two- and three-photon excitation method that provides specific signals and increases contrast between these retinoids, allowing for reliable detection of their presence and conversion within photoreceptors. This multiphoton imaging technique resolves the slow dynamics of visual cycle reactions and can enable high-throughput functional screening of retinal tissues and organoid cultures with single-cell resolution.


Conflict of interest statement

D.M.G. has an ownership interest in Opsis Therapeutics LLC, which has licensed the technology to generate retinal organoids from pluripotent stem cell sources referenced in this publication. D.M.G. also declared intellectual rights through the Wisconsin Alumni Research Foundation and a consultant role with FUJIFILM Cellular Dynamics International. All other authors declared no conflicts of interest.

Figures

Fig. 1.
Fig. 1.
The visual cycle includes AT-ROL and AT-RAL with overlapping fluorescence emission spectra and distinct fluorescence lifetimes. (a) For phototransduction, photoreceptors rely on the fast (sub-picosecond) isomerization of 11-cis-RAL to all-trans-RAL after light absorption. The visual cycle is responsible for clearing the resulting AT-RAL and converting it back to the light-sensitive 11-cis-RAL through several enzymatic steps. This is a slow process (several minutes) that starts with conversion of AT-RAL to AT-ROL in the photoreceptors, followed by transfer of AT-ROL to the retinal pigment epithelium where it is converted to 11-cis-RAL and transported back to photoreceptor outer segments. Autofluorescence of these retinoids provides an endogenous signal for probing light response in retinal photoreceptor cells. (b) Normalized fluorescence emission spectra (excited at 350 nm) of AT-RAL and AT-ROL dissolved in ethanol. The emission spectra are broad and overlapping, with AT-ROL slightly blue-shifted relative to AT-RAL. (c) Phasor representation of fluorescence lifetime (two-photon Ex: 760 nm, Em: 550/100 nm) of pure AT-ROL or AT-RAL in ethanol shows significant separation of AT-ROL and AT-RAL. AT-RAL has a short lifetime of <0.1 ns while AT-ROL has a long lifetime of nearly 3 ns.
Fig. 2.
Fig. 2.
Simultaneous three- and two-photon excitation at 1040 nm increases spectral separation of AT-ROL and AT-RAL compared to two-photon excitation at 760 nm. (a) Comparison of multiphoton excitation at 760 nm and 1040 nm. Using 760 nm excitation, both emission channels (blue: 400-480 nm, green: 525-575 nm) collect fluorescence from two-photon excitation as indicated by the slope of the linear regression fit (slope≈2) on the log-log plot of fluorescence intensity vs. laser power. However, at 1040 nm excitation, the blue channel exclusively collects three-photon excited fluorescence (slope≈3), while the green channel primarily collects two-photon excited fluorescence (slope≈2). (b) Relative intensity of AT-ROL compared to AT-RAL in the blue emission channel is significantly increased under three-photon 1040 nm excitation (ROL/RAL≈12) compared to two-photon 760 nm excitation (ROL/RAL≈3). (c) Relative intensity of AT-RAL compared to AT-ROL in the green emission channel (RAL/ROL≈0.5) is not drastically different under either 1040 nm or 760 nm excitation. Ratios are calculated from intensity images of pure 100 µM solutions in 70% EtOH. (d) Two-channel fluorescence intensity image of a non-homogeneous mixture of 1 mM AT-RAL and 1 mM AT-ROL in ethanol, excited at 760 nm. (e) Two-channel intensity image of the same non-homogeneous mixture of AT-RAL and AT-ROL, excited at 1040 nm. Signal gradients within the images imply that different pixels emit different ratios of AT-RAL and AT-ROL fluorescence. (f) Phasor representation of the 760nm-excited image shows a mixture of AT-ROL (long lifetime) and AT-RAL (short lifetime) contributing to the emission in either channel. Phasor points fall on the axis connecting the pure retinoid locations (shown as red pentagrams). (g) Phasor representation of the 1040nm-excited image shows improved separation between AT-ROL and AT-RAL due to preferential three-photon excitation of AT-ROL compared to AT-RAL in the blue channel. The phasor points fall closer to the location of pure species. Red dots represent intensity-weighted phasor centroid in either channel. Red pentagrams represent phasor locations of the pure species. Scale bar: 100 µm.
Fig. 3.
Fig. 3.
Three- and two-photon excitation at 1040 nm in mouse retina improves image and lifetime contrast compared to two-photon excitation at 760 nm. (a) Two-channel autofluorescence intensity image of the photoreceptor layer of a light-exposed mouse retina explant, excited at 760 nm. (b) Phasor representation of the 760 nm excitation image in (a) reveals that the long lifetime species, AT-ROL, is the dominant signal in both emission channels (blue, 400-480 nm; green, 550-600 nm). (c) Two-channel autofluorescence intensity image of the same field of view as (a), excited at 1040 nm, provides increased image contrast. Cone photoreceptors are prominent in the green emission channel and bleached rod photoreceptors are prominent in the blue emission channel. (d) Phasor representation of the 1040 nm excitation image in (c) reveals the long lifetime of AT-ROL in the blue emission channel, and a mixture of the short lifetime of AT-RAL with longer lifetimes of AT-ROL and metabolic fluorophores (FAD and NAD(P)H) in the green emission channel. Red dots represent intensity-weighted phasor centroid in either channel. Red pentagrams represent phasor locations of the pure species measured in solution. Scale bar: 100 µm.
Fig. 4.
Fig. 4.
FLIM at 1040 nm excitation captures visual cycle dynamics in mouse retina explant following white light exposure. (a) Schematic of the mouse retina explant flat mount with RPE and sclera dissociated, and the photoreceptor layer preserved. Box shows microscopy field of view. (b) Two-channel fluorescence intensity image of the retina sample while dark-adapted. (c) Phasor representation of dark-adapted image reveals short lifetimes of RAL species and the absence of long lifetime of AT-ROL in the blue emission channel. The green channel phasor shows a mixture of RAL and metabolic fluorophores (FAD and NAD(P)H). (d) Following exposure to bright white light for 1 minute, the intensity of the three-photon (3P) excited fluorescence in the blue emission channel increases over 1 hour. White dot shows the median; red horizontal line shows the mean; box encompasses 25th to 75th percentile range; whiskers extend from the box to 1.5 times the interquartile range. Change in mean intensity with time is significant according to the linear trend test (t-statistic = 33, p = 8.7e-11). (e) 60 min after white light exposure, intensity image shows an increase in blue signal due to isomerization of 11-cis-RAL to AT-RAL and subsequent conversion of AT-RAL to AT-ROL. (f) Phasor representation of the image at one hour after light exposure reveals the long lifetime of AT-ROL. Red dots represent intensity-weighted phasor centroid in either channel. Red pentagrams represent phasor locations of the pure species measured in solution. Scale bar: 100 µm.
Fig. 5.
Fig. 5.
FLIM at 1040 nm excitation captures visual cycle dynamics in a stem cell-derived retinal organoid. (a) Schematic of the 3D-cultured stem cell-derived retinal organoid. Box shows microscopy field of view. OPL: outer plexiform layer, INL: inner nuclear layer, MG: Müller Glia. (b) Two-channel autofluorescence intensity image of a dark-adapted retinal organoid at day 240 in culture (blue: 400-480 nm, green: 525-575 nm). (c) Phasor representation of dark-adapted image in (b) shows short fluorescence lifetimes of the media surrounding the organoid as well as intermediate lifetimes of metabolic fluorophores (FAD, NAD(P)H) from the organoid in the green channel and sparse long lifetime of AT-ROL in the blue channel. (d) The organoid was treated with exogenous 50 µM AT-RAL, which simulates photobleaching of visual pigments, and the intensity of the three-photon excited fluorescence in the blue emission channel increases over 1 hour at a rate similar to the mouse retina. White dot shows the median; red horizontal line shows the mean; box encompasses 25th to 75th percentile range; whiskers extend from the box to 1.5 times the interquartile range. Change in mean intensity with time is significant according to the linear trend test (t-statistic = 27, p = 1.9e-11). (e) Two-channel fluorescence intensity image of the retinal organoid 90 min after treatment with AT-RAL shows an increase in the blue channel signal, due to conversion of AT-RAL to AT-ROL, in the photoreceptor cells, particularly in the inner segments (IS), outer nuclear layer (ONL) and the outer segments (OS). (f) Phasor representation of the treated organoid image in (e) reveals abundant long lifetime of AT-ROL in the blue channel, while the exogenous AT-RAL in the media (i.e., background seen at the upper left corner of the intensity image) appears with its characteristic short lifetime in the green channel of the phasor plot. Red dots represent intensity-weighted phasor centroid of the organoid in either channel. Red pentagrams represent phasor locations of the pure species measured in solution. Scale bar: 100 µm.
Fig. 6.
Fig. 6.
Immunocytochemistry (ICC) of fixed retinal organoids reveals expression of retinal dehydrogenase (RDH) enzyme in photoreceptor cells. (a) Bright field image of a retinal organoid after 260 days in culture. (b) ICC indicates presence of outer segment (OS)-localized RDH8 enzyme [see b3] in photoreceptor outer segments as well as its expression in ectopic photoreceptor cells deeper inside the organoid. (c) ICC indicates presence of inner segment (IS)-localized RDH12 [see c3] in photoreceptor inner segments (IS) and the outer nuclear layer (ONL). The location of the RDH expression in fixed organoids coincides with the location of the three-photon excited AT-ROL fluorescence signal in the blue channel of live retinal organoids. RHO: the rod photopigment rhodopsin; RDH8: OS-localized retinal dehydrogenase; RDH12: IS- and ONL-localized retinal dehydrogenase; ARR3: cone arrestin; DAPI: nuclei. OS: outer segments; IS: inner segments; ONL: outer nuclear layer. Scale bar: 50 µm.

Similar articles

Cited by

References

    1. Meyer J. S., Shearer R. L., Capowski E. E., Wright L. S., Wallace K. A., McMillan E. L., Zhang S. C., Gamm D. M., “Modeling early retinal development with human embryonic and induced pluripotent stem cells,” Proc. Natl. Acad. Sci. 106(39), 16698–16703 (2009).10.1073/pnas.0905245106 - DOI - PMC - PubMed
    1. Jin Z.-B., Okamoto S., Xiang P., Takahashi M., “Integration-Free Induced Pluripotent Stem Cells Derived from Retinitis Pigmentosa Patient for Disease Modeling,” Stem Cells Trans. Medicine 1(6), 503–509 (2012).10.5966/sctm.2012-0005 - DOI - PMC - PubMed
    1. Lamba D. A., Gust J., Reh T. A., “Transplantation of Human Embryonic Stem Cell-Derived Photoreceptors Restores Some Visual Function in Crx-Deficient Mice,” Cell Stem Cell 4(1), 73–79 (2009).10.1016/j.stem.2008.10.015 - DOI - PMC - PubMed
    1. Gonzalez-Cordero A., Kruczek K., Naeem A., Fernando M., Kloc M., Ribeiro J., Goh D., Duran Y., Blackford S. J. I., Abelleira-Hervas L., Sampson R. D., Shum I. O., Branch M. J., Gardner P. J., Sowden J. C., Bainbridge J. W. B., Smith A. J., West E. L., Pearson R. A., Ali R. R., “Recapitulation of Human Retinal Development from Human Pluripotent Stem Cells Generates Transplantable Populations of Cone Photoreceptors,” Stem Cell Rep. 9(3), 820–837 (2017).10.1016/j.stemcr.2017.07.022 - DOI - PMC - PubMed
    1. Li L., Zhao H., Xie H., Akhtar T., Yao Y., Cai Y., Dong K., Gu Y., Bao J., Chen J., Zhang M., Zhong K., Xu W., Xue T., “Electrophysiological characterization of photoreceptor-like cells in human inducible pluripotent stem cell-derived retinal organoids during in vitro maturation,” Stem Cells 39(7), 959–974 (2021).10.1002/stem.3363 - DOI - PubMed

LinkOut - more resources