

Genomic insights into the genotype-environment mismatch and conservation units of a Qinghai-Tibet Plateau endemic cypress under climate change
- PMID: 35782009
- PMCID: PMC9234613
- DOI: 10.1111/eva.13377
Genomic insights into the genotype-environment mismatch and conservation units of a Qinghai-Tibet Plateau endemic cypress under climate change
Abstract
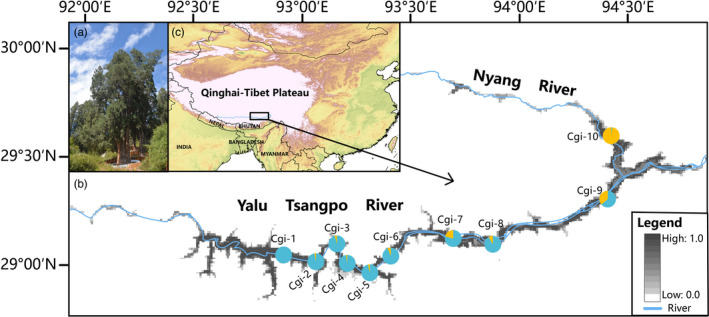
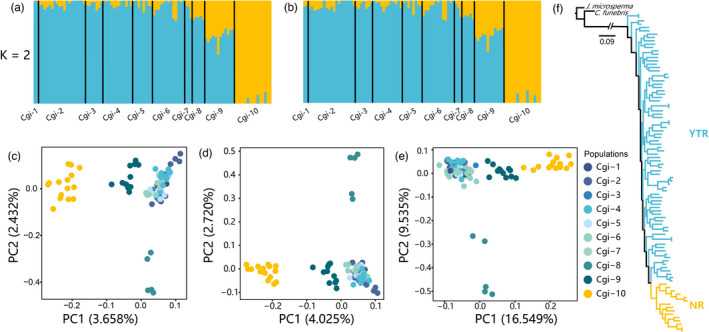
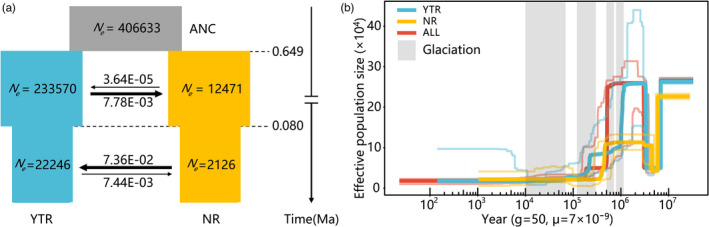
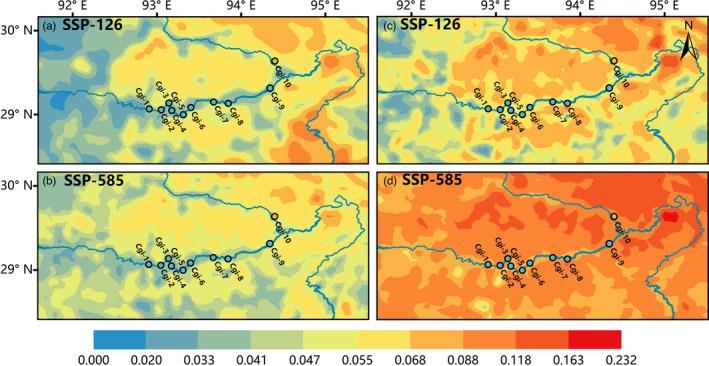
Habitat loss induced by climate warming is a major threat to biodiversity, particularly to threatened species. Understanding the genetic diversity and distributional responses to climate change of threatened species is critical to facilitate their conservation and management. Cupressus gigantea, a rare conifer found in the eastern Qinghai-Tibet Plateau (QTP) at 3000-3600 m.a.s.l., is famous for its largest specimen, the King Cypress, which is >55 m tall. Here, we obtained transcriptome data from 96 samples of 10 populations covering its whole distribution and used these data to characterize genetic diversity, identify conservation units, and elucidate genomic vulnerability to future climate change. After filtering, we identified 145,336, 26,103, and 2833 single nucleotide polymorphisms in the whole, putatively neutral, and putatively adaptive datasets, respectively. Based on the whole and putatively neutral datasets, we found that populations from the Yalu Tsangpo River (YTR) and Nyang River (NR) catchments could be defined as separate management units (MUs), due to distinct genetic clusters and demographic histories. Results of gradient forest models suggest that all populations of C. gigantea may be at risk due to the high expected rate of climate change, and the NR MU had a higher risk than the YTR MU. This study deepens our understanding of the complex evolutionary history and population structure of threatened tree species in extreme environments, such as dry river valleys above 3000 m.a.s.l. in the QTP, and provides insights into their susceptibility to global climate change and potential for adaptive responses.
Keywords: King Cypress; Qinghai–Tibetan Plateau; climate change; conservation units; genomic vulnerability; local adaptation.
© 2022 The Authors. Evolutionary Applications published by John Wiley & Sons Ltd.
Conflict of interest statement
None declared.
Figures
Similar articles
-
The Effects of Climate Change on the Distribution Pattern of Species Richness of Endemic Wetland Plants in the Qinghai-Tibet Plateau.Plants (Basel). 2024 Jul 9;13(14):1886. doi: 10.3390/plants13141886. Plants (Basel). 2024. PMID: 39065412 Free PMC article.
-
Evolutionary history of two rare endemic conifer species from the eastern Qinghai-Tibet Plateau.Ann Bot. 2021 Nov 9;128(7):903-918. doi: 10.1093/aob/mcab114. Ann Bot. 2021. PMID: 34472580 Free PMC article.
-
Impacts of climate change on herpetofauna diversity in the Qinghai-Tibetan Plateau.Conserv Biol. 2023 Dec;37(6):e14155. doi: 10.1111/cobi.14155. Epub 2023 Sep 15. Conserv Biol. 2023. PMID: 37551770
-
Information entropy and elasticity analysis of the land use structure change influencing eco-environmental quality in Qinghai-Tibet Plateau from 1990 to 2015.Environ Sci Pollut Res Int. 2022 Mar;29(13):18348-18364. doi: 10.1007/s11356-021-17978-2. Epub 2022 Jan 12. Environ Sci Pollut Res Int. 2022. PMID: 35022979 Review.
-
The role of the uplift of the Qinghai-Tibetan Plateau for the evolution of Tibetan biotas.Biol Rev Camb Philos Soc. 2015 Feb;90(1):236-53. doi: 10.1111/brv.12107. Epub 2014 May 1. Biol Rev Camb Philos Soc. 2015. PMID: 24784793 Review.
Cited by
-
Decoding endosperm endophytes in Pinus armandi: a crucial indicator for host response to climate change.BMC Microbiol. 2025 Apr 23;25(1):239. doi: 10.1186/s12866-025-03910-y. BMC Microbiol. 2025. PMID: 40269688 Free PMC article.
-
Conservation genomics of a threatened subtropical Rhododendron species highlights the distinct conservation actions required in marginal and admixed populations.Plant J. 2025 Apr;122(2):e70175. doi: 10.1111/tpj.70175. Plant J. 2025. PMID: 40287966 Free PMC article.
-
Climate change vulnerability and conservation strategies for tertiary relict tree species: Insights from landscape genomics of Taxus cuspidata.Evol Appl. 2024 Sep 4;17(9):e13686. doi: 10.1111/eva.13686. eCollection 2024 Sep. Evol Appl. 2024. PMID: 39247090 Free PMC article.
-
Genomic signals of local adaptation in Picea crassifolia.BMC Plant Biol. 2023 Nov 3;23(1):534. doi: 10.1186/s12870-023-04539-7. BMC Plant Biol. 2023. PMID: 37919677 Free PMC article.
-
Transcriptome data analysis provides insights into the conservation of Michelia lacei, a plant species with extremely small populations distributed in Yunnan province, China.BMC Plant Biol. 2024 Mar 19;24(1):200. doi: 10.1186/s12870-024-04892-1. BMC Plant Biol. 2024. PMID: 38500068 Free PMC article.
References
-
- Alberto, F. J. , Aitken, S. N. , Alía, R. , González‐Martínez, S. C. , Hänninen, H. , Kremer, A. , Lefèvre, F. , Lenormand, T. , Yeaman, S. , Whetten, R. , & Savolainen, O. (2013). Potential for evolutionary responses to climate change‐evidence from tree populations. Global Change Biology, 19(6), 1645–1661. 10.1111/gcb.12181 - DOI - PMC - PubMed
-
- Alexa, A. , & Rahnenführer, J. (2016). Gene set enrichment analysis with topGO. R package version 2.24.0. http://www.bioconductor.org/packages/release/bioc/html/topGO.html
LinkOut - more resources
Full Text Sources
Research Materials
