. 2022 Jun 15:12:918010.
doi: 10.3389/fcimb.2022.918010. eCollection 2022.

Metagenomic Analyses of Multiple Gut Datasets Revealed the Association of Phage Signatures in Colorectal Cancer

Affiliations

Metagenomic Analyses of Multiple Gut Datasets Revealed the Association of Phage Signatures in Colorectal Cancer

Wenxuan Zuo et al. Front Cell Infect Microbiol. .

Abstract

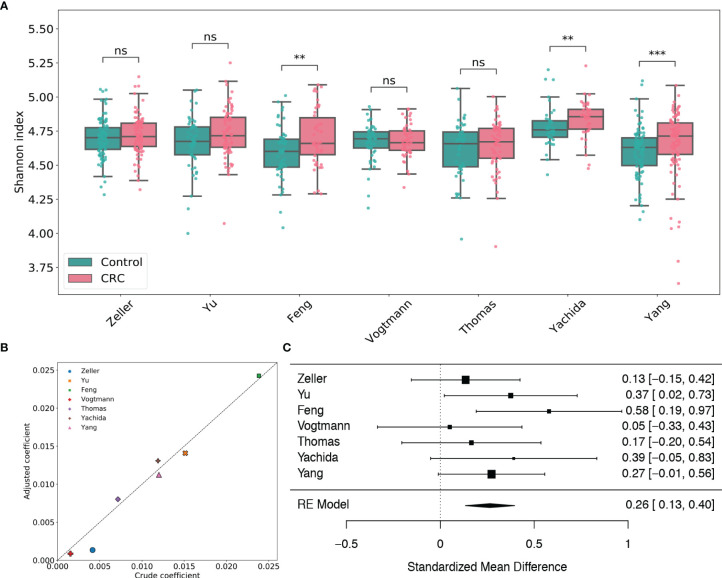
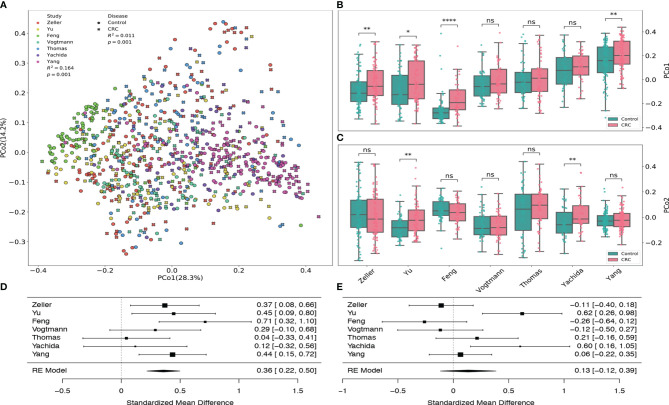
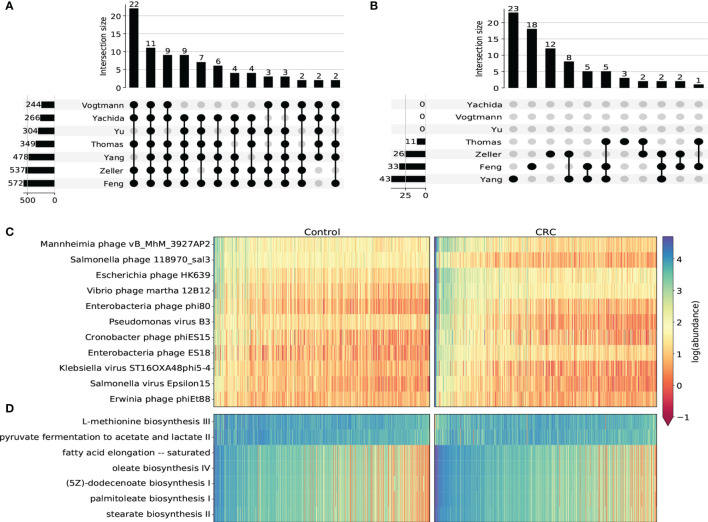
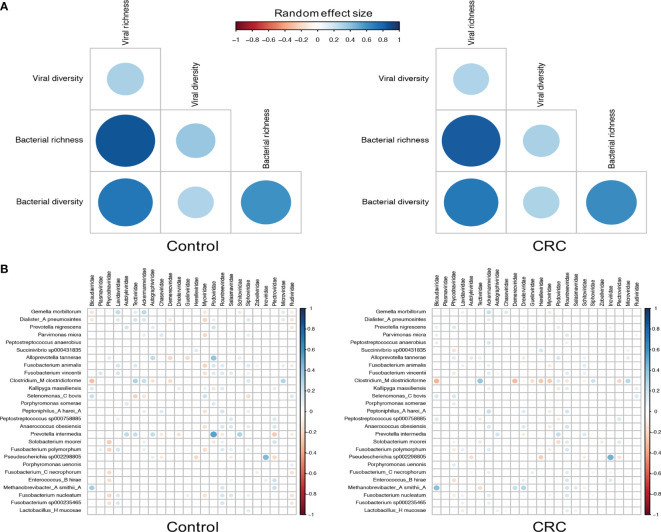
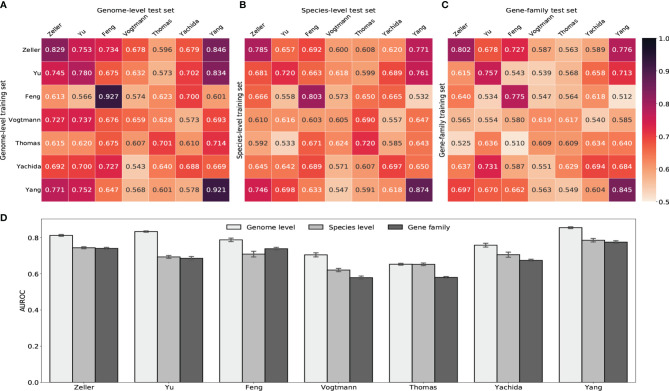
The association of colorectal cancer (CRC) and the human gut microbiome dysbiosis has been the focus of several studies in the past. Many bacterial taxa have been shown to have differential abundance among CRC patients compared to healthy controls. However, the relationship between CRC and non-bacterial gut microbiome such as the gut virome is under-studied and not well understood. In this study we conducted a comprehensive analysis of the association of viral abundances with CRC using metagenomic shotgun sequencing data of 462 CRC subjects and 449 healthy controls from 7 studies performed in 8 different countries. Despite the high heterogeneity, our results showed that the virome alpha diversity was consistently higher in CRC patients than in healthy controls (p-value <0.001). This finding is in sharp contrast to previous reports of low alpha diversity of prokaryotes in CRC compared to healthy controls. In addition to the previously known association of Podoviridae, Siphoviridae and Myoviridae with CRC, we further demonstrate that Herelleviridae, a newly constructed viral family, is significantly depleted in CRC subjects. Our interkingdom association analysis reveals a less intertwined correlation between the gut virome and bacteriome in CRC compared to healthy controls. Furthermore, we show that the viral abundance profiles can be used to accurately predict CRC disease status (AUROC >0.8) in both within-study and cross-study settings. The combination of training sets resulted in rather generalized and accurate prediction models. Our study clearly shows that subjects with colorectal cancer harbor a distinct human gut virome profile which may have an important role in this disease.

Keywords: CRC prediction; colorectal cancer; gut virome; metagenomics; virus-host association.


Conflict of interest statement

The authors declare that the research was conducted in the absence of any commercial or financial relationships that could be construed as a potential conflict of interest.

Figures

Figure 1
Figure 1
Analysis of viral species Shannon diversity within each dataset. (A) Boxplots of viral species-level Shannon index for gut samples of CRC subjects and healthy controls stratified by disease status in each dataset. BH adjusted p-values were calculated using the two-tailed Wilcoxon rank-sum test. ns: p> 0.05, *p< 0.05, **p< 0.01, ***p< 0.001. (B) Multivariate analysis of the adjusted impact of age, gender and BMI on Shannon diversity. (C) Forest plot showing effect sizes from a meta-analysis on species-level diversity. RE Model: Random effect model.
Figure 2
Figure 2
Principal coordinates analysis of all samples based on Bray–Curtis distance. (A) PCoA plot of gut samples of CRC subjects and healthy controls in each dataset. R 2 values and p-values were calculated by PERMANOVA. (B) Boxplots of the first principal coordinates (PCo1) in each dataset. (C) Boxplots of the second principal coordinates (PCo2) in each dataset. BH adjusted p-values were calculated using the two-tailed Wilcoxon rank-sum test. ns:p> 0.05, *p< 0.05, **p< 0.01, ***p< 0.001, ****p< 0.0001. (D) Forest plot showing effect sizes from a meta-analysis on PCo1. (E) Forest plot showing effect sizes from a meta-analysis on PCo2. RE Model: Random effect model.
Figure 3
Figure 3
Differential abundance analysis on taxonomic and functional viral profiles. (A) UpSet plot showing the number of shared differentially abundant viral species determined by species-level TMM normalized abundance and DESeq2. Only viral species differentiated in at least 5 datasets were displayed. (B) UpSet plot showing the number of shared differentially abundant viral pathways determined by HUMAnN3 pathway abundance and DESeq2. (C) Heatmap showing the log transformed TMM normalized abundance of viral species differentiated in all 7 datasets. (D) Heatmap showing the log transformed HUMAnN3 pathway abundance of pathways differentiated in at least 3 datasets.
Figure 4
Figure 4
Correlations between viral families and bacterial species. (A) Random effect size of Spearman’s correlation coefficients between the diversity and richness of bacteria and viruses in healthy controls and CRC subjects. Correlations with BH adjusted p-values <0.05 are displayed. (B) Random effect size of Spearman’s correlation coefficients between the abundance of all 24 viral families and that of 27 differentially abundant bacterial species. Correlations with BH adjusted p-values <0.05 are displayed. The size and color of circles indicate the extent of correlation.
Figure 5
Figure 5
Prediction performances of random forest classifiers based on gut viral abundance. (A) Within and cross study AUROC matrix obtained by using GPD genome-level abundance. The diagonal refers to results of cross validation within each dataset. Off-diagonal values refer to prediction results trained on the study of each row and tested on the study of each column. (B) Within and cross study AUROC matrix obtained by using species-level abundance. See Supplementary Figures S12A, B for genus-level and family-level AUROC. (C) Within and cross study AUROC matrix obtained by using gene-family abundance. See Supplementary Figure S12C for pathway AUROC. (D) LODO results with the x axis indicating the study left out as the validation set and other studies combined as the training set.

References

    1. Almeida A., Nayfach S., Boland M., Strozzi F., Beracochea M., Shi Z. J., et al. . (2021). A Unified Catalog of 204,938 Reference Genomes From the Human Gut Microbiome. Nat. Biotechnol. 39 (1), 105–114. doi: 10.1038/s41587-020-0603-3 - DOI - PMC - PubMed
    1. Anderson M. J. (2001). A New Method for Non-Parametric Multivariate Analysis of Variance. Austral Ecol. 26 (1), 32–46. doi: 10.1111/j.1442-9993.2001.01070.pp.x - DOI
    1. Barylski J., Kropinski A. M., Alikhan N.-F, Adriaenssens E. M., Consortium, I. R (2020). Ictv Virus Taxonomy Profile: Herelleviridae. J. Gen. Virol. 101 (4), 362. doi: 10.1099/jgv.0.001392 - DOI - PMC - PubMed
    1. Beghini F., McIver L. J., Blanco-Míguez A., Dubois L., Asnicar F., Maharjan S., et al. . (2021). Integrating Taxonomic, Functional, and Strain-Level Profiling of Diverse Microbial Communities With Biobakery 3. Elife 10, e65088. doi: 10.7554/eLife.65088.sa2 - DOI - PMC - PubMed
    1. Benjamini Y., Hochberg Y. (1995). Controlling the False Discovery Rate: A Practical and Powerful Approach to Multiple Testing. J. R. Stat. Society: Ser. B. (Methodol.) 57 (1), 289–300. doi: 10.1111/j.2517-6161.1995.tb02031.x - DOI

Publication types