. 2022 Jun 16:12:877253.
doi: 10.3389/fcimb.2022.877253. eCollection 2022.

Differential Trafficking and Expression of PIR Proteins in Acute and Chronic Plasmodium Infections

Affiliations

Differential Trafficking and Expression of PIR Proteins in Acute and Chronic Plasmodium Infections

Maria Giorgalli et al. Front Cell Infect Microbiol. .

Abstract

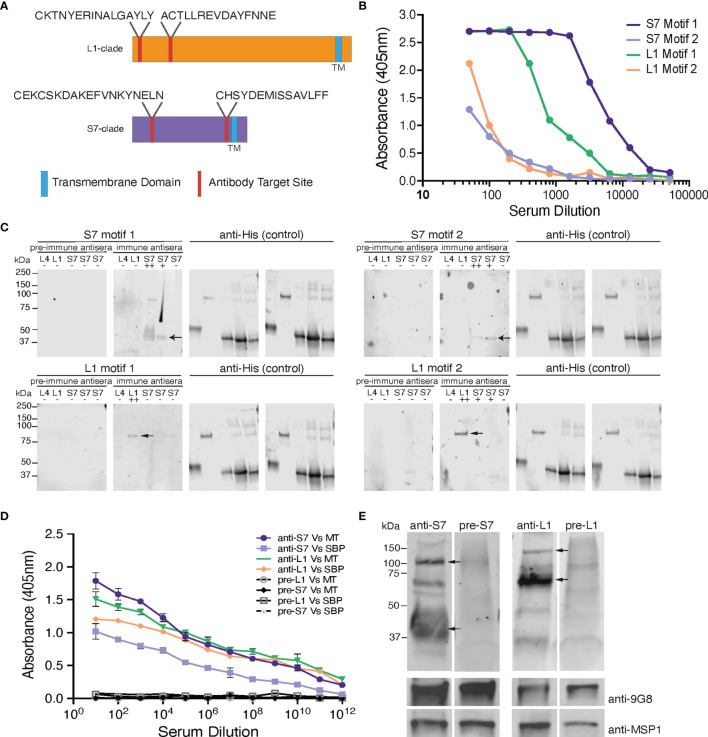
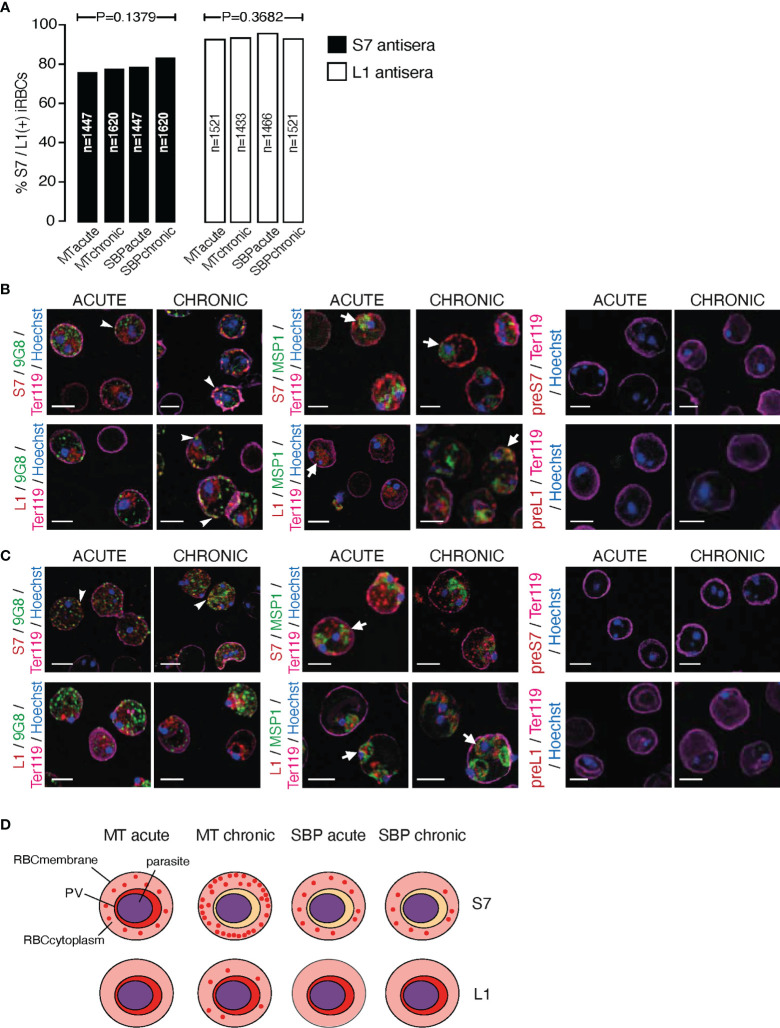
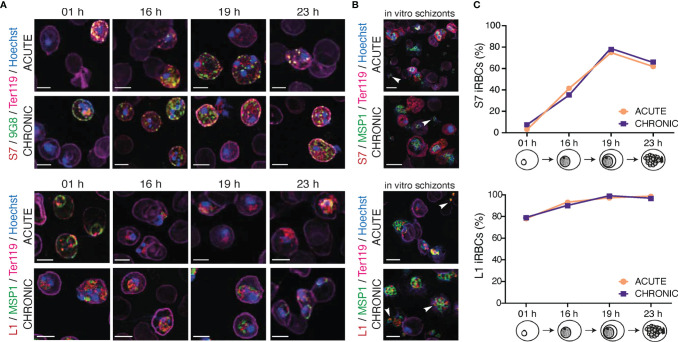
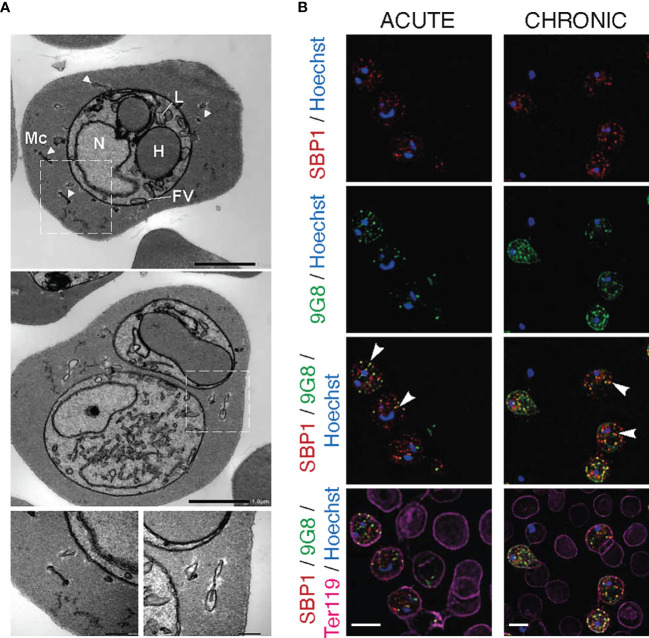
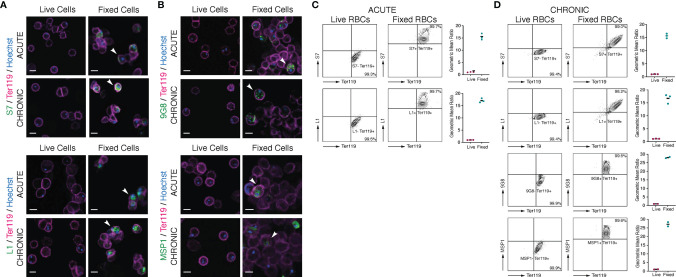
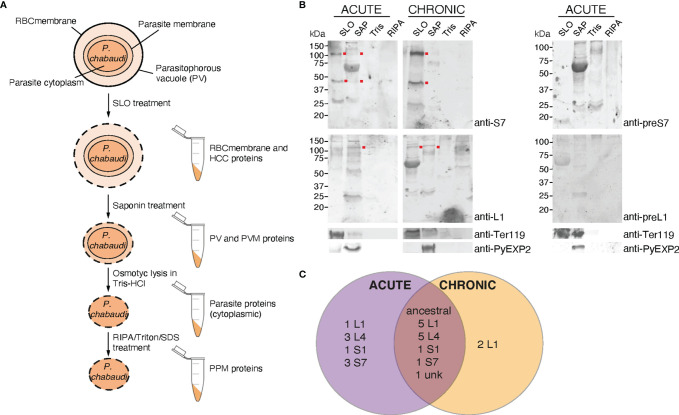
Plasmodium multigene families are thought to play important roles in the pathogenesis of malaria. Plasmodium interspersed repeat (pir) genes comprise the largest multigene family in many Plasmodium species. However, their expression pattern and localisation remain to be elucidated. Understanding protein subcellular localisation is fundamental to reveal the functional importance and cell-cell interactions of the PIR proteins. Here, we use the rodent malaria parasite, Plasmodium chabaudi chabaudi, as a model to investigate the localisation pattern of this gene family. We found that most PIR proteins are co-expressed in clusters during acute and chronic infection; members of the S7 clade are predominantly expressed during the acute-phase, whereas members of the L1 clade dominate the chronic-phase of infection. Using peptide antisera specific for S7 or L1 PIRS, we show that these PIRs have different localisations within the infected red blood cells. S7 PIRs are exported into the infected red blood cell cytoplasm where they are co-localised with parasite-induced host cell modifications termed Maurer's clefts, whereas L1 PIRs are localised on or close to the parasitophorous vacuolar membrane. This localisation pattern changes following mosquito transmission and during progression from acute- to chronic-phase of infection. The presence of PIRs in Maurer's clefts, as seen for Plasmodium falciparum RIFIN and STEVOR proteins, might suggest trafficking of the PIRs on the surface of the infected erythrocytes. However, neither S7 nor L1 PIR proteins detected by the peptide antisera are localised on the surface of infected red blood cells, suggesting that they are unlikely to be targets of surface variant-specific antibodies or to be directly involved in adhesion of infected red blood cells to host cells, as described for Plasmodium falciparum VAR proteins. The differences in subcellular localisation of the two major clades of Plasmodium chabaudi PIRs across the blood cycle, and the apparent lack of expression on the red cell surface strongly suggest that the function(s) of this gene family may differ from those of other multigene families of Plasmodium, such as the var genes of Plasmodium falciparum.

Keywords: Plasmodium; acute infection; chronic infection; malaria; multigene families; pir genes.


Conflict of interest statement

The authors declare that the research was conducted in the absence of any commercial or financial relationships that could be construed as a potential conflict of interest.

Figures

Figure 1
Figure 1
Design and validation of the anti-S7 and anti-L1 peptide antisera. (A) Schematic model of S7- and L1-clade proteins showing position of the designed target peptide motifs. One of the S7 target motifs is located towards the N-terminus of the S7 protein clade, while the other is located further towards the C-terminus. Both the target motifs identified in the L1 PIRs are located towards the N-terminus of the protein sequence. TM, Transmembrane Domain. (B) ELISA reactivity of the individual anti-S7 and anti-L1 peptide sera (anti-S7 motif 1 peptide antiserum, anti-S7 motif 2 peptide antiserum, anti-L1 motif 1 peptide antiserum, anti-L1 motif 2 peptide antiserum) against the target P. chabaudi PIR peptides that were used to immunise rabbits. ELISAs performed by Cambridge Research Biomedicals, and figure adapted from those supplied by Cambridge Research Biochemicals. (C) Western blot analysis of S7, L1 and L4 his-tagged recombinant proteins probed with the individual anti-S7 and anti-L1 peptide antisera. Migration of S7 proteins was between 33-37 kDa markers and of L1 proteins between the 75-150 kDa markers (arrows indicate monomers). Probing against the his-tag served as loading control. Pre-immune sera served as negative controls, where they were found to be unreactive and did not recognise any of the recombinant proteins, confirming the lack of pre-existing reactivity to PIRs in the rabbit serum. ++ denotes a protein that highly matches the sequence of the peptide motif that the sera were raised against; + denotes a protein that contains a similar peptide motif (50-60% alignment) to that used for raising the immune sera; - denotes a protein that it does not contain any of the anti-sera target motifs. The specific recombinant proteins loaded are the PCHAS_0600600 (L4), PCHAS_1100300 (L1), PCHAS_0400300 (S7), PCHAS_1200500 (S7) and PCHAS_1300101 (S7). (D) ELISA reactivity of the pooled anti-S7 and anti-L1 peptide sera (pooled motif 1 and 2 for each antiserum) against WT parasite lysates extracted from MT and SBP acute-stage parasites. Pre-immune serum served as negative control. OD 405 ± standard deviation of three replicate assays is shown. MT, Mosquito Transmitted; SBP, Serially Blood Passaged. (E) Western blot analysis of whole parasite lysates (reducing conditions) prepared from P. chabaudi MT WT parasites at the trophozoite-stage, using the anti-S7 and anti-L1 pooled peptide immune sera. Arrows indicate the estimated average size of the monomers or dimers of each PIR clade (S7 33-50 and 100 kDa; L1 75-150 kDa). Probing with the pre-immune sera served as negative control. Probing against the Plasmodium EXP2 was used as stage-specific and loading control. The molecular weights on the right indicate the positions to which size markers had migrated.
Figure 2
Figure 2
Subcellular localisation of S7 and L1 PIRs in the late trophozoite-stage of MT and SBP P. c. chabaudi AS parasites, during the acute- and chronic-phases of infection. (A) Percentage of MT and SBP S7-positive (dark grey) and L1-positive (light grey) parasitised erythrocytes, at the late trophozoite-stage. N represents the total number of iRBC analysed in three biological replicates. Data are presented as mean with SEM. Statistical significance was calculated using one-way Analysis Of Variance (ANOVA) tests (P < 0.05). (B, C) Immunofluorescence assays of MT (B) and SBP (C) WT P. chabaudi parasites at the late trophozoite-stage. Blood was isolated from C57Bl/6 RAG1-/- mice. Parasites were primarily stained with the anti-S7 or anti-L1 peptide sera (red), and later with the anti-clone 6 (9G8) or anti-MSP1 monoclonal antibodies (green). The white arrowheads indicate co-localisation of the S7s or L1s with 9G8, whereas the white arrows indicate co-localisation of the S7s and L1s with MSP1. Erythrocyte membrane was stained with the rat anti-Ter119 monoclonal antibody (magenta), and parasite nuclei were stained with Hoechst (blue). Staining with pre-immune sera was used as negative control (right panel). Images were taken from confocal sections of acetone:methanol fixed parasites at X630 magnification. Scale bar length corresponds to 5 μm. (D) Schematic representation summarising the results obtained following confocal imaging of MT and SBP P. chabaudi parasites. The localisation pattern of S7s and L1s across the acute- and chronic-phases of infection in MT and SBP parasites is indicated in red. RBCmembrane, Red Blood Cell Membrane; PV, Parasitophorous Vacuole.
Figure 3
Figure 3
Localisation pattern of S7 and L1 PIRs across the 24-hour asexual blood cycle of MT P. c. chabaudi AS parasites, during the acute- and chronic-phases of infection. (A, B) Immunofluorescence assays of MT WT P. chabaudi parasites at different developmental stages of their asexual blood cycle. WT mice were directly exposed to infected mosquitoes and following infection establishment, acute- (at day-7 post infection) or chronic-phase (at day-45 post infection) parasites were passaged into C57Bl/6 RAG1-/- mice. Upon infection establishment, blood tail smears were prepared for immunofluorescent staining at the ring (1 h), early trophozoite (16 h), mature trophozoite (19 h) (A), and late trophozoite/schizont (23 h) (B) developmental stages. Blood smears from in vitro schizont cultures, following five hours of culture, were also prepared. Parasites were primarily stained with the anti-S7 (top panels) or anti-L1 peptide sera (bottom panels) (red). S7-incubated slides were then probed with the anti-clone 6 (9G8) (green) antibody, whereas L1-incubated slides were probed with the anti-MSP1 monoclonal antibody (green). The RBC surface membrane was stained with an anti-Ter119 antibody (magenta), and parasite nuclei were stained with Hoechst (blue). Images were taken from confocal sections of acetone:methanol fixed parasites at X630 magnification. Asterisks indicate free merozoites. Scale bar length correspond to 5 μm. (C) Percentage of S7-positive (top panel) and L1-positive (bottom panel) iRBC throughout the 24-hour life cycle, in MT parasites during acute- and chronic-phases of infection. About 950-1,000 red blood cells were analysed across two individual biological replicates, where data are presented as mean.
Figure 4
Figure 4
Maurer’s clefts-like structures in P. c. chabaudi AS infected erythrocytes. (A) Transmission electron micrographs of a P. chabaudi MT acute phase trophozoite, inside a mouse erythrocyte. The white arrowheads indicate Maurer’s clefts within the iRBC cytosol. Insets show sections of the areas highlighted. Scale bar length corresponds to 1 μm and 0.2 μm in insets. FV, Food Vacuole; H, Haemoglobin Filled Compartment; L, Lipid Droplets; Mc, Maurer’s clefts; N, Nucleus. (B) Immunofluorescence assays of MT acute- (left panels) and chronic- (right panels) phase WT P. chabaudi parasites at the late trophozoite-stage. Blood was isolated from C57Bl/6 RAG1-/- mice. Parasites were primarily stained with the anti-PbSBP1 antibody (De Niz et al., 2016) (red) and then with the anti-clone 6 (9G8) monoclonal antibody (green). The RBC surface membrane was stained with the anti-Ter119 monoclonal antibody (magenta), and parasite nuclei were stained with Hoechst (blue). The white arrowheads indicate co-localisation of SBP1 with 9G8. Images were taken from confocal sections of acetone:methanol fixed parasites at X630 magnification. Scale bar length corresponds to 5 μm.
Figure 5
Figure 5
Localisation of S7 and L1 PIRs in live acute and chronic MT P. c. chabaudi AS parasitised erythrocytes. (A, B) Immunofluorescence staining of live (left panels) and acetone:methanol-fixed iRBC (right panels) of MT P. chabaudi parasites at the late trophozoite-stage, isolated from blood of C57Bl/6 RAG1-/- mouse during acute (at day-7 post infection) (upper panels) and chronic (at day-45 post infection) (lower panels) infection. (A) P. chabaudi parasites were stained with either anti-S7 or anti-L1 peptide antisera (green). (B) 9G8 (upper panels) or anti-MSP1 (lower panels) monoclonal antibodies, which recognise parasite antigens internal to the iRBC or parasite, were used as negative controls for live imaging and positive controls for imaging the acetone:methanol fixed iRBC. The RBC surface membrane was stained with anti-Ter119 antibody (magenta), and parasite nuclei were stained with Hoechst (blue). Staining with pre-immune rabbit serum was used as a negative control in the case of peptide antisera (data not shown). The white arrowheads in the panels with fixed iRBC indicate L1, S7, 9G8 or MSP1 positive cells. Images were taken from confocal sections of live and acetone:methanol fixed parasites at X630 magnification and are representative of a total of 500-600 iRBC imaged across two individual replicates. Scale bar length corresponds to 5 μm. (C, D) Live P. chabaudi iRBC at the acute- (C) and chronic- (D) phases of infection in C57Bl/6 WT mice were labelled with the anti-S7 or anti-L1 peptide antisera, and anti-Ter119 monoclonal antibody, and analysed using the Amnis® CellStream® Cytometer. Representative contour plots (of 2-3 mice) show the percentage of the iRBC population (Hoechst+/Ter119+) that is either positive or negative for anti-S7 or anti-L1 peptide antisera binding. The quadrant gate was set based on the anti-S7 or anti-L1 background signal detected in the Hoechst- RBC for each condition. Acetone:methanol fixed cells, which are also permeabilised, were used as a control to confirm antibody reactivity with P. chabaudi parasites. 9G8 or anti-MSP1 monoclonal antibodies were used as negative controls for live cells, and as a positive control for staining internal parasite proteins in fixed/permeabilised cells. The side plots show the ratio of the geometric mean fluorescence intensity (MFI) detected following binding of the anti-S7 or anti-L1 antibodies on Hoechst+ and Hoechst-, live and fixed (control) RBC. Higher ratios indicate presence and higher abundance of the investigated proteins in Hoechst+ compared to the Hoechst- cells. Ratio of around 1 indicates no difference in the fluorescence intensity of antibody binding (and therefore protein abundance) between the Hoechst+ and Hoechst- RBC. Three biological replicates (i.e., infected mice) were performed for antibody labelling of the S7 or L1 PIRs, whereas two replicates were conducted for antibody labelling with the 9G8 and anti-MSP1 monoclonal antibodies. Data for each individual mouse are presented in ( Supplementary Figure S5 ).
Figure 6
Figure 6
Subcellular fractionation of P. c. chabaudi AS iRBC and localisation pattern of the PIR proteins. (A) Schematic representation of the fractionation workflow used to map the subcellular localisation of P. chabaudi PIR proteins. Briefly, P. chabaudi iRBC at the trophozoite-stage were magnetically enriched and treated with SLO, prior to being centrifuged to obtain a supernatant and a pellet fraction. Proteins localised on the iRBC membrane and cytoplasm are expected to be found in the supernatant. The pellet was then treated with saponin to release all proteins localised on the PV and PVM. Following centrifugation, the resulting pellet was incubated with Tris-HCl hypotonic lysis buffer and frozen. Following osmotic shock of the cells, proteins localised within the parasite cytoplasm are expected to be released. The remaining parasite membrane-associated proteins were extracted by treating the resulting pellet with RIPA lysis buffer enriched with SDS and Triton. The lysed membrane following each treatment is represented by a dotted line. The composition of each pellet sample obtained is also indicated. RBCmembrane: Red Blood Cell membrane, PV; Parasitophorous Vacuole, PPM; Parasite Plasma Membrane, PVM; Parasitophorous Vacuole Membrane, HCC; Host-Cell Cytoplasm. (B) Western blot analysis of P. chabaudi trophozoite fractionated protein samples, under reducing conditions. Fractionated samples were prepared from infected blood of C57Bl/6 RAG1-/- mice during acute- and chronic-phases of infection. Red dots indicate the estimated average size of the monomers or dimers of each PIR clade (S7 33-37 kDa and L1 75-151 kDa). Probing with pre-immune sera served as negative control. Antibodies against the mouse erythroid-specific marker Ter119 and Plasmodium EXP2 were used as stage-specific controls as well as to assess the samples purity. The molecular weights on the right indicate the positions to which size markers had migrated. SLO, Streptolysin-O fraction; SAP, Saponin fraction; Tris, Tris-HCl lysis. (C) Venn diagram depicting the overlap between the PIR proteins identified by mass spectrometry in all fractionated samples prepared from acute- and chronic-stage P. chabaudi infected erythrocytes. All PIR proteins identified in each set of samples are listed in Tables 1 and 2 .

References

    1. Atkinson C. T., Aikawa M. (1990). Ultrastructure of Malaria-Infected Erythrocytes. Blood Cells 16 (2-3), 351–368. - PubMed
    1. Aurrecoechea C., Brestelli J., Brunk B. P., Dommer J., Fischer S., Gajria B., et al. . (2009). PlasmoDB: A Functional Genomic Database for Malaria Parasites. Nucleic Acids Res. 37, D539–D543. doi: 10.1093/nar/gkn814 - DOI - PMC - PubMed
    1. Baruch D. I., Gormely J. A., Ma C., Howard R. J., Pasloske B. L. (1996). Plasmodium Falciparum Erythrocyte Membrane Protein 1 is a Parasitised Erythrocyte Receptor for Adherence to CD36, Thrombospondin, and Intercellular Adhesion Molecule 1. Proc. Natl. Acad. Sci. U.S.A. 93 (8), 3497–3502. doi: 10.1073/pnas.93.8.3497 - DOI - PMC - PubMed
    1. Beck J. R., Muralidharan V., Oksman A., Goldberg D. E. (2014). PTEX Component HSP101 Mediates Export of Diverse Malaria Effectors Into Host Erythrocytes. Nature 511 (7511), 592–595. doi: 10.1038/nature13574 - DOI - PMC - PubMed
    1. Blisnick T., Morales-Betoulle M. E., Barale J. C., Uzureau P., Berry L., Desroses S., et al. . (2000). Pfsbp1, a Maurer's Cleft Plasmodium Falciparum Protein, is Associated With the Erythrocyte Skeleton. Mol. Biochem. Parasitol. 111 (1), 107–121. doi: 10.1016/s0166-6851(00)00301-7 - DOI - PubMed

Publication types