. 2022 Jul 1:8:72.
doi: 10.1038/s41378-022-00404-z. eCollection 2022.

Widely accessible method for 3D microflow mapping at high spatial and temporal resolutions

Affiliations

Widely accessible method for 3D microflow mapping at high spatial and temporal resolutions

Evan Lammertse et al. Microsyst Nanoeng. .

Abstract

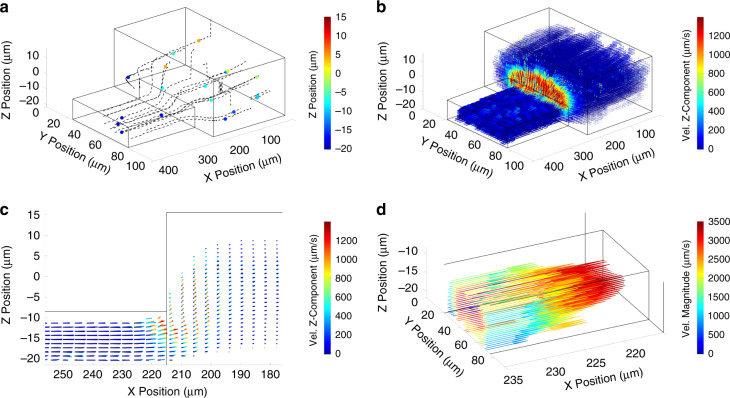
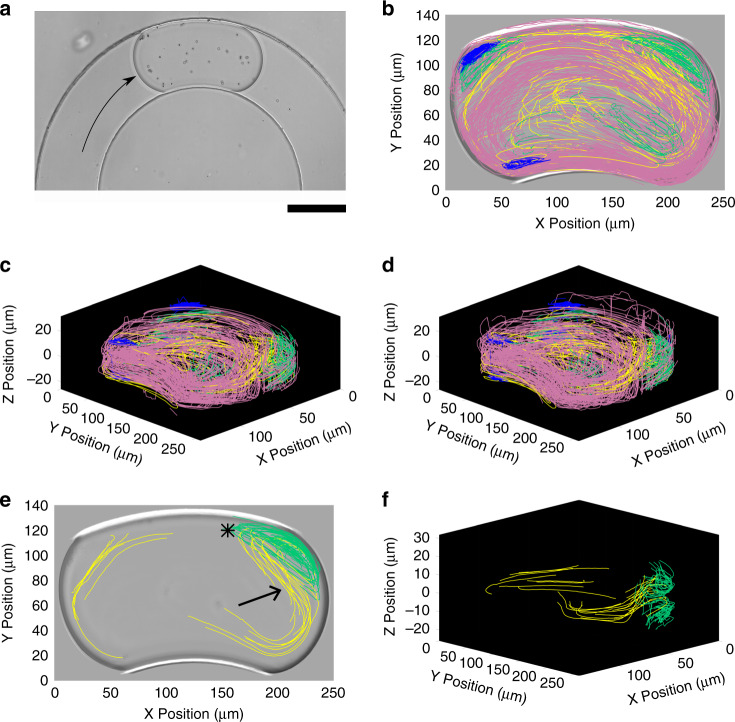
Advances in microfluidic technologies rely on engineered 3D flow patterns to manipulate samples at the microscale. However, current methods for mapping flows only provide limited 3D and temporal resolutions or require highly specialized optical set-ups. Here, we present a simple defocusing approach based on brightfield microscopy and open-source software to map micro-flows in 3D at high spatial and temporal resolution. Our workflow is both integrated in ImageJ and modular. We track seed particles in 2D before classifying their Z-position using a reference library. We compare the performance of a traditional cross-correlation method and a deep learning model in performing the classification step. We validate our method on three highly relevant microfluidic examples: a channel step expansion and displacement structures as single-phase flow examples, and droplet microfluidics as a two-phase flow example. First, we elucidate how displacement structures efficiently shift large particles across streamlines. Second, we reveal novel recirculation structures and folding patterns in the internal flow of microfluidic droplets. Our simple and widely accessible brightfield technique generates high-resolution flow maps and it will address the increasing demand for controlling fluids at the microscale by supporting the efficient design of novel microfluidic structures.

Keywords: Applied optics; Engineering.


Conflict of interest statement

Competing interestsThe authors declare no competing interests.

Figures

Fig. 1
Fig. 1. Brightfield defocusing strategy.
a TrackMate, an ImageJ plugin, detects beads as “spots” (purple circles, n = 14) from high-speed video frames. It links spots from consecutive frames into 2D tracks (not shown here). b Particle coordinates are extended to 3D by image classification against a reference library of defocus patterns at known Z-location using either a cross-correlation algorithm or a deep learning model. Both approaches provide continuous positions based on discrete classes in the reference image set
Fig. 2
Fig. 2. Method accuracy using synthetic images.
Accuracy (σ) in X, Y, and Z is reported as the RMSE between predicted and actual coordinates across the n = 110 Z-levels comprising the working range. The deep learning model (in red) shows an improved σ (0.41 µm) over the cross-correlation algorithm (in black, 0.63 µm)
Fig. 3
Fig. 3. Flow maps at a channel step using the cross-correlation algorithm.
Vectors sourced from n = 79,814 spots across 701 pathlines with a median length of 121 spots. a Isometric view of 14 selected individual pathlines. b Isometric view of the lattice-averaged 3D velocity vector field using a 4 µm × 2 µm × 1 µm element size. c XZ planar side view of the velocity field. Vector length codes for the velocity magnitude and color codes for the value of its Z-component. d Parabolic velocity profile characteristic of a Poiseuille flow observed upstream of the channel step
Fig. 4
Fig. 4. Mapping the flow generated by displacement structures.
a 3D view (Top) and cross-section (Bottom) of the displacement structures. They include jagged overhangs that displace large particles towards the opposite wall and a particle exclusion section that diverts only fluid to maintain large particles displaced. b Isometric view of n = 22,151 spots across 262 pathlines that highlight wave-like flow between jagged structures. c Top view projection of 4 stereotypical trajectories overlaid onto a micrograph of the displacement structures. d Magnified views of these 4 pathlines that underline the dramatic changes in depth of the Type 1 (Left, cross), Type 2 (Middle, circle), and Types 3 and 4 trajectories (Right, triangles) caused by the structures. Scalebars represent 25 µm
Fig. 5
Fig. 5. Droplets in a straight channel (pathlines) from the Corrected dataset.
Data represent n = 23,521 spots across 305 pathlines with a median length of 79 spots (the Auto dataset contains 22,172 spots across 370 pathlines with a median length of 76 spots). Recirculation flows are manually colored to distinguish topological patterns: large recirculation pathlines in pink; corner vortices in green; transition between red and green flows in yellow; small vortices in vertical extremes of endcaps in blue. a A 1.1 nL droplet with sparse seed particles flowing in a straight channel of 120 μm wide and 38 μm deep cross-section. The scale bar represents 100 μm. b Top-down projection of pathlines onto the XY plane. c, d Front end view of 3D pathlines obtained by the cross-correlation algorithm c and the deep learning model d. e, f Isometric views of 3D pathlines generated with the cross-correlation algorithm e and the deep learning model f.
Fig. 6
Fig. 6. Droplets in a straight channel (velocity field).
XY Planar views of the lattice averaged velocity vector field with an element size of 4 µm × 2 µm × 4 µm (ΔX, ΔY, ΔZ). Average vectors are color-coded for magnitude. Maps were generated from a total of n = 23,216 instantaneous velocity vectors from the Corrected dataset. a, b Velocity fields generated by the cross-correlation algorithm at Z = 1.2 µm and Z = 13.2 µm respectively. c, d Velocity fields generated by the deep learning model at Z = 1.2 µm and Z = 13.2 µm respectively.
Fig. 7
Fig. 7. Droplets in a curved channel (pathlines) from the Corrected dataset.
Data represent n = 25,738 spots across 1,270 pathlines with a median length of 17 spots (the Auto dataset contains 23,225 spots across 1,365 pathlines with a median length of 12 spots). The coloring scheme is similar to Fig. 5. a A 1.1 nL droplet with sparse seed particles flowing into a curved channel of radii 190 μm and 310 μm, and a 120 μm wide and 38 μm deep cross-section. The scale bar represents 100 µm. b Top-down projection of pathlines. c, d Isometric views of pathlines generated by the cross-correlation algorithm c and deep learning model d. e Top-down projection of pathlines highlighting the folding shape of the transition pathlines (yellow) and their relationship with the top vortex (green). f Isometric view of the transition pathlines that highlights their 3D folding shape. Data shown are generated with the cross-correlation approach.
Fig. 8
Fig. 8. Droplets in a curved channel (velocity field).
Lattice averaged velocity vector fields processed with the deep learning model (see SI Appendix, Fig. S8 for cross-correlation results). Maps were generated from a total of n = 24,226 instantaneous velocity vectors from the Corrected dataset. a, b XY planar fields at a Z = 1.2 µm and b Z = 13.2 µm with an element size of 4 µm × 2 µm × 4 µm dimensions. Color codes for the velocity vector magnitude. c, d Same data as panels a and b with a smaller element size of 2 µm × 1 µm × 4 µm dimension. The data better highlight the flow folding close to the midplane (dashed lines in in panel c). e, f Isometric views of the 3D velocity field where color codes for the vector magnitude and codes for velocity out-of-plane (w) component respectively.

References

    1. Poelma C, Vennemann P, Lindken R, Westerweel J. In vivo blood flow and wall shear stress measurements in the vitelline network. Exp. Fluids. 2008;45:703–713. doi: 10.1007/s00348-008-0476-6. - DOI
    1. Bown MR, Meinhart CD. AC electroosmotic flow in a DNA concentrator. Microfluidics Nanofluidics. 2006;2:513–523. doi: 10.1007/s10404-006-0097-4. - DOI
    1. Koutsiaris AristotleG, Microscope DSMaST. PIV for velocity-field measurement of particle suspensions flowing inside glass capillaries. Meas. Sci. Technol. 1999;10:1037–1046. doi: 10.1088/0957-0233/10/11/311. - DOI
    1. Oishi M, Kinoshita H, Fujii T, Oshima M. Simultaneous measurement of internal and surrounding flows of a moving droplet using multicolour confocal micro-particle image velocimetry (micro-PIV) Meas. Sci. Technol. 2011;22:105401. doi: 10.1088/0957-0233/22/10/105401. - DOI
    1. Ma S, Sherwood JM, Huck WTS, Balabani S. On the flow topology inside droplets moving in rectangular microchannels. Lab Chip. 2014;14:3611–3620. doi: 10.1039/C4LC00671B. - DOI - PubMed