. 2022 Jun 26:13:20417314221108791.
doi: 10.1177/20417314221108791. eCollection 2022 Jan-Dec.

Tissue-engineered composite tracheal grafts create mechanically stable and biocompatible airway replacements

Affiliations

Tissue-engineered composite tracheal grafts create mechanically stable and biocompatible airway replacements

Lumei Liu et al. J Tissue Eng. .

Abstract

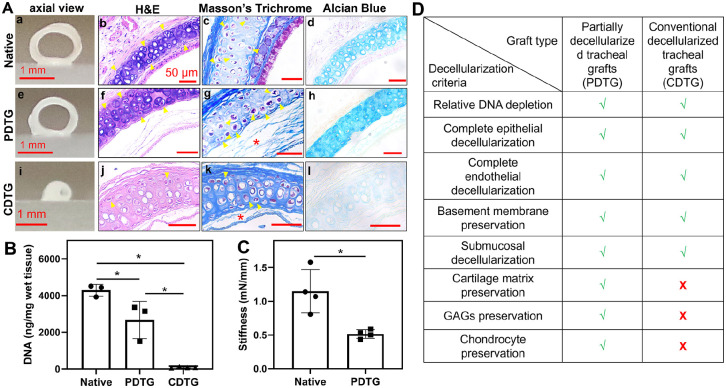
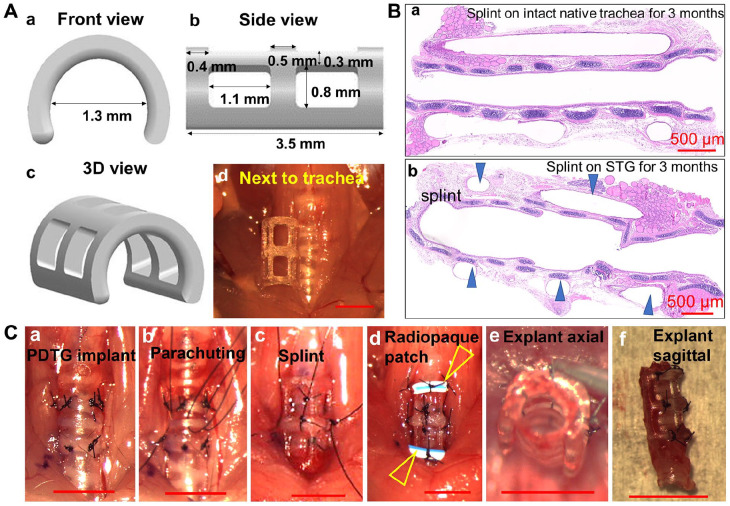
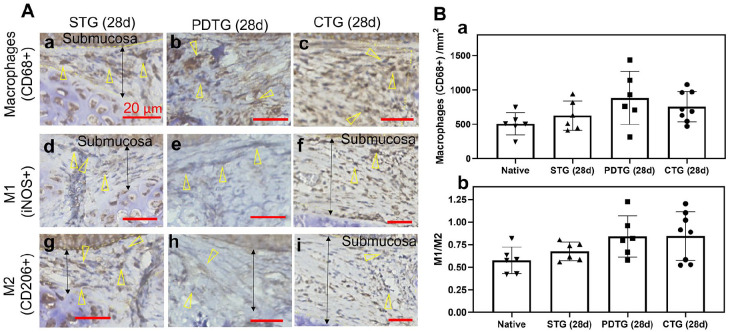
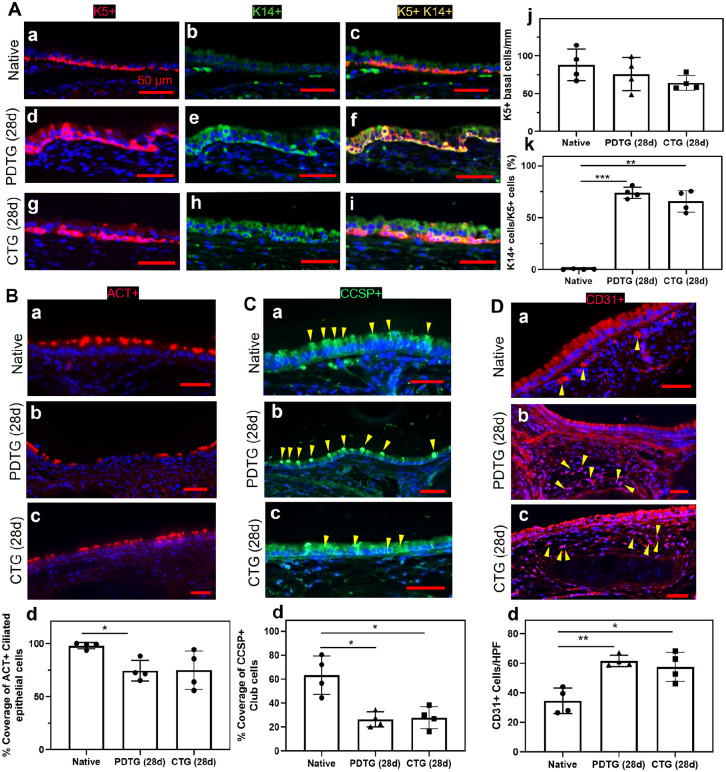
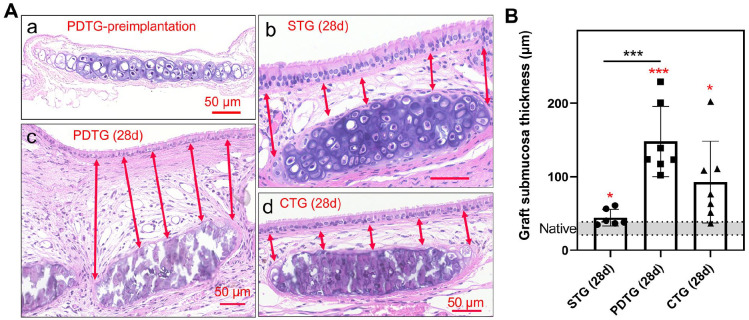
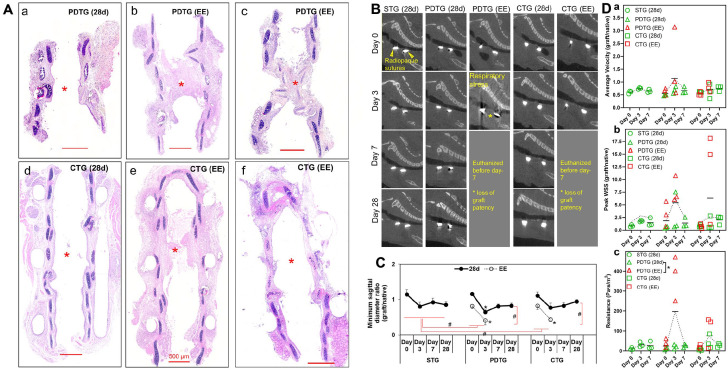
We tested composite tracheal grafts (CTG) composed of a partially decellularized tracheal graft (PDTG) combined with a 3-dimensional (3D)-printed airway splint for use in long-segment airway reconstruction. CTG is designed to recapitulate the 3D extracellular matrix of the trachea with stable mechanical properties imparted from the extraluminal airway splint. We performed segmental orthotopic tracheal replacement in a mouse microsurgical model. MicroCT was used to measure graft patency. Tracheal neotissue formation was quantified histologically. Airflow dynamic properties were analyzed using computational fluid dynamics. We found that CTG are easily implanted and did not result in vascular erosion, tracheal injury, or inflammation. Graft epithelialization and endothelialization were comparable with CTG to control. Tracheal collapse was absent with CTG. Composite tracheal scaffolds combine biocompatible synthetic support with PDTG, supporting the regeneration of host epithelium while maintaining graft structure.

Keywords: 3D-printed splint; Composite tracheal graft; partially decellularized tracheal scaffold; tissue regeneration; tracheal collapse.


Conflict of interest statement

Declaration of conflicting interests: The author(s) declared no potential conflicts of interest with respect to the research, authorship, and/or publication of this article.

Figures

Figure 1.
Figure 1.
The impact of decellularization on graft composition, histology, and biomechanics. (A) Gross axial images of grafts (a, e, and i), H&E (b, f, and j), Masson’s Trichrome (collagen), and Alcian blue (GAG) of native trachea (control) (a–d), PDTG (e–h), and CDTG (i–l). (B) DNA amount (ng/mg) in native trachea, PDTG, and CDTG; * represent significant decrease of DNA amount (p = 0.0296 for native vs PDTG, p < 0.0001 for native vs CDTG, p = 0.0202 for PDTG vs CDTG). (C) tracheal stiffness (mN/mm) of native trachea and PDTG. * denote lower stiffness of PDTG than native trachea (p = 0.0266, testing was not feasible for the CDTG group due to complete collapse). (D) Metrics assessed in PDTG and CDTG.
Figure 2.
Figure 2.
Splint, PDTG, and CTG implantation. (A) Rendering of splint design in front (a) and side view (b), 3D view (c), and approximation of mouse trachea (d). (B) Representative H&E images of splint implantation for 3 months to demonstrate a lack of chronic inflammation on the native trachea (a) and STG (b). Arrowheads denote the splint. (C) PDTG and CTG implantation procedure (a–d), and the axial (e) and sagittal (f) view of CTG following explanation at day 0.
Figure 3.
Figure 3.
Macrophage infiltration and phenotype. (A) Infiltration of CD68+ macrophage (a–c), iNOS+ macrophage (d–f) and CD206+ macrophage (g–i) in STG (28d), PDTG (28d), and CTG (28d). Arrowheads denote CD68+, iNOS+, and CD206+ macrophages; arrows denote representative regions of submucosa where the cell number was quantified. (B) Quantification of macrophage (CD68+) infiltration in submucosa (a) and macrophage phenotype ratio (b).
Figure 4.
Figure 4.
Epithelialization and endothelialization. (A) Representative images (a–i) and quantification (j and k) of basal cells (K5+K14+) in native trachea, PDTG, and CTG. * denotes a higher ratio of K5+K14+ basal cells over K5+ basal cells in DTS (28d) than native (p = 0.0001) and in CTG (28d) than native (p = 0.0010). (B) Representative ACT+ ciliated basal cell images (a–c) and quantification (d) of native trachea, PDTG (28d), and CTG (28d); * denotes lower ciliated basal cell coverage in PDTG (28d) than native trachea (p = 0.0035). (C) Representative club cell (CCSP+) images (a–c) and quantification (d) of native trachea, PDTG (28d) and CTG (28d); * denotes lower club cell coverage in PDTG (28d) and CTG (28d) than native trachea (p = 0.0051 and 0.0085). (D) Representative endothelial cell (CD31+) images (a–c) and quantification (d) of native trachea, PDTG (28d) and CTG (28d); * denotes lower higher endothelial cell regeneration in PDTG (28d) and CTG (28d) than native trachea (p = 0.0012 and 0.0126).
Figure 5.
Figure 5.
Histological analysis of submucosa thickness. (A) Representative H&E images of the submucosa region over one cartilage ring. (a) Preimplanted PDTG, (b) STG at day 28, (c) PDTG at day 28, (d) CTG at day 28. Arrows denote 5 measured submucosa thicknesses over one cartilage ring. (B) Quantification of submucosa thickness. * denotes higher submucosa thickness compared to native (p = 0.0265 for STG (28d), 0.0004 for PDTG (28d), 0.0195 for CTG (28d)), and significant higher submucosa thickness in PDTG than STG (p = 0.0010).
Figure 6.
Figure 6.
Graft patency and CFD characterization with time. (A) Representative H&E images of PDTG (28d) (a), PDTG (requiring Early Euthanasia, EE) (b and c), CTG (28d) (d), and CTG (EE) (e and f). * denote the graft patency in PDTG (28d) and CTG (28d), and stenosis in CTG (28d) and CTG (EE). (B) Representative sagittal reconstructions of microCT images of STG (28d), PDTG (28d), PDTG (EE), CTG (28d), and CTG (EE) at days 0, 3, 7, and 28. Yellow arrowheads highlight radiopaque sutures that identify the proximal (left) and distal anastomosis (right). A yellow asterisk denotes loss of graft patency. (C) Quantification of the sagittal diameter of the graft normalized by comparing to a corresponding host native airway sagittal diameter. * represent decreased sagittal diameter at day 3 compared to day 0 of PDTG (28d), PDTG (EE), and CTG (EE) (p < 0.0001, p = 0.0256 and 0.0212, respectively). # represent the significant overall lower sagittal diameter of PDTG (EE) than PDTG (28d) (p = 0.0012), CTG (EE) than CTG (28d) (p = 0.0047), PDTG (EE) than STG (28d) (p = 0.0002), CTG (EE) than STG (28d) (p = 0.0019). (D) CFD modeling of tracheal graft airflow metrics including: (a) average velocity, (b) peak wall shear stress, (c) resistance (Pa·s/m2); * denotes higher resistance in PDTG (28d) compared to PDTG (EE) (p = 0.0313).

References

    1. Kolb F, Simon F, Gaudin R, et al. 4-Year follow-up in a child with a total autologous tracheal replacement. New Engl J Med 2018; 378: 1355–1357. - PubMed
    1. Martinod E, Chouahnia K, Radu DM, et al. Feasibility of bioengineered tracheal and bronchial reconstruction using stented aortic matrices. JAMA 2018; 319: 2212–2222. - PMC - PubMed
    1. Delaere P, Lerut T, Van Raemdonck D. Tracheal transplantation: state of the art and key role of blood supply in its success. Thorac Surg Clin 2018; 28: 337–345. - PubMed
    1. Chiang T, Pepper V, Best C, et al. Clinical translation of tissue engineered trachea grafts. Ann Otol Rhinol Laryngol 2016; 125: 873–885. - PMC - PubMed
    1. Hodde JP, Badylak SF, Brightman AO, et al. Glycosaminoglycan content of small intestinal submucosa: a bioscaffold for tissue replacement. Tissue Eng 1996; 2: 209–217. - PubMed

LinkOut - more resources