

Rotational Mechanism of FO Motor in the F-Type ATP Synthase Driven by the Proton Motive Force
- PMID: 35783438
- PMCID: PMC9243769
- DOI: 10.3389/fmicb.2022.872565
Rotational Mechanism of FO Motor in the F-Type ATP Synthase Driven by the Proton Motive Force
Abstract
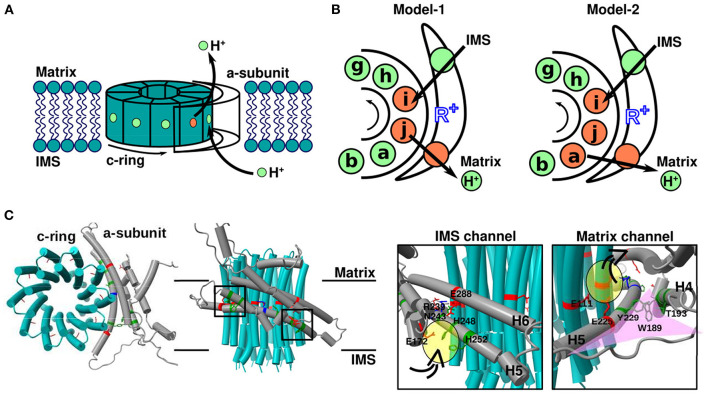
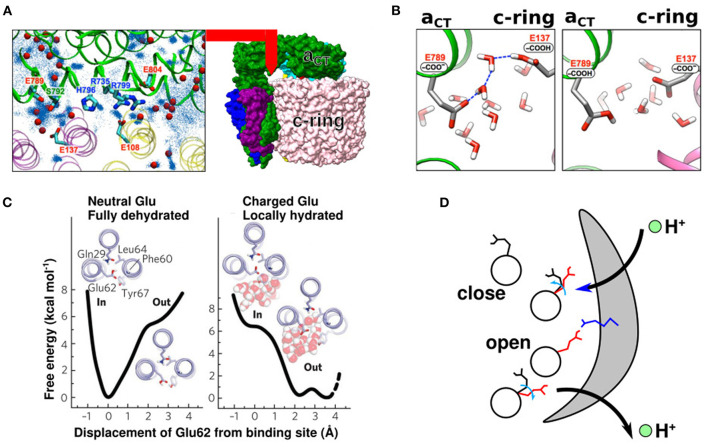
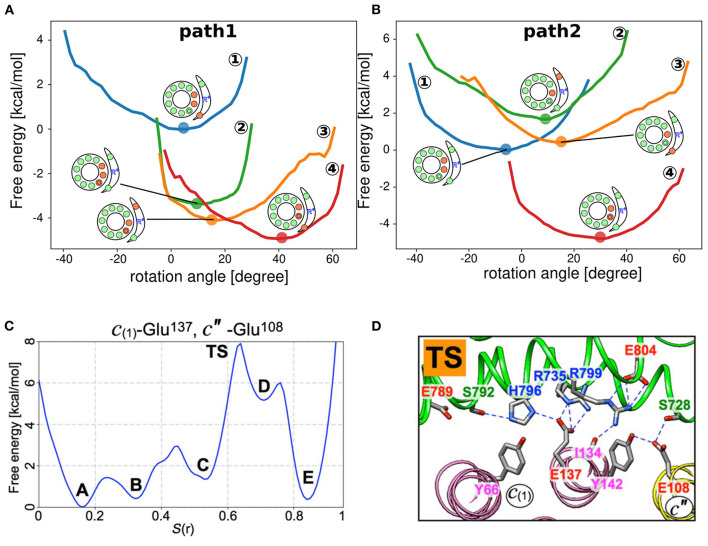
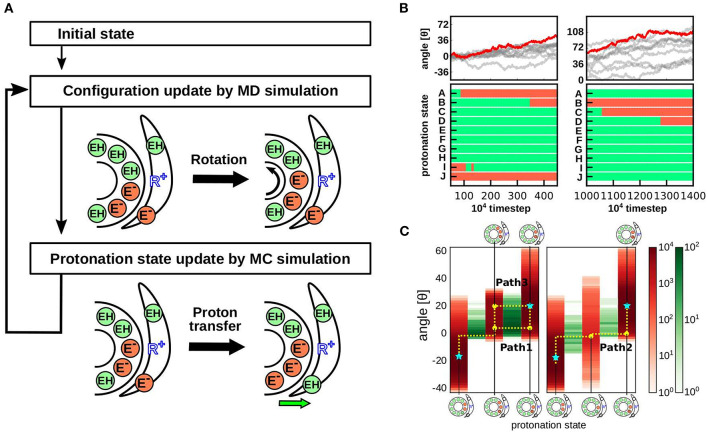
In FOF1 ATP synthase, driven by the proton motive force across the membrane, the FO motor rotates the central rotor and induces conformational changes in the F1 motor, resulting in ATP synthesis. Recently, many near-atomic resolution structural models have been obtained using cryo-electron microscopy. Despite high resolution, however, static information alone cannot elucidate how and where the protons pass through the FO and how proton passage is coupled to FO rotation. Here, we review theoretical and computational studies based on FO structure models. All-atom molecular dynamics (MD) simulations elucidated changes in the protonation/deprotonation of glutamate-the protein-carrier residue-during rotation and revealed the protonation states that form the "water wire" required for long-range proton hopping. Coarse-grained MD simulations unveiled a free energy surface based on the protonation state and rotational angle of the rotor. Hybrid Monte Carlo and MD simulations showed how proton transfer is coupled to rotation.
Keywords: FO motor; FOF1 ATP synthases; Monte Carlo simulations; coarse-grained model; molecular dynamics simulations.
Copyright © 2022 Kubo and Takada.
Conflict of interest statement
The authors declare that the research was conducted in the absence of any commercial or financial relationships that could be construed as a potential conflict of interest.
Figures
Similar articles
-
Molecular dynamics simulation of proton-transfer coupled rotations in ATP synthase FO motor.Sci Rep. 2020 May 19;10(1):8225. doi: 10.1038/s41598-020-65004-1. Sci Rep. 2020. PMID: 32427921 Free PMC article.
-
FO-F1 coupling and symmetry mismatch in ATP synthase resolved in every FO rotation step.Biophys J. 2023 Jul 25;122(14):2898-2909. doi: 10.1016/j.bpj.2022.09.034. Epub 2022 Sep 28. Biophys J. 2023. PMID: 36171725 Free PMC article.
-
F1FO ATP synthase molecular motor mechanisms.Front Microbiol. 2022 Aug 23;13:965620. doi: 10.3389/fmicb.2022.965620. eCollection 2022. Front Microbiol. 2022. PMID: 36081786 Free PMC article. Review.
-
Directed proton transfer from Fo to F1 extends the multifaceted proton functions in ATP synthase.Biophys Rev. 2023 Sep 21;15(5):859-873. doi: 10.1007/s12551-023-01132-y. eCollection 2023 Oct. Biophys Rev. 2023. PMID: 37975013 Free PMC article. Review.
-
Rotary substates of mitochondrial ATP synthase reveal the basis of flexible F1-Fo coupling.Science. 2019 Jun 21;364(6446):eaaw9128. doi: 10.1126/science.aaw9128. Epub 2019 Jun 20. Science. 2019. PMID: 31221832
Cited by
-
Current Trends and Changes in Use of Membrane Molecular Dynamics Simulations within Academia and the Pharmaceutical Industry.Membranes (Basel). 2023 Jan 24;13(2):148. doi: 10.3390/membranes13020148. Membranes (Basel). 2023. PMID: 36837651 Free PMC article. Review.
-
Mechanism of proton-powered c-ring rotation in a mitochondrial ATP synthase.Proc Natl Acad Sci U S A. 2024 Mar 12;121(11):e2314199121. doi: 10.1073/pnas.2314199121. Epub 2024 Mar 7. Proc Natl Acad Sci U S A. 2024. PMID: 38451940 Free PMC article.
-
Symmetry breaking and mismatch in the torsional mechanism of ATP synthesis by FOF1-ATP synthase: mathematical number theory proof and its chemical and biological implications.Theory Biosci. 2025 Feb;144(1):81-93. doi: 10.1007/s12064-024-00434-3. Epub 2024 Dec 22. Theory Biosci. 2025. PMID: 39709580
-
Molecular Dynamics Simulations of the Mutated Proton-Transferring a-Subunit of E. coli FoF1-ATP Synthase.Int J Mol Sci. 2024 May 9;25(10):5143. doi: 10.3390/ijms25105143. Int J Mol Sci. 2024. PMID: 38791189 Free PMC article.
-
Neuronal GPCR NMUR-1 regulates energy homeostasis in response to pathogen infection.bioRxiv [Preprint]. 2024 Jul 13:2024.07.09.602733. doi: 10.1101/2024.07.09.602733. bioRxiv. 2024. PMID: 39026696 Free PMC article. Preprint.
References
-
- Baptista A. M., Teixeira V. H., Soares C. M. (2002). Constant-pH molecular dynamics using stochastic titration. J. Chem. Phys. 117, 4184–4200. 10.1063/1.1497164 - DOI
-
- Bennett C. H.. (1976). Efficient estimation of free energy differences from Monte Carlo data. J. Comput. Phys. 22, 245–268. 10.1016/0021-9991(76)90078-4 - DOI
Publication types
LinkOut - more resources
Full Text Sources
Other Literature Sources