

The duration of spontaneous active and pushing phases of labour among 75,243 US women when intervention is minimal: A prospective, observational cohort study
- PMID: 35783483
- PMCID: PMC9249551
- DOI: 10.1016/j.eclinm.2022.101447
The duration of spontaneous active and pushing phases of labour among 75,243 US women when intervention is minimal: A prospective, observational cohort study
Abstract
Background: Friedman's curve, despite acknowledged limitations, has greatly influenced labour management. Interventions to hasten birth are now ubiquitous, challenging the contemporary study of normal labour. Our primary purpose was to characterise normal active labour and pushing durations in a large, contemporary sample experiencing minimal intervention, stratified by parity, age, and body mass index (BMI).
Methods: This is a secondary analysis of the national, validated Midwives Alliance of North America 4·0 (MANA Stats) data registry (n = 75,243), prospectively collected between Jan 1, 2012 and Dec 31, 2018 to describe labour and birth in home and birth center settings where common obstetric interventions [i.e., oxytocin, planned cesarean] are not available. The MANA Stats cohort includes pregnant people who intended birth in these settings and prospectively collects labour and birth processes and outcomes regardless of where birth or postpartum care ultimately occurs. Survival curves were calculated to estimate labour duration percentiles (e.g. 10th, 50th, 90th, and others of interest), by parity and sub-stratified by age and BMI.
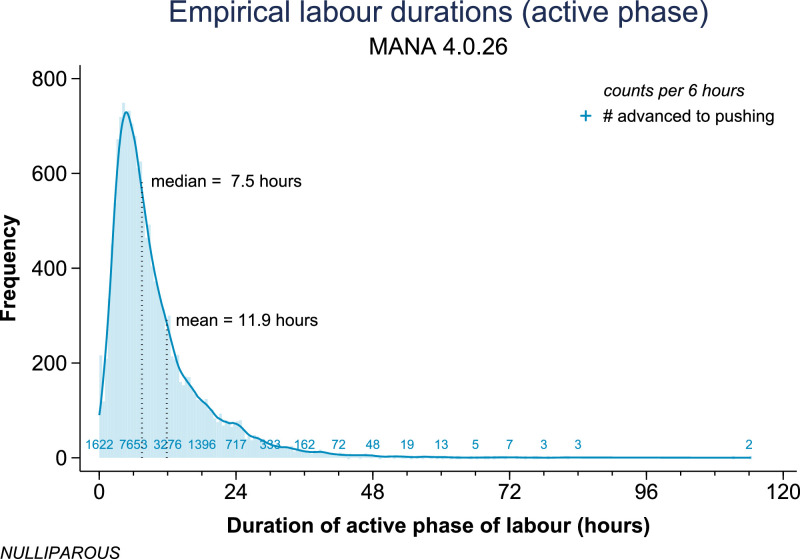
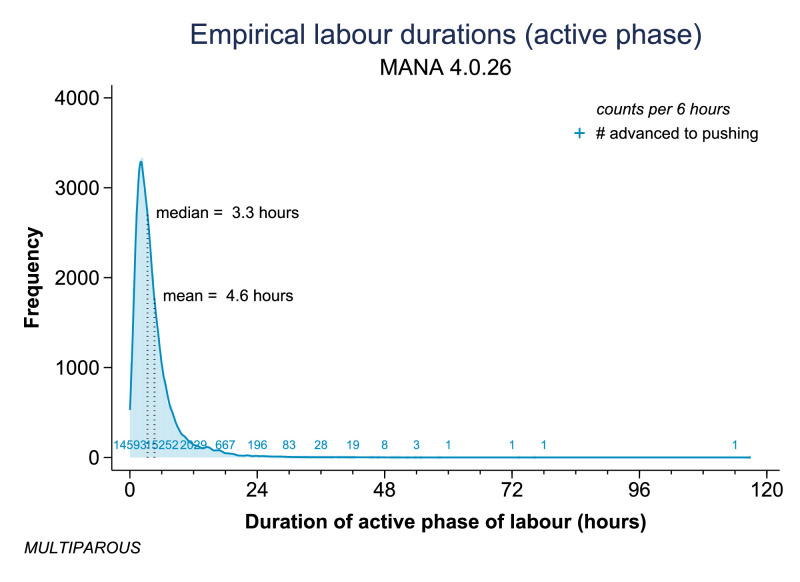
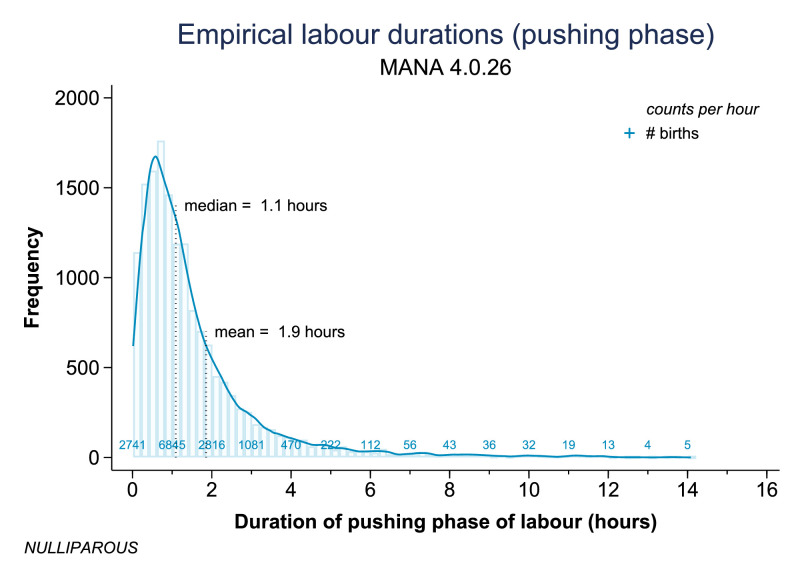
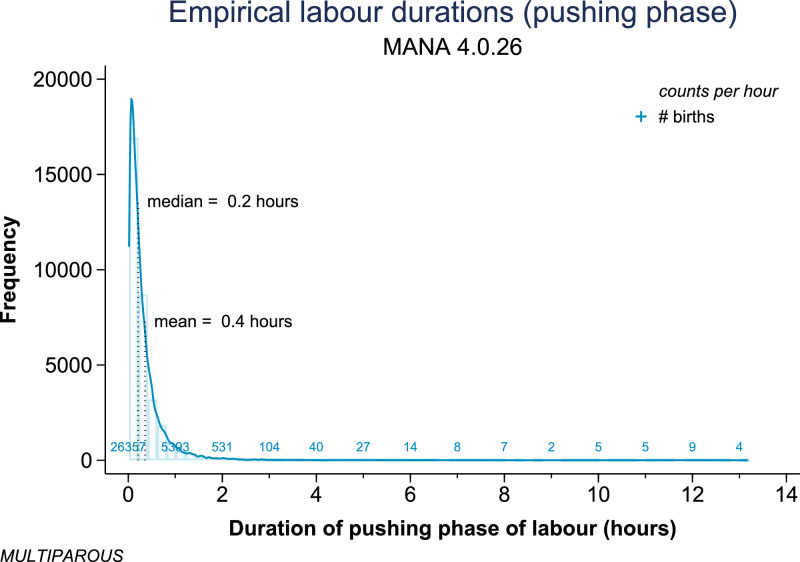
Findings: Compared to multiparous women (n = 32,882), nulliparous women (n = 15,331) had significantly longer active labour [e.g., median 7.5 vs. 3.3 h; 95th percentile 34.8 vs. 12.0 h] and significantly longer pushing phase [e.g., median 1.1 vs. 0.2 h; 95th percentile 5.5 vs. 1.1 h]. Among nulliparous women, maternal age >35 was associated with longer active first stage of labour and longer pushing phase, and BMI >30 kg/m² was associated with a longer active first stage of labour but a shorter pushing phase. Patterns among multiparous women were different, with those >35 years of age experiencing a slightly more rapid active labour and no difference in pushing duration, and those with BMI >30 kg/m² experiencing a slightly longer active labour but, similarly, no difference in pushing duration.
Interpretation: Nulliparous women had significantly longer active first stage and pushing phase durations than multiparous women, with further variation noted by age and by BMI. Contemporary US women with low-risk pregnancies who intended birth in settings absent common obstetric interventions and in spontaneous labour with a live, vertex, term, singleton, non-anomalous fetus experienced labour durations that were often longer than prior characterizations, particularly among nulliparous women. Results overcome prior and current sampling limitations to refine understanding of normal labour durations and time thresholds signaling 'labour dystocia'.
Funding: OHSU Nursing Innovation and OHSU University Shared Resources.
Keywords: Labour duration; Labour dystocia; Labour progress; Prolonged labour.
© 2022 The Author(s).
Conflict of interest statement
ET declares the following interests: Co-Owner and Chief Scientific Officer for CenterMom, Inc. She has stock ownership in this company. Consultant and Director of Maternity Care for Stork Club, Inc. She receives payment for her work with Stork Club. JS, MC, MB, JL, JW, and AC have nothing to disclose.
Figures
Similar articles
-
Latent phase duration and associated outcomes: a contemporary, population-based observational study.Am J Obstet Gynecol. 2023 May;228(5S):S1025-S1036.e9. doi: 10.1016/j.ajog.2022.10.003. Epub 2023 Mar 15. Am J Obstet Gynecol. 2023. PMID: 37164487 Free PMC article.
-
Progression of the first stage of spontaneous labour: A prospective cohort study in two sub-Saharan African countries.PLoS Med. 2018 Jan 16;15(1):e1002492. doi: 10.1371/journal.pmed.1002492. eCollection 2018 Jan. PLoS Med. 2018. PMID: 29338000 Free PMC article.
-
Reassessing the length of labour in healthy Turkish women: a retrospective and descriptive study.J Obstet Gynaecol. 2019 May;39(4):468-473. doi: 10.1080/01443615.2018.1534811. Epub 2019 Feb 11. J Obstet Gynaecol. 2019. PMID: 30744466
-
Maternal and neonatal outcomes from a comparison of spontaneous and directed pushing in second stage.Women Birth. 2019 Aug;32(4):e433-e440. doi: 10.1016/j.wombi.2018.10.005. Epub 2018 Oct 28. Women Birth. 2019. PMID: 30377072
-
Cervical dilatation patterns of 'low-risk' women with spontaneous labour and normal perinatal outcomes: a systematic review.BJOG. 2018 Jul;125(8):944-954. doi: 10.1111/1471-0528.14930. Epub 2017 Nov 3. BJOG. 2018. PMID: 28892266 Free PMC article.
Cited by
-
Uterine dynamics, blood profiles, and electronic fetal monitoring of primiparous and multiparous bitches classified according to their weight.Front Vet Sci. 2023 Nov 16;10:1282389. doi: 10.3389/fvets.2023.1282389. eCollection 2023. Front Vet Sci. 2023. PMID: 38033635 Free PMC article.
-
A model to predict delivery time following induction of labor at term with a dinoprostone vaginal insert: a retrospective study.Ir J Med Sci. 2024 Jun;193(3):1343-1350. doi: 10.1007/s11845-023-03568-3. Epub 2023 Nov 10. Ir J Med Sci. 2024. PMID: 37947994 Free PMC article.
-
The Effects of Meteorological Conditions on the Circadian Rhythm of Births.Am J Hum Biol. 2025 Aug;37(8):e70120. doi: 10.1002/ajhb.70120. Am J Hum Biol. 2025. PMID: 40772405 Free PMC article.
-
Maternal and neonatal outcomes associated with breech presentation in planned community (home and birth center) births in the United States: A prospective observational cohort study.PLoS One. 2024 Jul 22;19(7):e0305587. doi: 10.1371/journal.pone.0305587. eCollection 2024. PLoS One. 2024. PMID: 39037977 Free PMC article.
-
Artificial intelligence-based prediction of second stage duration in labor: a multicenter retrospective cohort analysis.EClinicalMedicine. 2025 Jan 20;80:103072. doi: 10.1016/j.eclinm.2025.103072. eCollection 2025 Feb. EClinicalMedicine. 2025. PMID: 39963160 Free PMC article.
References
-
- Friedman E.A. Labor in Multiparas: a graphicostatistical analysis. Obstet Gynecol. 1956;8(6):686–703. - PubMed
-
- Friedman E.A. Primigravid labor; a graphicostatistical analysis. Obstet Gynecol. 1955;6(6):567–589. - PubMed
-
- Caughey A., Cahill A.G., Guise J.M., Rouse D.J. Safe prevention of the primary cesarean delivery. Am J Obstet Gynecol. 2014;210:179–193. - PubMed
-
- Vogel J.P., Betrán A.P., Vindevoghel N., et al. Use of the Robson classification to assess caesarean section trends in 21 countries: a secondary analysis of two WHO multicountry surveys. Lancet Glob Health. 2015;3(5):e260–e270. - PubMed
LinkOut - more resources
Full Text Sources
Research Materials
