

Percutaneous lumbar annular puncture: A rat model to study intervertebral disc degeneration and pain-related behavior
- PMID: 35783914
- PMCID: PMC9238283
- DOI: 10.1002/jsp2.1202
Percutaneous lumbar annular puncture: A rat model to study intervertebral disc degeneration and pain-related behavior
Abstract
Background: Previous animal models of intervertebral disc degeneration (IDD) rely on open surgical approaches, which confound the degenerative response and pain behaviors due to injury to surrounding tissues during the surgical approach. To overcome these challenges, we developed a minimally invasive percutaneous puncture procedure to induce IDD in a rat model.
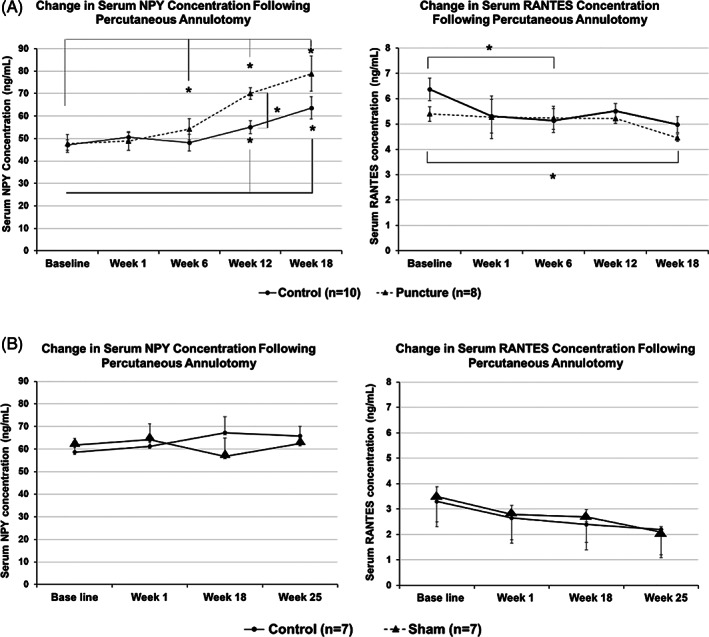
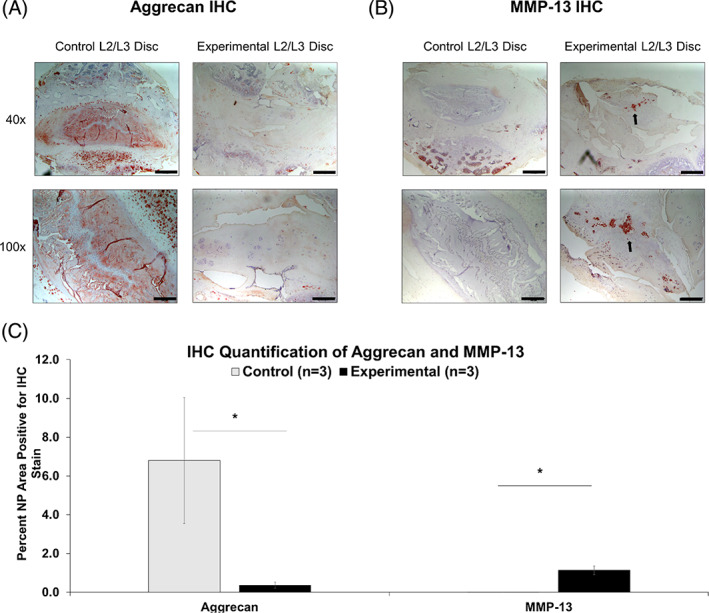
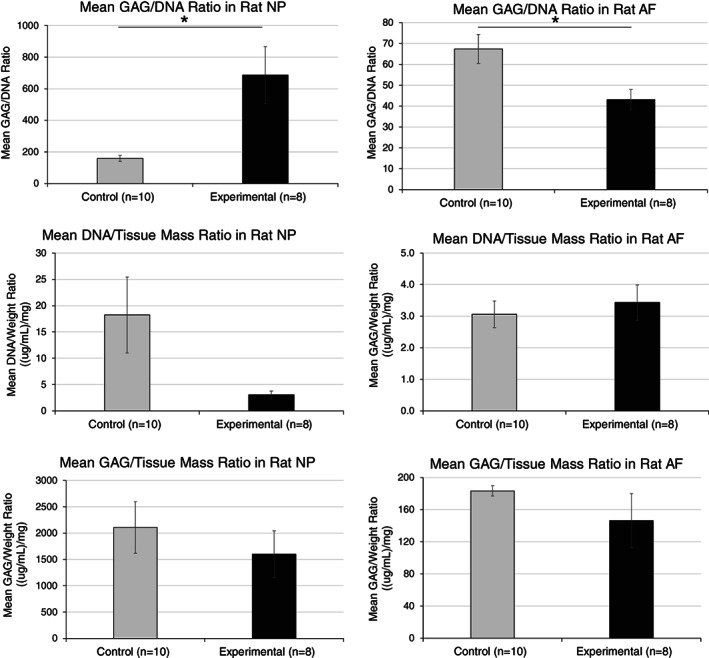
Methods: Ten Fischer 344 male rats underwent percutaneous annular puncture of lumbar intervertebral discs (IVDs) at L2-3, L3-4, and L4-5. Ten unpunctured rats were used as controls. Magnetic resonance imagings (MRIs), serum biomarkers, and behavioral tests were performed at baseline and 6, 12, and 18 weeks post puncture. Rats were sacrificed at 18 weeks and disc histology, immunohistochemistry, and glycosaminoglycan (GAG) assays were performed.
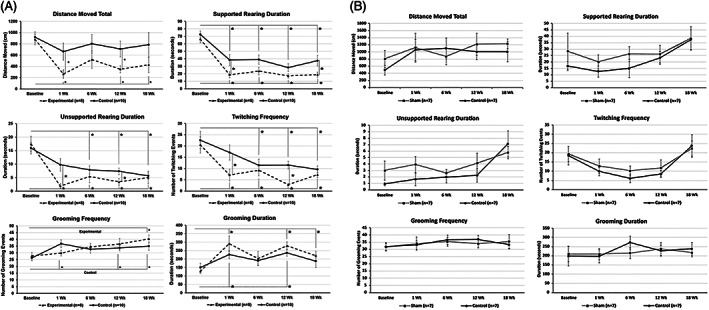
Results: Punctured IVDs exhibited significant reductions in MRI signal intensity and disc volume. Disc histology, immunohistochemistry, and GAG assay results were consistent with features of IDD. IVD-punctured rats demonstrated significant changes in pain-related behaviors, including total distance moved, twitching frequency, and rearing duration.
Conclusions: This is the first reported study of the successful establishment of a reproducible rodent model of a percutaneous lumbar annular puncture resulting in discogenic pain. This model will be useful to test therapeutics and elucidate the basic mechanisms of IDD and discogenic pain.
Keywords: intervertebral disc degeneration; low back pain; percutaneous annular puncture; rat model.
© 2022 The Authors. JOR Spine published by Wiley Periodicals LLC on behalf of Orthopaedic Research Society.
Conflict of interest statement
The authors declare no conflicts of interest.
Figures


Similar articles
-
Vascular anatomy-based localization of intervertebral discs assisting needle puncture for constructing a mouse model of mechanical injury-induced lumbar intervertebral disc degeneration.Biochem Biophys Res Commun. 2022 Dec 17;634:196-202. doi: 10.1016/j.bbrc.2022.10.022. Epub 2022 Oct 7. Biochem Biophys Res Commun. 2022. PMID: 36265418
-
Longitudinal characterization of intervertebral disc remodeling following acute annular injury in a rat model of degenerative disc disease.Connect Tissue Res. 2020 Nov;61(6):568-576. doi: 10.1080/03008207.2019.1635589. Epub 2019 Jul 5. Connect Tissue Res. 2020. PMID: 31232119
-
Annular puncture with tumor necrosis factor-alpha injection enhances painful behavior with disc degeneration in vivo.Spine J. 2016 Mar;16(3):420-31. doi: 10.1016/j.spinee.2015.11.019. Epub 2015 Dec 2. Spine J. 2016. PMID: 26610672 Free PMC article.
-
Lumbar intervertebral disc puncture under C-arm fluoroscopy: a new rat model of lumbar intervertebral disc degeneration.Exp Anim. 2014;63(2):227-34. doi: 10.1538/expanim.63.227. Exp Anim. 2014. PMID: 24770648 Free PMC article.
-
Research on the role and mechanism of IL-17 in intervertebral disc degeneration.Int Immunopharmacol. 2024 May 10;132:111992. doi: 10.1016/j.intimp.2024.111992. Epub 2024 Apr 2. Int Immunopharmacol. 2024. PMID: 38569428 Review.
Cited by
-
Homing of vertebral-delivered mesenchymal stromal cells for degenerative intervertebral discs repair - an in vivo proof-of-concept study.JOR Spine. 2022 Nov 14;6(1):e1228. doi: 10.1002/jsp2.1228. eCollection 2023 Mar. JOR Spine. 2022. PMID: 36994461 Free PMC article.
-
PLGA-microspheres carried circ_0003251 alleviate intervertebral disc degeneration via the miR-637/AKT1 axis.J Transl Med. 2025 Jul 25;23(1):840. doi: 10.1186/s12967-025-06800-z. J Transl Med. 2025. PMID: 40713764 Free PMC article.
-
Editorial: Women in science: musculoskeletal pain.Front Pain Res (Lausanne). 2025 Apr 28;6:1599967. doi: 10.3389/fpain.2025.1599967. eCollection 2025. Front Pain Res (Lausanne). 2025. PMID: 40356717 Free PMC article. No abstract available.
-
Structural changes of the multifidus in animal models of intervertebral disk degeneration: a systematic review.Front Surg. 2024 Dec 16;11:1482821. doi: 10.3389/fsurg.2024.1482821. eCollection 2024. Front Surg. 2024. PMID: 39741924 Free PMC article.
-
Selenium nanoparticles ameliorate lumbar disc degeneration by restoring GPX1-mediated redox homeostasis and mitochondrial function of nucleus pulposus cells.J Nanobiotechnology. 2024 Oct 18;22(1):634. doi: 10.1186/s12951-024-02890-x. J Nanobiotechnology. 2024. PMID: 39420311 Free PMC article.
References
-
- Katz JN. Lumbar disc disorders and low‐back pain: socioeconomic factors and consequences. J Bone Joint Surg Am. 2006;88(Suppl 2):21‐24. - PubMed
-
- Dagenais S, Caro J, Haldeman S. A systematic review of low back pain cost of illness studies in the United States and internationally. Spine J. 2008;8(1):8‐20. - PubMed
Grants and funding
LinkOut - more resources
Full Text Sources
