

Integrated Metabolomics and Transcriptome Analyses Unveil Pathways Involved in Sugar Content and Rind Color of Two Sugarcane Varieties
- PMID: 35783968
- PMCID: PMC9244704
- DOI: 10.3389/fpls.2022.921536
Integrated Metabolomics and Transcriptome Analyses Unveil Pathways Involved in Sugar Content and Rind Color of Two Sugarcane Varieties
Abstract
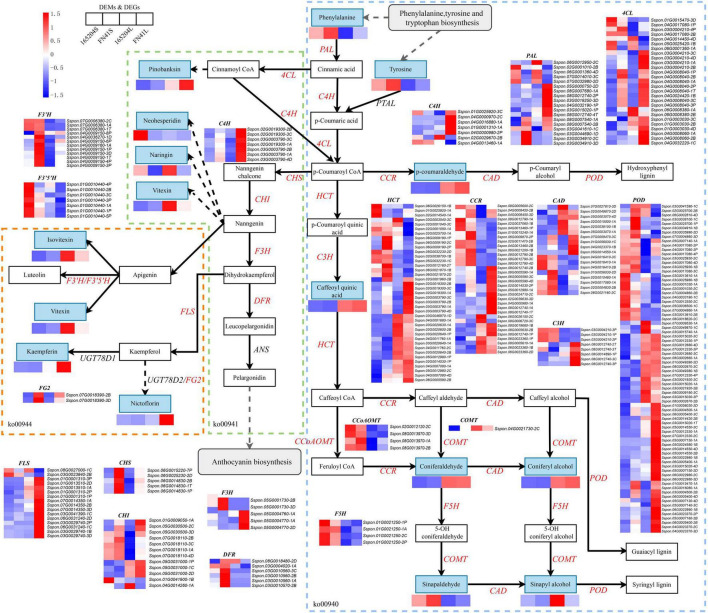
Metabolic composition can have potential impact on several vital agronomic traits, and metabolomics, which represents the bioactive compounds in plant tissues, is widely considered as a powerful approach for linking phenotype-genotype interactions. However, metabolites related to cane traits such as sugar content, rind color, and texture differences in different sugarcane cultivars using metabolome integrated with transcriptome remain largely inconclusive. In this study, metabolome integrated with transcriptome analyses were performed to identify and quantify metabolites composition, and have better insight into the molecular mechanisms underpinning the different cane traits, namely, brix, rind color, and textures in the stems (S) and leaves (L) of sugarcane varieties FN41 and 165402. We also identified metabolites and associated genes in the phenylpropanoid and flavonoid biosynthesis pathways, starch and sucrose metabolism. A total of 512 metabolites from 11 classes, with the vast majority (122) belonging to flavonoids were identified. Moreover, the relatively high amount of D-fructose 6-p, D-glucose6-p and glucose1-p detected in FN41L may have been transported and distributed by source and sink of the cane, and a majority of them reached the stem of sugarcane FN41L, thereby promoting the high accumulation of sugar in FN41S. Observations also revealed that genes such as C4H, CHS, F3H, F3'H, DFR, and FG2 in phenylpropanoid and flavonoid biosynthesis pathways were the major factors impacting the rind color and contrasting texture of FN41 and 165204. Further analysis revealed that weighted gene co-expression network analysis (WGCNA) hub genes and six transcription factors, namely, Tify and NAC, MYB-related, C2C2-Dof, WRKY, and bHLH play a key role in phenylpropanoid biosynthesis, flavone and flavonol biosynthesis, starch and sucrose metabolism. Additionally, metabolites such as L-phenylalanine, tyrosine, sinapaldehyde, pinobanksin, kaempferin, and nictoflorin were the potential drivers of phenotypic differences. Our finding also demonstrated that genes and metabolites in the starch and sucrose metabolism had a significant effect on cane sugar content. Overall, this study provided valuable insight into the molecular mechanisms underpinning high sugar accumulation and rind color in sugarcane, which we believe is important for future sugarcane breeding programs and the selection of high biomass varieties.
Keywords: WGCNA; flavonoids; metabolome and transcriptome; sugar metabolism; sugarcane.
Copyright © 2022 Yuan, Dong, Pang, Fallah, Zhou, Li and Hu.
Conflict of interest statement
The authors declare that the research was conducted in the absence of any commercial or financial relationships that could be construed as a potential conflict of interest.
Figures


Similar articles
-
Discovery of genes involved in anthocyanin biosynthesis from the rind and pith of three sugarcane varieties using integrated metabolic profiling and RNA-seq analysis.BMC Plant Biol. 2021 May 12;21(1):214. doi: 10.1186/s12870-021-02986-8. BMC Plant Biol. 2021. PMID: 33980175 Free PMC article.
-
Novel Insights into Anthocyanin Metabolism and Molecular Characterization of Associated Genes in Sugarcane Rinds Using the Metabolome and Transcriptome.Int J Mol Sci. 2021 Dec 29;23(1):338. doi: 10.3390/ijms23010338. Int J Mol Sci. 2021. PMID: 35008763 Free PMC article.
-
Metabolomics and transcriptomics provide insights into the flavonoid biosynthesis pathway in the roots of developing Aster tataricus.J Plant Res. 2023 Jan;136(1):139-156. doi: 10.1007/s10265-022-01426-4. Epub 2022 Dec 15. J Plant Res. 2023. PMID: 36520245 Free PMC article.
-
Recent Advances in Sugarcane Genomics, Physiology, and Phenomics for Superior Agronomic Traits.Front Genet. 2022 Aug 3;13:854936. doi: 10.3389/fgene.2022.854936. eCollection 2022. Front Genet. 2022. PMID: 35991570 Free PMC article. Review.
-
Comparative physiological, biochemical, metabolomic, and transcriptomic analyses reveal the formation mechanism of heartwood for Acacia melanoxylon.BMC Plant Biol. 2024 Apr 22;24(1):308. doi: 10.1186/s12870-024-04884-1. BMC Plant Biol. 2024. PMID: 38644502 Free PMC article. Review.
Cited by
-
Identifying Candidate Genes Related to Soybean (Glycine max) Seed Coat Color via RNA-Seq and Coexpression Network Analysis.Genes (Basel). 2025 Jan 1;16(1):44. doi: 10.3390/genes16010044. Genes (Basel). 2025. PMID: 39858589 Free PMC article.
-
Comparative transcriptomic and metabolomic analyses reveal the delaying effect of naringin on postharvest decay in citrus fruit.Front Plant Sci. 2022 Nov 30;13:1045857. doi: 10.3389/fpls.2022.1045857. eCollection 2022. Front Plant Sci. 2022. PMID: 36531365 Free PMC article.
-
Plant growth and stress-regulating metabolite response to biochar utilization boost crop traits and soil health.Front Plant Sci. 2023 Oct 12;14:1271490. doi: 10.3389/fpls.2023.1271490. eCollection 2023. Front Plant Sci. 2023. PMID: 37900767 Free PMC article.
-
A Data-Driven Approach to Sugarcane Breeding Programs with Agronomic Characteristics and Amino Acid Constituent Profiling.Metabolites. 2024 Apr 21;14(4):243. doi: 10.3390/metabo14040243. Metabolites. 2024. PMID: 38668371 Free PMC article.
-
Integrated metabolomic and transcriptomic study unveils the gene regulatory mechanisms of sugarcane growth promotion during interaction with an endophytic nitrogen-fixing bacteria.BMC Plant Biol. 2023 Jan 24;23(1):54. doi: 10.1186/s12870-023-04065-6. BMC Plant Biol. 2023. PMID: 36694111 Free PMC article.
References
-
- Agati G., Tattini M. (2010). Multiple functional roles of flavonoids in photoprotection. New Phytol. 186 786–793. - PubMed
LinkOut - more resources
Full Text Sources
Miscellaneous