. 2022 Jun;76(2):93-106.
doi: 10.1016/j.rie.2022.06.001. Epub 2022 Jun 25.

Non-pharmaceutical interventions and mortality in U.S. cities during the great influenza pandemic, 1918-1919

Affiliations

Non-pharmaceutical interventions and mortality in U.S. cities during the great influenza pandemic, 1918-1919

Robert J Barro. Res Econ. 2022 Jun.

Abstract

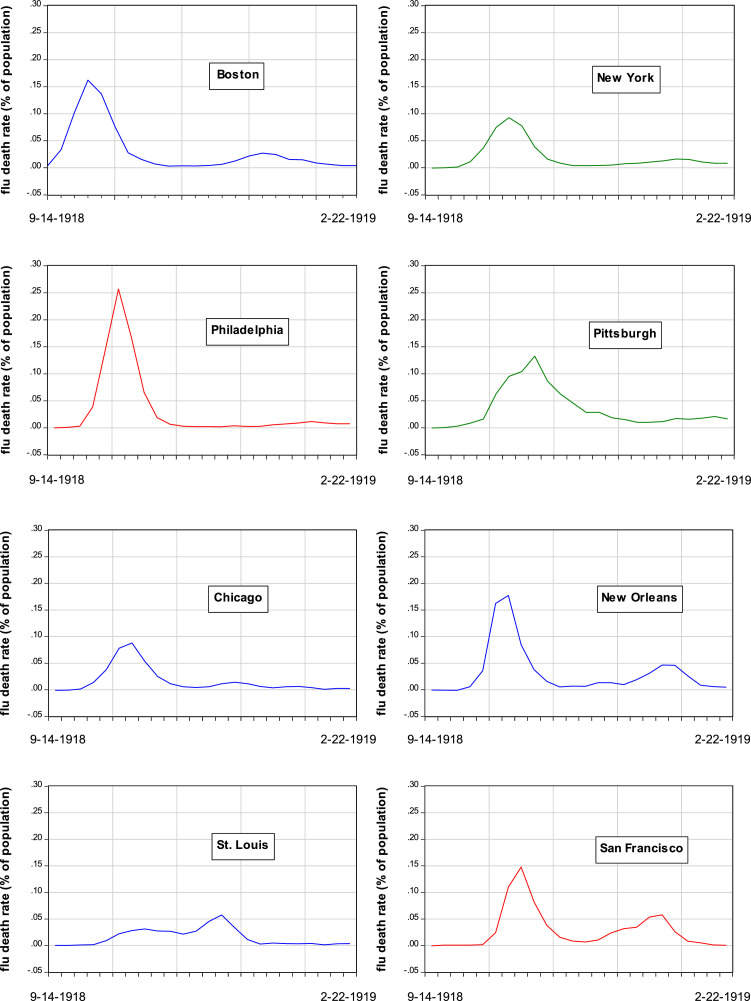
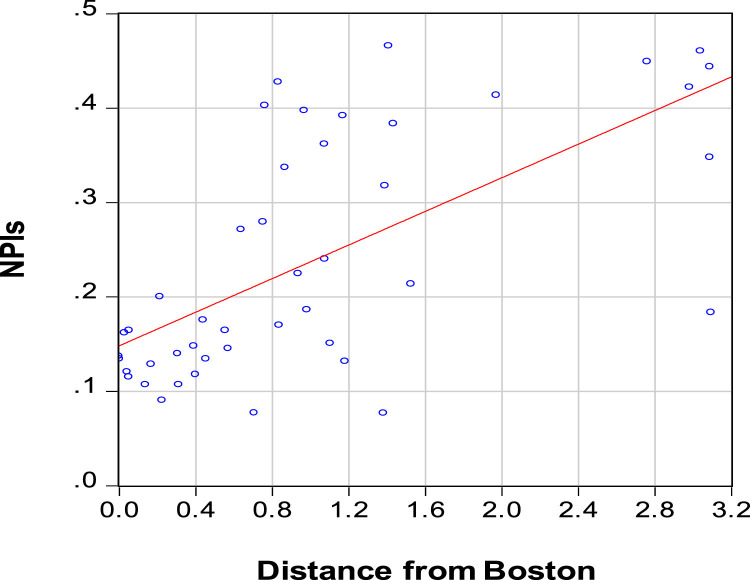
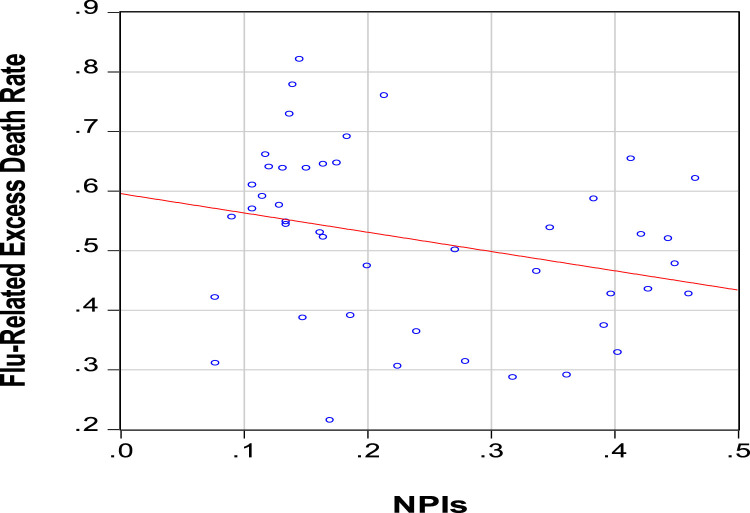
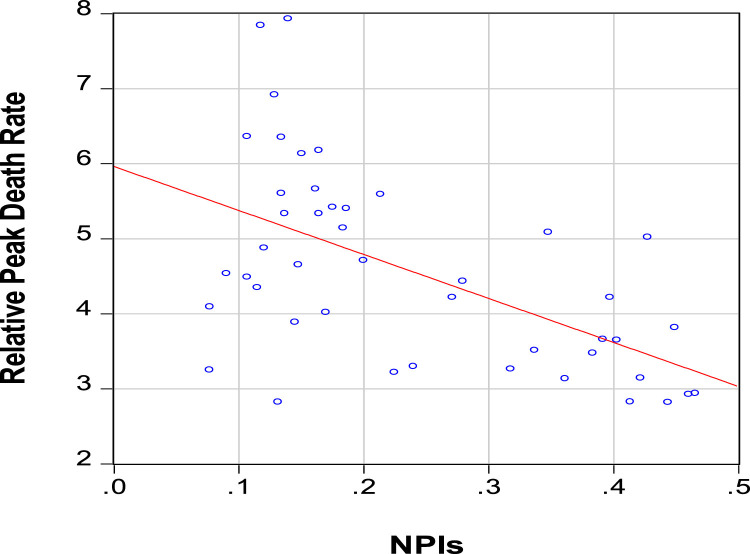
A key issue for the ongoing COVID-19 pandemic is whether non-pharmaceutical public-health interventions (NPIs) retard death rates. Good information about causal effects from NPIs comes from flu-related excess deaths in large U.S. cities during the second wave of the Great Influenza Pandemic, September 1918-February 1919. The measured NPIs are in three categories: school closings, prohibitions of public gatherings, and quarantine/isolation. Although an increase in NPIs flattened the curve in the sense of reducing the ratio of peak to overall flu-related excess death rates, the estimated effect on overall deaths is small and statistically insignificant. These findings differ from those associated with COVID-19 in the sense that facemask mandates and usage seem to reduce COVID-related cases.


Conflict of interest statement

There are no conflicts of interest involved in this research.

Figures

Fig. 1
Fig. 1
Evolution of Flu-Related Excess Death Rates in Selected Cities September 1918-February 1919. Note: The graphs show the evolution of the weekly flu-related excess death rate (percent of city population) for each city from the week ending September 14, 1918 to that ending February 22, 1919. Data are from Collins et al. (1930, Appendix Table B).
Fig. 2
Fig. 2
Relationship between Distance from Boston (thousands of miles) and NPIs (years of implementation). Note: The sample is for 45 U.S. cities. Distance from Boston is the minimum distance shown by Google Maps. Non-Pharmaceutical Interventions (NPIs) from September 1918 to February 1919 are from Markel et al. (2007, Table 1), updated to include Atlanta and Detroit. NPIs are days in effect (in units of years) for school closings, prohibitions of public gatherings, and quarantine/isolation. See Appendix Table A1.
Fig. 3
Fig. 3
Relationship between NPIs and Cumulative Flu-Related Excess Death Rate. Note: The sample is for 45 U.S. cities. NPIs from September 1918 to February 1919 is from Markel et al. (2007, Table 1), updated to include Atlanta and Detroit. The cumulative flu-related excess death rate for September 1918 to February 1919 is calculated from Collins et al. (1930, Appendix, Table B). NPIs are days in effect (in units of years) for school closings, prohibitions of public gatherings, and quarantine/isolation. See Appendix Table A1.
Fig. 4
Fig. 4
Relationship between NPIs and Relative Peak Death Rate. Note: The sample is for 45 U.S. cities. NPIs from September 1918 to February 1919 is from Markel et al. (2007, Table 1), updated to include Atlanta and Detroit. The relative peak death rate, defined as the ratio of the peak weekly flu-related excess death rate to the overall flu-related excess death rate, is calculated from Collins et al. (1930, Appendix, Table B). NPIs are days in effect (in units of years) for school closings, prohibitions of public gatherings, and quarantine/isolation. See Appendix Table A1.
Fig. 5
Fig. 5
Relationship between Distance from Boston (thousands of miles) and Public-Health Response Time (PHRT in years). Note: The sample is for 45 U.S. cities. Distance from Boston is the minimum distance shown by Google Maps. The public-health response time or PHRT is from Markel et al. (2007, Table 1), updated to include Atlanta and Detroit. See Appendix Table A1.

References

    1. Abaluck J., et al. Impact of Community Masking on COVID-19: a Cluster-Randomized Trial in Bangladesh. Science. 2022;375:1–12. January 14. - PMC - PubMed
    1. Aimone Francesco. The 1918 Influenza Epidemic in New York City: a Review of the Public Health Response. Public Health Rep. 2010;125(Supplement 3):71–79. April. - PMC - PubMed
    1. Barro Robert J. Vaccination Rates and COVID Outcomes across U.S. States. Natl. Bureau Econ. Res. 2022 working paper no. 29884March. - PMC - PubMed
    1. Barry John M. Penguin Group; New York: 2004. The Great Influenza.
    1. Barry John M. Commentary. Commentary: Little Evidence For New York City Quarantine in 1918 Pandemic. 2007 Michael T. Osterholm. November 27, available at cidrap.umn.edu.

LinkOut - more resources