. 2022 Jun 16:13:875718.
doi: 10.3389/fimmu.2022.875718. eCollection 2022.

Tumor-Specific CD4+ T Cells Restrain Established Metastatic Melanoma by Developing Into Cytotoxic CD4- T Cells

Affiliations

Tumor-Specific CD4+ T Cells Restrain Established Metastatic Melanoma by Developing Into Cytotoxic CD4- T Cells

Qiao Liu et al. Front Immunol. .

Abstract

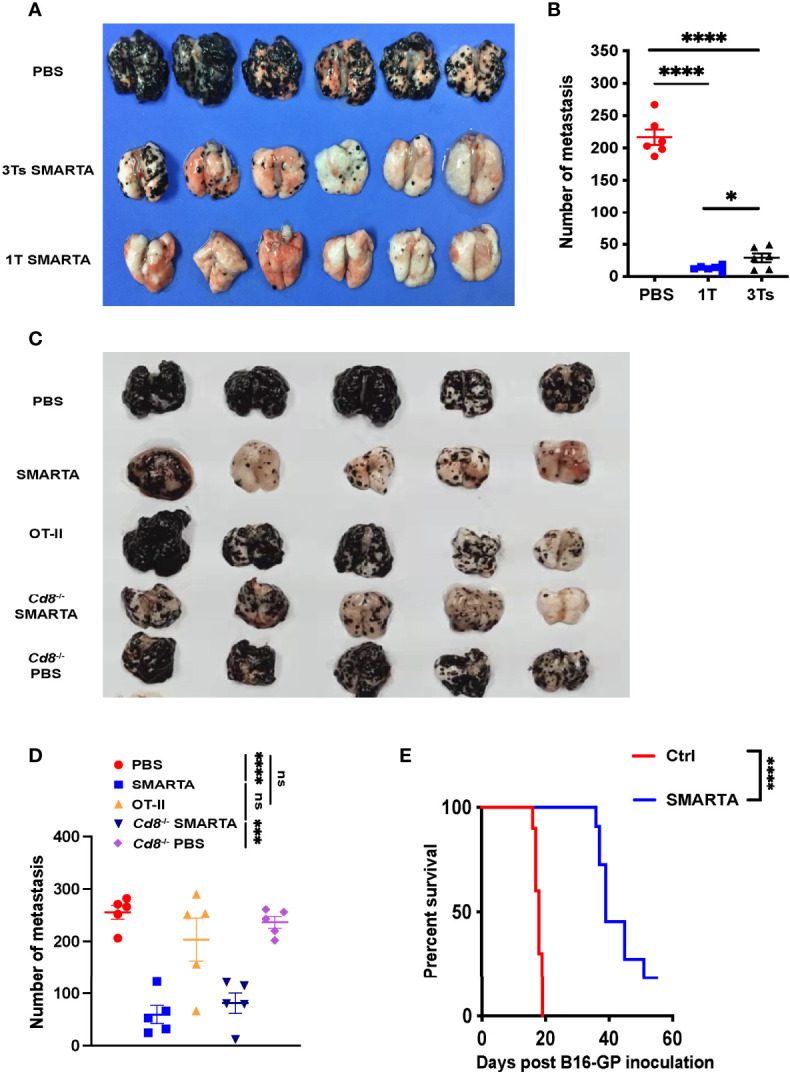
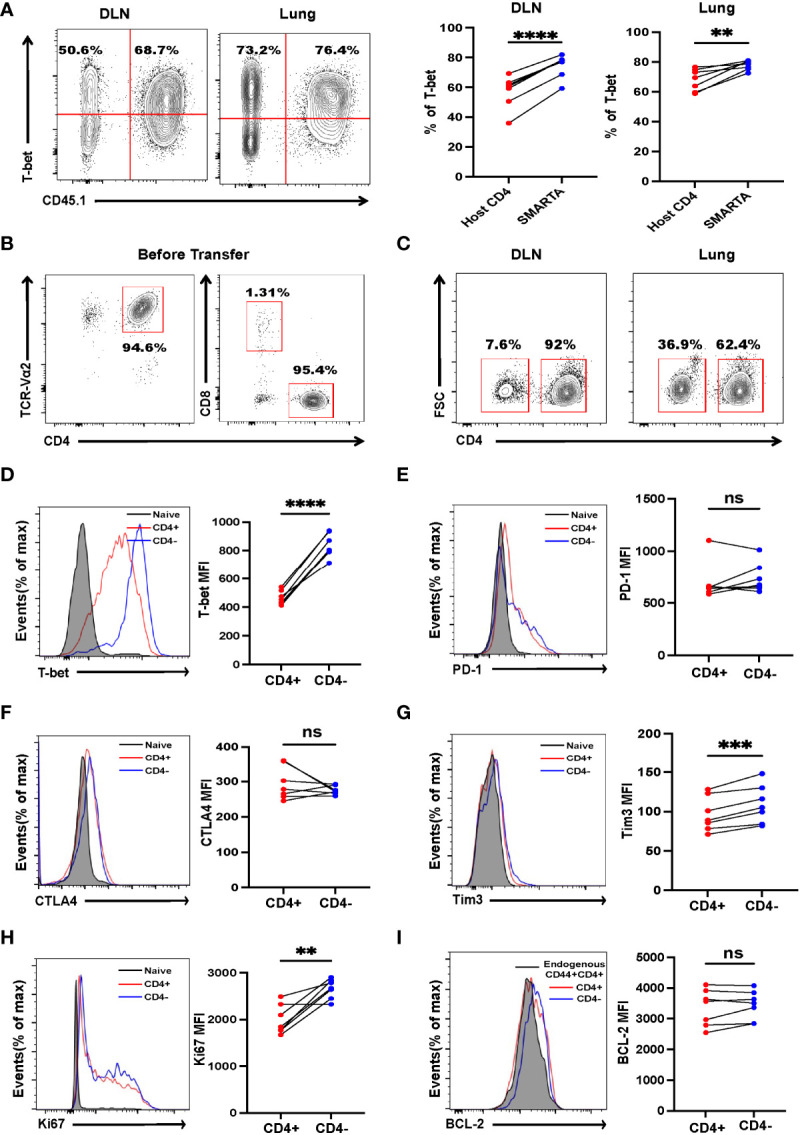
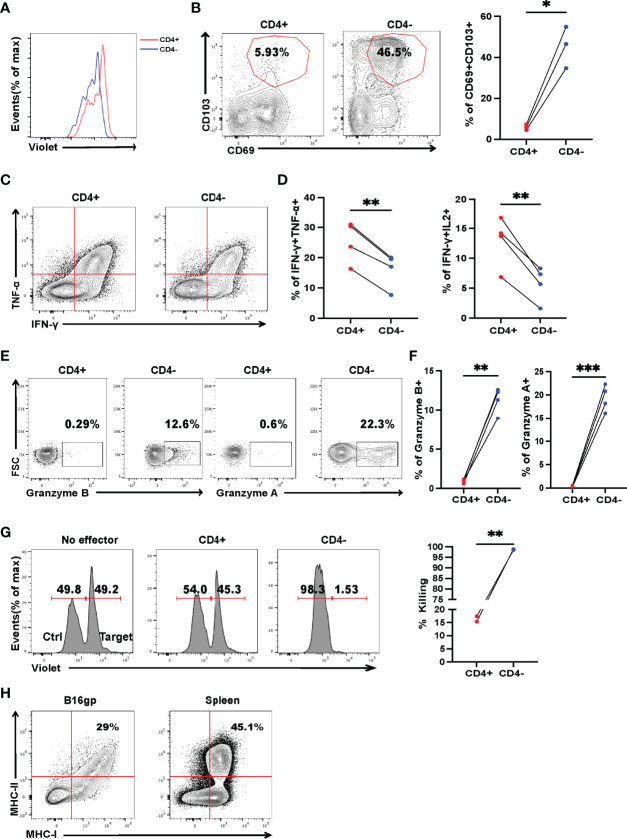
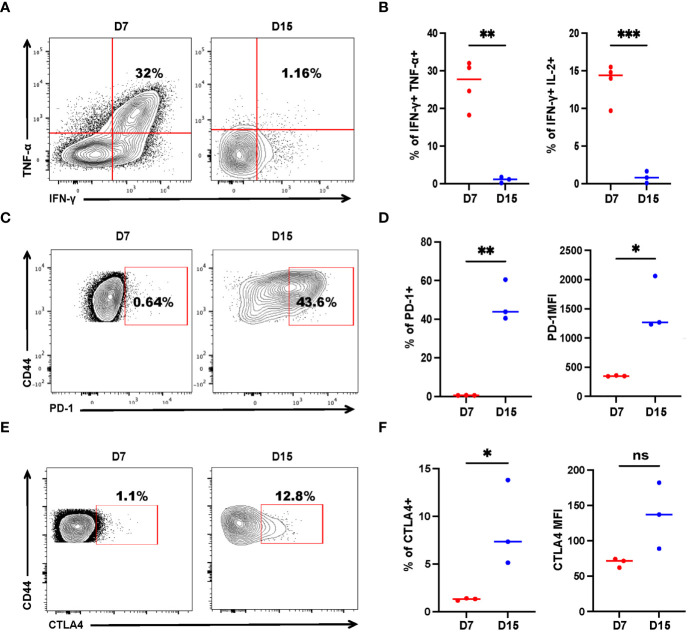
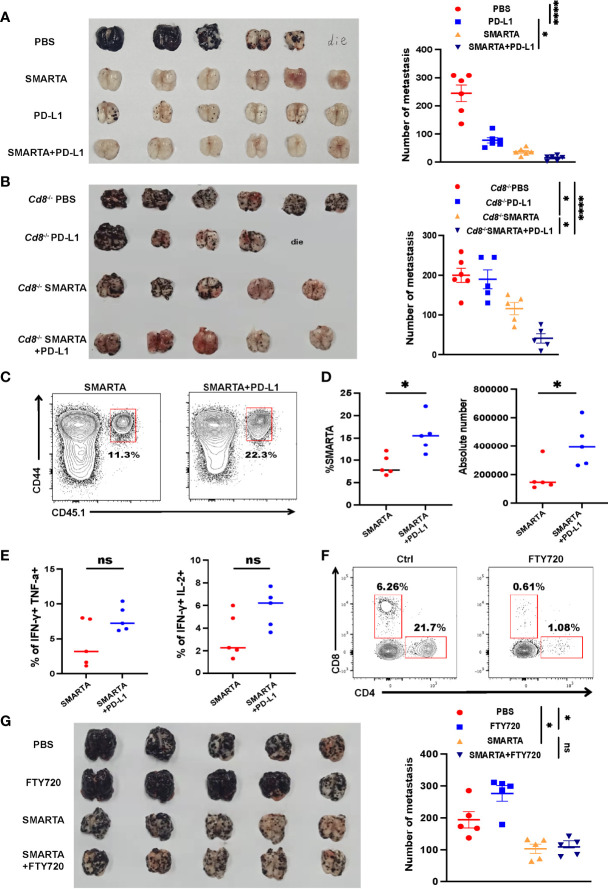
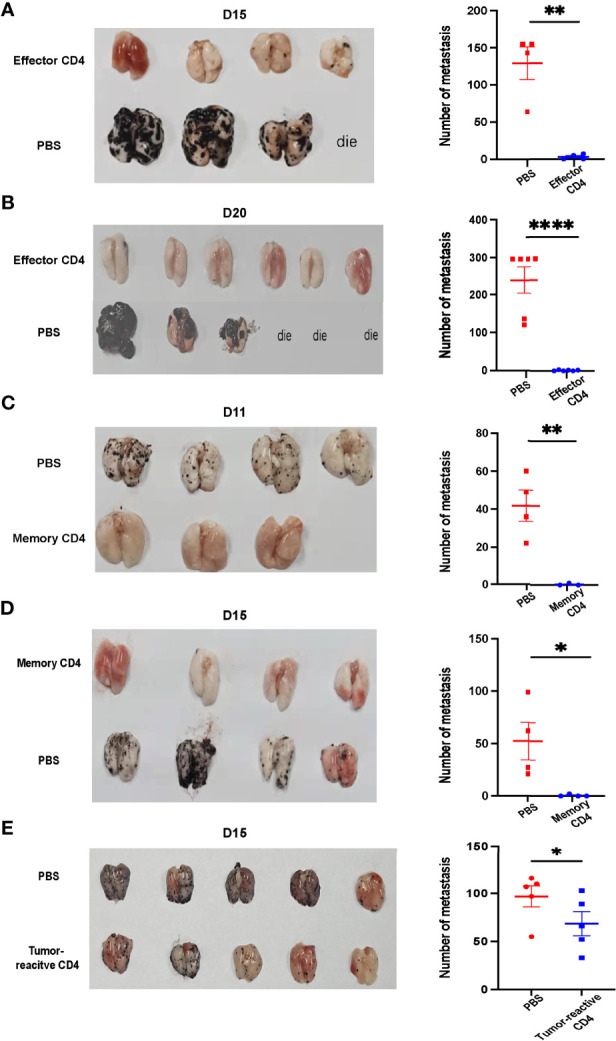
Cytotoxic CD8+ T cells are the main focus of efforts to understand anti-tumor immunity and immunotherapy. The adoptive transfer of tumor-reactive cytotoxic CD8+ T lymphocytes expanded and differentiated in vitro has long been considered the primary strategy in adaptive anti-tumor immunity, however, the majority of the transferred tumor antigen-specific CD8+ T cells differentiated into CD39+CD69+ exhausted progenies, limiting its effects in repressing tumor growth. Contrarily, less attention has been addressed to the role of CD4+ T cells during tumorigenesis. Using a mouse model of metastatic melanoma, we found that transferring tumor-specific CD4+ T cells into recipients induces substantial regression of the established metastatic tumors. Notably, in vitro activated CD4+ T cells developed into cytotoxic CD4- T cells in vivo and get exhausted gradually. The blockade of PD-L1 signaling resulted in an expansion of tumor specific CD4+ T cells, which could better control the established metastatic melanoma. Moreover, the tumor-specific memory CD4+ T cell can prevent mice from tumor metastasis, and the tumor-specific effector CD4+ T cells can also mitigate the established metastatic tumor. Overall, our findings suggest a novel mechanism of CD4+ T cells in curtailing tumor metastasis and confirm their therapeutic role in combination with PD-L1 blockade in cancer immunotherapy. Hence, a better understanding of cytotoxic CD4- T cell-mediated tumor regression could provide an alternative choice for patients exhibiting suboptimal or no response to CD8+ T cell-based immunotherapies.

Keywords: CD4+T cells; CD4-T cells; melanoma; metastasis; tumor specific.


Conflict of interest statement

The authors declare that the research was conducted in the absence of any commercial or financial relationships that could be construed as a potential conflict of interest.

Figures

Figure 1
Figure 1
Transfer of tumor-specific CD4+ T cells potently restricts lung metastasis from melanoma. 0.5 × 10⁶ B16-GP cells were injected intravenously into C57BL/6J mice (CD45.2+) through tail vein to develop the lung metastasis. On Day 7, tumor-bearing mice were administered with CTX (200mg/kg) intraperitoneally and transferred with 2 × 10⁶ CD45.1+activated tumor-specific CD4+ T cells or PBS (control) intravenously 12 hours later (Day 8). (A, B) Image of lung samples harvested from metastasis model in which C57BL/6J mice (n=6/group) were treated with PBS or 2 × 10⁶ SMARTA cells in total (once or in three divided doses for 3 consecutive days) and sacrificed seven days post-transfer (A), with the numbers of metastatic foci calculated (B). (C, D) Image of lung samples harvested from the lung metastasis model in which the C57BL/6J mice (n=5/group) with established B16-GP lung metastasis were treated with PBS, activated SMARTA or OT-II cells, and B16-GP bearing Cd8 -/- mice (n=5/group) were treated with either activated SMARTA cells or PBS (C). Mice were sacrificed on Day 18 post transfer. The statistical analysis of the numbers of metastatic foci in the lung tissues (D). (E) Survival curve of tumor-bearing mice (n=10/group) treated with activated SMARTA cells or control PBS. Statistical differences are calculated by one-way ANOVA (B, D, number of metastasis) and Log-rank test (E, survival curve). ns, not significant, *p < 0.05, ***p < 0.001, ****p < 0.0001. Data are presented as mean ± SEM.
Figure 2
Figure 2
Tumor-specific CD4+ T cells differentiate into Th1 and CD4- T cells. B16-GP tumor-bearing C57BL/6J mice were adoptively transferred with 2 × 10⁶ activated SMARTA cells on Day 8 after tumor inoculation and sacrificed seven days later. (A) Left panel: representative flow cytometry plots of T-bet expression in CD4+ T cells in draining lymph node (DLN) and lung tissue (Lung). Cells are gated on live CD44+CD4+ T cells. The numbers are percentages of cells accounting for CD45.1-(left quadrant) and CD45.1+ (right quadrant) populations. Right panel: the statistical analysis of percentages of T-bet positive cells as shown in the left panel (n=7/group). (B) The purity of the activated SMARTA cell before transfer. (C) Representative flow cytometry plots of CD4+ and CD4 SMARTA cells in the DLN and lung and cells are gated on live CD45.1+ cells. Numbers are frequencies of indicated populations (n=7/group). (D-I) Flow cytometry analyses of SMARTA cells isolated from the lung comparing the expression level of T-bet, PD-1, CTLA4, Tim3, Ki67 and BCL-2 between CD4+ and CD4- SMARTA cells. The mean fluorescent intensities (MFIs) are summarized beside. Cells are gated on live CD45.1+ cells (n=7/group). Statistical differences are calculated by paired student’s t test. ns, not significant, **p <0.01, ***p < 0.001, ****p < 0.0001.
Figure 3
Figure 3
Cytotoxic CD4 T cells, differentiated from CD4+ T cells, are critical for controlling established tumor metastasis. Tumor-bearing mice were treated with 2 × 10⁶ activated SMARTA cells eight days after tumor inoculation and sacrificed on Day 7 or Day 15 post-transfer. (A) Flow cytometry analysis of the dilution pattern of the cell proliferation dye on CD4+ and CD4 SMARTA cells which were sorted from the metastatic lung tissue on Day 7 post cell transfer and labeled with CellTrace Violet, followed by in vitro stimulation of plate-bound anti-CD3(1ug/ml) and soluble anti-CD28(1ug/ml) for 72 h Cells are gated on live CD45.1+ cells. (B) Representative flow cytometry plots of CD69 and CD103 expression in CD4+ and CD4 SMARTA cells on Day 15 post cell transfer. The frequencies of CD69+CD103+ cells in each population are summarized beside. (n=3/group). (C, D) Representative FACS data of TNF-α and IFN-γ production of CD4+ and CD4 SMARTA cells after in vitro GP66-77 re-stimulation on Day 7 post-SMARTA transfer. Frequencies of IFN-γ+ TNF-α+ and IFN-γ+ IL-2+ cells in the indicated populations are summarized in (D). (n=4/group). (E, F) Representative FACS data of Granzyme A and Granzyme B production of CD4+ and CD4 SMARTA cells after GP66–77 re-stimulation on Day 15 post cell transfer. Frequencies of Granzyme B+ and Granzyme A+ cells in the indicated populations are summarized in (F). (n=4/group). (G) Flow cytometry analyzing the killing capacity of CD4+ and CD4 SMARTA cells, in which Violet-high B220+ cells loaded with MHC class II-restricted peptide GP66–77 (recognized by SMARTA cells) were target cells, whereas Violet-low cells labeled with GP33–41 as control; the effector: target ratio is 10:1. The percentage of killing by the populations is summarized beside. (H) Flow cytometry plots of MHC-I and MHC-II expression in B16-GP cells harvested from metastatic lung or in splenocytes of C57BL/6J mouse (positive control). Statistical differences are calculated by paired student’s t test. *p <0.05, **p <0.01, ***p < 0.001.
Figure 4
Figure 4
Tumor-specific CD4+ T cells get exhausted during tumor progression. Tumor-bearing mice were treated with 2 × 10⁶ activated SMARTA cells eight days after tumor inoculation and sacrificed on Day 7 or Day 15 post-transfer. Cells are gated on live CD4+CD44+CD45.1+ cells. (A, B) Representative flow cytometry plots of intracellular cytokine staining of CD4+ SMARTA cells on Day 7 (n=4) and Day 15 (n=3) post-SMARTA transfer (A). The frequencies of IFN-γ+ TNF-α+ and IFN-γ+ IL-2+ cells of CD4+SMARTA cells (B). (C, D) In a separate experiment, representative flow cytometry plots of PD-1 expression in CD4+ SMARTA cells on Day 7 and Day 15 (n=3/group) post-transfer (C). The frequency of PD-1+ SMARTA cells and MFI of PD-1 (D). (E, F) Representative flow cytometry plots of CTLA4 expression in CD4+ SMARTA cells on Day 7 and Day 15 (n=3/group) post SMARTA transfer (E). The frequency of CTLA4+ SMARTA cells and MFI of CTLA4 (F). Statistical differences are calculated by unpaired t-test. ns, not significant, *p < 0.05, **p < 0.01, ***p < 0.001.
Figure 5
Figure 5
Tumor-specific CD4+ T cells have a synergistic therapeutic effect with PD-L1 blockade. (A) Representative image of lung samples harvested from tumor-bearing C57BL/6J mice (n=6/group) which were treated with 2 × 10⁶ activated SMARTA cells or PD-L1 blockade therapy alone or the two combined and sacrificed on Day 7 post transfer (endpoint). In PBS-treated group, a mouse died before the endpoint and metastatic foci on the mouse lung was calculated as the same value as the most severe one (similarly hereinafter). The numbers of the metastatic foci are summarized beside. (B) Representative image of lung samples harvested from tumor-bearing Cd8 –/– mice which were treated with PBS (n=6) or PD-L1 monoclonal antibody (n=5) or SMARTA cells alone (n=5) or in combination (n=5) on Day 8 post tumor inoculation and were sacrificed on Day 15. In PD-L1 blockade-treated group, a mouse died before the endpoint. The statistical analysis of the metastatic foci is shown beside. (C–E) Flow cytometry analysis of transferred CD45.1+ CD44+ SMARTA cells in Cd8 –/– mice with or without PD-L1 blockade therapy. The frequencies and absolute numbers of SMARTA cells (D) and the statistical analysis of cytokine production of SMARTA cells (E) in the two groups. (F, G) Tumor-bearing C57BL/6J mice (n=5/group) were transferred with SMARTA cells or PBS on Day 8 post tumor challenge, followed by three doses of FTY720 (25 µg intraperitoneal injection) or PBS treatment from Day 9 to Day 15. Representative flow cytometry plots of CD4+ and CD8+ T cells in the metastatic lung tissue after FTY-720 treatment analyzing the blocking efficacy of FTY-720 (F). The image of lung tissue harvested from mice of indicated groups with the statistical analysis of the metastatic foci shown beside (G). Statistical differences are calculated by one-way ANOVA (A, B, and G, number of metastasis), unpaired t test (D, E). ns, not significant, *p <0.05, ****p < 0.0001.
Figure 6
Figure 6
Antigen-specific effector CD4+ T cells can control lung metastasis while memory CD4+ T cells prevent mice from lung metastasis. (A, B) Image of lung samples of metastatic tumor models in which mice were inoculated with 5×10⁵ B16-GP cells intravenously and 8 Days later transferred with 1×10⁶ effector CD4+ T cells isolated from LCMV-Armstrong-infected mice. Tumor bearing mice were sacrificed on Day 15 (A) or Day 20 (B) after B16-GP inoculation. (n=4/group on Day 15, n=6/group on Day 20). Before Day 15, a mouse died and three mice died before Day 20. The statistical analyses of the metastatic foci are shown beside. (C, D) Image of lung samples of metastatic tumor models in which naïve mice were transferred with 1×10⁵ memory CD4+ T cells or PBS and then challenged with 5×10⁵ B16-GP. Mice were sacrificed on Day 11 (C) and Day 15 (D) post tumor challenge. On Day 11, n=4 in PBS group, n=3 in memory CD4 group, on Day 15, n=4/group. The statistical analyses of the metastatic foci are shown beside. (E) CD4+CD25-GITR- T cells were separated from the lung tissue and the draining lymph nodes of B16-GP tumor-bearing mice eight days after tumor inoculation and 1.5×10⁶ PD-1+ CD44+CD25-CD4+T cells (tumor-reactive) or PBS were transferred into recipient mice (n=4/group) challenged with B16-GP four days before. The tumor-bearing recipient mice were sacrificed on Day 15 post tumor inoculation and the image of lung samples harvested from the mice and the statistical analysis of the metastatic foci is shown. Statistical differences are calculated by unpaired t test. *p < 0.05, **p < 0.01, ****p < 0.0001. Data are presented as mean ± SEM.

Similar articles

Cited by

References

    1. Steeg PS. Targeting Metastasis. Nat Rev Cancer (2016) 16:201–18. doi: 10.1038/nrc.2016.25 - DOI - PMC - PubMed
    1. Suhail Y, Cain MP, Vanaja K, Kurywchak PA, Levchenko A, Kalluri R, et al. . Systems Biology of Cancer Metastasis. Cell Syst (2019) 9:109–27. doi: 10.1016/j.cels.2019.07.003 - DOI - PMC - PubMed
    1. Qi H, Fan W. Value of Ablation Therapy in the Treatment of Lung Metastases. Thorac Cancer (2018) 9:199–207. doi: 10.1111/1759-7714.12567 - DOI - PMC - PubMed
    1. Jiang Y, Zhao X, Fu J, Wang H. Progress and Challenges in Precise Treatment of Tumors With PD-1/PD-L1 Blockade. Front Immunol (2020) 11:339. doi: 10.3389/fimmu.2020.00339 - DOI - PMC - PubMed
    1. Krishna S, Lowery FJ, Copeland AR, Bahadiroglu E, Mukherjee R, Jia L, et al. . Stem-Like CD8 T Cells Mediate Response of Adoptive Cell Immunotherapy Against Human Cancer. Science (2020) 370:1328–34. doi: 10.1126/science.abb9847 - DOI - PMC - PubMed

Publication types