. 2022 Jun 15:13:928039.
doi: 10.3389/fimmu.2022.928039. eCollection 2022.

T-Follicular-Like CD8+ T Cell Responses in Chronic HIV Infection Are Associated With Virus Control and Antibody Isotype Switching to IgG

Affiliations

T-Follicular-Like CD8+ T Cell Responses in Chronic HIV Infection Are Associated With Virus Control and Antibody Isotype Switching to IgG

Luis Romero-Martín et al. Front Immunol. .

Abstract

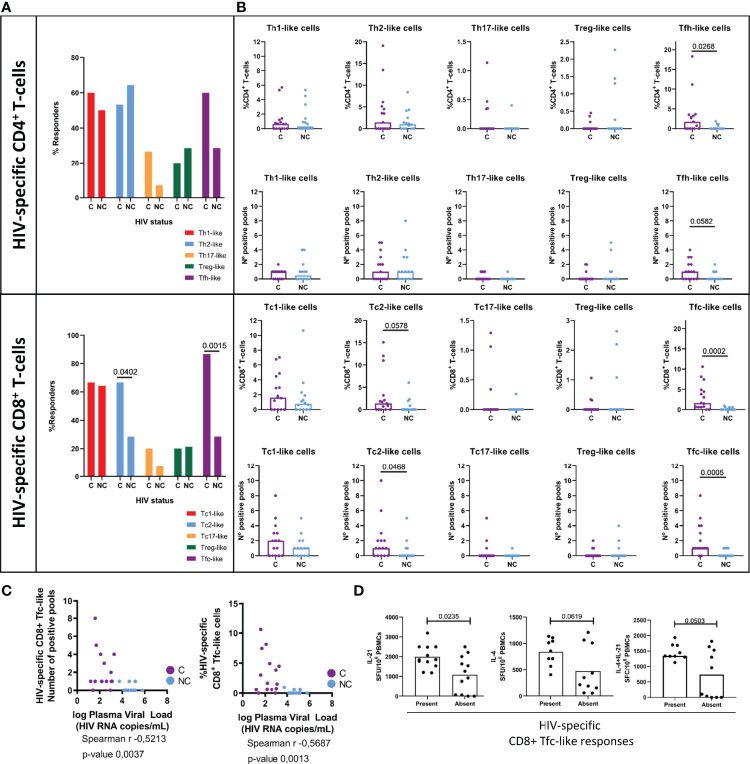
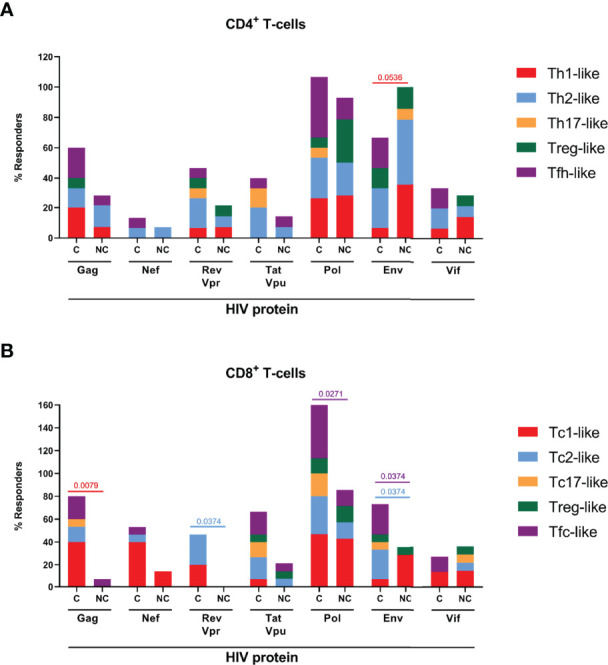
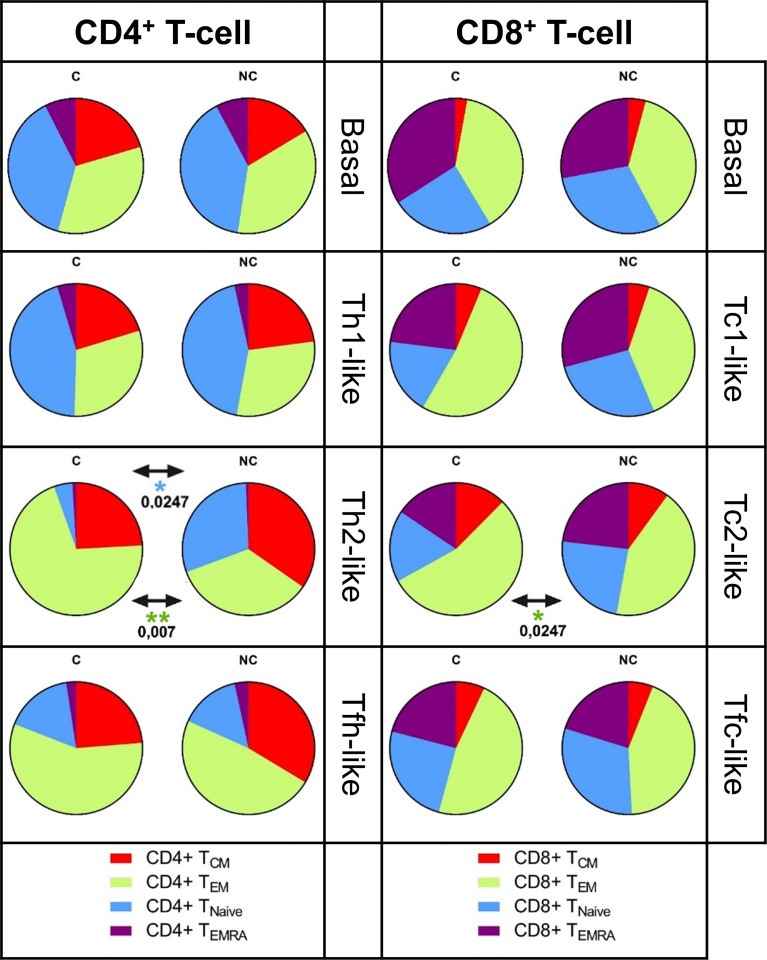
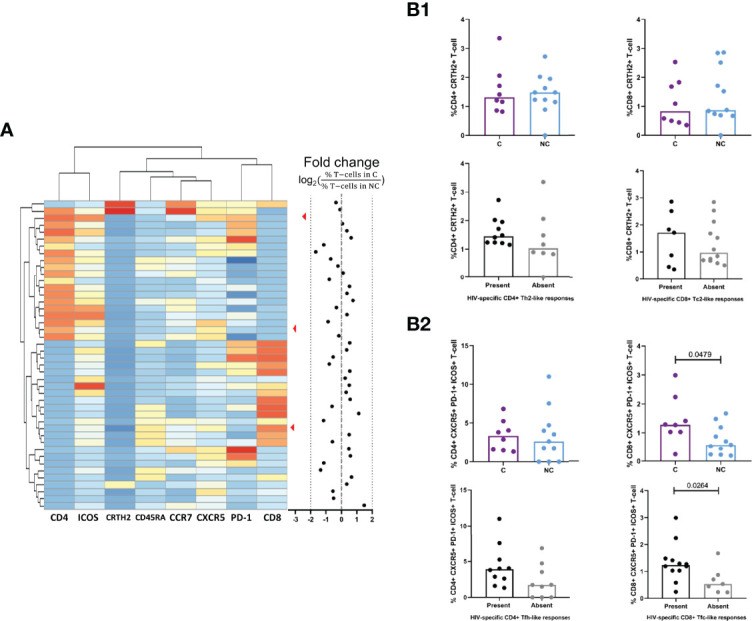
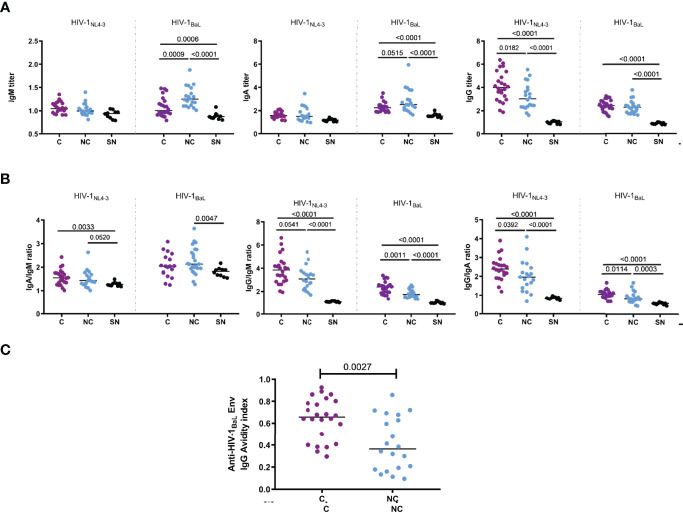
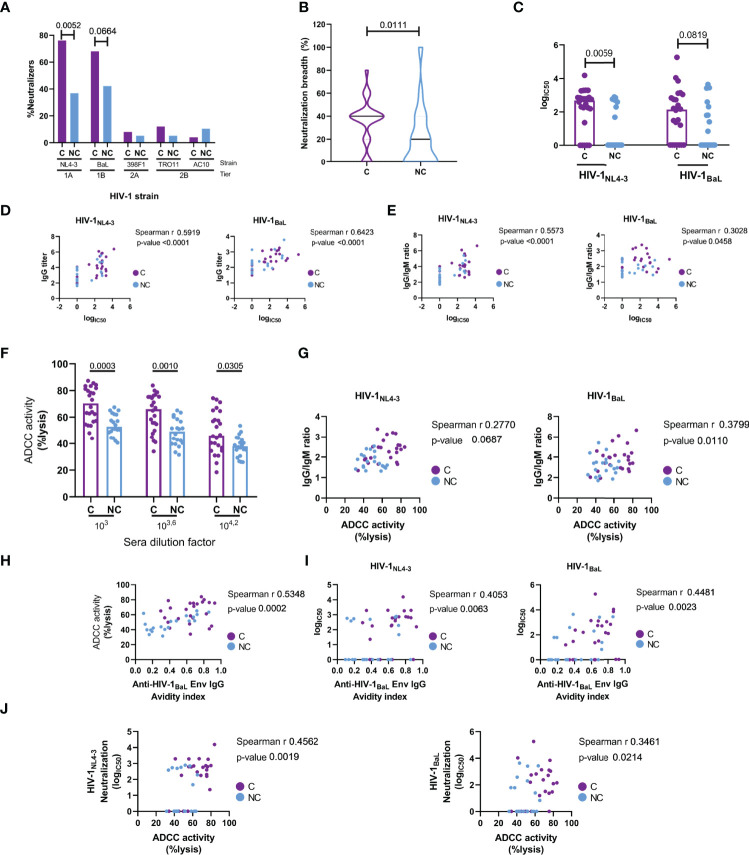
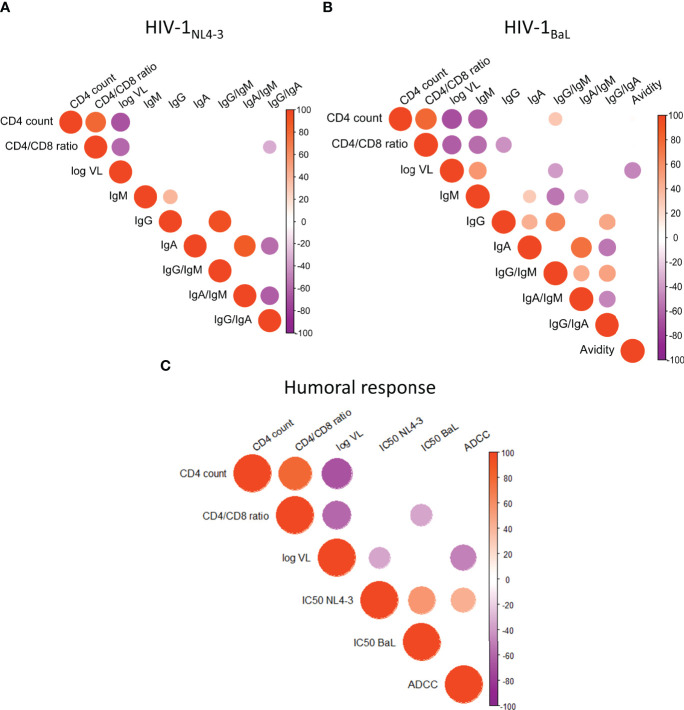
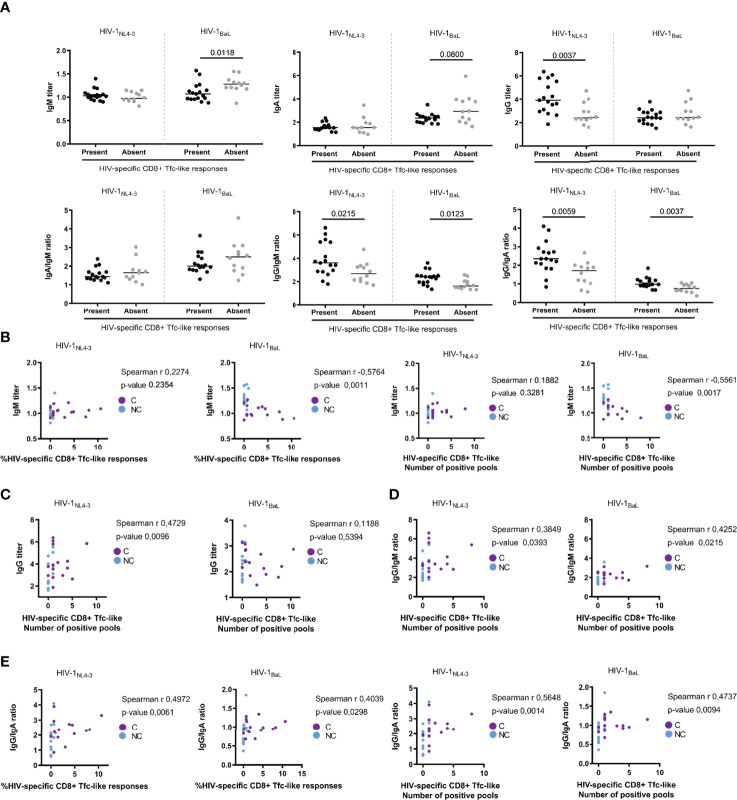
T cell responses are considered critical for the in vivo control of HIV, but the contribution of different T cell subsets to this control remains unclear. Using a boosted flow cytometric approach that is able to differentiate CD4+ and CD8+ T cell Th1/Tc1, Th2/Tc2, Th17/Tc17, Treg and Tfh/Tfc-like HIV-specific T cell populations, we identified CD8+ Tfc responses that were related to HIV plasma viral loads and associated with rate of antibody isotype class switching to IgG. This favorable balance towards IgG responses positively correlated with increased virus neutralization, higher avidity of neutralizing antibodies and more potent antibody-dependent cell cytotoxicity (ADCC) in PBMCs from HIV controllers compared to non-controllers. Our results identified the CD8+ Tfc-like T-cell response as a component of effective virus control which could possibly be exploited therapeutically.

Keywords: HIV; T-follicular cytotoxic (Tfc) cells; human immunodeficiency virus (HIV) control; humoral immune response; viral control.


Conflict of interest statement

Author CB was employed by company AELIX Therapeutics. MR-R and CB are co-inventors of the “Boosted flow” technology, which is protected under patent application US9709577B2. The remaining authors declare that the research was conducted in the absence of any commercial or financial relationships that could be construed as a potential conflict of interest.

Figures

Figure 1
Figure 1
HIV-specific T-cell polarized responses. Boosted Flow screening of specific-T-cell responses against whole HIV proteome in a cohort of 15 HIV+ controllers (C, purple) and 14 HIV+ non-controllers {NC, light blue) revea led a highly-diverse set of polarized T-cell responses in terms of (A) number of responders (B) percentage of circulating HIV-specific T-cells (up) and number of reactive pools {down). (C) Negative correlation between plasma viral load and CDS+ Tfc-like responses to HIV measured in terms of breadth (l eft) and magnitude (right). (D) Inner capacity of total PBMCs to secrete T-follicular associated cytokines IL-21 (left scatter plot), IL-4 (middle scatter plot) and IL-21/IL-4 simultaneously (right scatter plot) upon non-specific PHA stimulation stratified by the presence (left bar) or the absence (right bar) of HIV-specific circulating Tfc-like responses. Statistical significance of differences in frequency of responders was evaluated by Chi-square test, between group medians by non-parametric Mann-Whitney test and correlation between Tfc-like responses and plasma viral load by Spearman correlation and its correspondent p-value. Statistical significance was set on p < 0.05.
Figure 2
Figure 2
HIV protein-specific polarized T-cell responses. Boosted Flow screening of HIV protein-specific T-cell responses resulted into protein-dependent different polarized profiles in both CD4+ T-cells and CD8+ T-cells. The percentage of responders to each of the HIV-1 derived proteins is indicated in stacked bars for CD4+ (A) and CD8+ (B) T-cells. Statistically significant (p<O.O5) differences in protein-specific frequency of response between HIV+ controllers (C) and HIV+ non-controllers (NC) are indicated. Statistical significance was evaluated by Chi-square.
Figure 3
Figure 3
Memory phenotype of the HIV-specific polarized T-cell responses. The frequency of cells expressing memory markers CD45RA and CCR7 was evaluated in both HIV-specific polarized CD4+ and CD8+ T-ce lls. The percentage of basa l, Thl/Tcl, Th2/ Tc2 and Tfh/Tfc-like cells classified as TcM (CD45RA- CCR7+), TEM (CD45RA- CCR7-), TEMRA (CD45RA+ CCR7-) and TNaive (CD45RA+ CCR7+) are shown in pie charts. Statistical significance of the differences between HIV-specific memory phenotype in HIV+ controllers (C, left) and HIV+ non-controllers (NC, right) was evaluated by non-parametric Mann-Whitney test, statistical significance was set at p>O.OS, only significant results are shown.
Figure 4
Figure 4
Comparison of CD4+ Th2 and Tfh and CDS+ Tc2 and Tfc subpopulations between controllers and non controllers. (A) Unsupervised clustering of CD4+ and CD8+ T-cell population based on the expression of Th2/Tc2 marker (CRTH2). Tfh/Tfc markers (CXCRS, PD-1, ICOS) and memory phenotype markers (CCR7, CD45RA) by FlowSOM. Results are expressed as a fold change between the presence of the clusters in HIV+ controllers (C, purple) compared to HIV+ non-controllers (NC, light blue). (Bl) Comparison of the percentage of CRTH2+ CD4+ Th2-cells (left) and CD8+ Tc2 cells (right) stratifying by HIV control status (above) or the presence or absence of HIV-specif ic Th2/Tc2 responses (below). (B2) Comparison of the percentage of CXCRS+PD-l+ICOS+ CD4+ Tfh-cells (left) and CD8+ Tfc cells (right) stratifying by HIV control status (above) and the presence or absence of HIV-specific Tfh/Tfc-like cytokine responses by boosted flow responses (below).
Figure 5
Figure 5
Titers of anti-HIV Env lgA, lgG and lgM. Titers and affinity were compared between controllers (N=24, C, purple dots) and noncontrollers (N=20, NC, light blue dots) and HIV seronegatives (N= 8, SN, black dots). (A) Plasma dilution titers of anti-HIV Env lgA, lgG and lgM were determined with MOLT-4 cell lines expressing HIV-1NL4_3 and HIV-18AL Env in the surface. (B) lsotype class switching extend was estimated by the ratio of anti-HIV Env lgA/IgM, lgG/IgM and lgG/IgA in each individual. (C) Avidity index of HIV-lsaL Env-specific lgG. Statistical significance (p< 0.05) was evaluated by applying non-parametric Mann-Whitney test.
Figure 6
Figure 6
Antibody mediated anti-HIV functional responses. Responses are compared between controllers ((C), purple) and non-controllers (NC, light blue). (A) Percentage of individuals capable to neutralize a panel of 5 HIV-1 pseudoviruses, including 5 strains from tier 1A (NL4-3), 1B (BaL), 2A (398F1) and 2B (TROll and AClO). (B) Neutralizing breadth (left) in HIV+ controllers (C) and non-controllers (NC) calculated as: number of pseudovirus neutralized/number of pseudovirus evaluated (5) *100. (C) IC50 neutralizing capacity of HIV+ controllers (C) and noncont rollers (NC) against HIV-1NL4_3 (left) and HIV-18aL (right). (D) Spearman correlation of logiC50 neutralizing capacity with lgG titers. (E) Correlation of logiC50 neut ralizing capacity with lgG/IgM ratio. (F) Ant ibody-dependent ce llular cytotoxicity (ADCC) induced by t he presence of serial sera dilutions from cont rollers (C) and non-cont rollers (NC). (G) Correlation between ADCC at 1:104·2 serum dilution with lgG/IgM ratio. (H) Correlation between ADCC at 1:104.2 serum dilution with avidity index. (I) Correlations between IC50 neutralizing capacity against HIV-1NL4_3 (left) and HIV-18aL (right) with avidity. (J) Correlation between ADCC at 1:104.2 serum dilution with neutralization log(IC50). Statistical significance of the presence of neutralizing activity (A) in both groups was evaluated by Chi-square, while comparison of medians (B, C and F) was det ermined by non-parametric Mann-Whitney test . Correlations were performed by non-parametric Spearman r test, rho and p-values are displayed in the correspondent plots.
Figure 7
Figure 7
Humoral anti-HIV functional responses link with clinical parameter's. (A) Correlation between anti-HIV-1NL4_3 antibody titers and CD4 count, CD4/CD8 ratio and plasma viral load. (B) Correlation between anti-HIV-lBaL antibody titers and CD4 count, CD4/CD8 ratio and plasma viral load. (C) Correlation between humoral functional response (HIV-1NL4_3 and HIV-lBad neutralization activity, ADCC and CD4 count, with CD4/CD8 ratio and plasma viral load. Correlations were performed by non-parametric Spearman r test. Positive correlations are indicated in red while negative correlations in purple, color intensity in proportional to Spearman's rho and circle size is related to the p-value when significant.
Figure 8
Figure 8
Link between HIV-specific CDS+ Tfc-like responses and humoral responses. (A) Samples were stratified by the presence (n=17) or the absence (n=13) of HIV-specific CD8+ Tfc-like responses and titers of lgA, lgG and lgM were compared, as well as the lgA/IgM, lgG/IgM and lgG/IgA ratios. (B) Correlation between anti-HIV-1NL4_3 (left) and HIV-lsaL (right) lgM titers with CD8+ Tfc-like magnitude (left) and breadth (right). (C) Correlation between anti-HIV-1NL4_3 (left) and HIV-lsaL (right) lgG titers with CD8+ Tfc-like breadth. (D) Correlation between anti-HIV-1NL4.3 (left) and HIV-lsaL (right) lgG/IgM ratio with CD8+ Tfc-like breadth. (E) Correlation between anti-HIV-1NL4_3 (left) and HIV·lsaL (right) lgG/IgA ratios with CD8+ Tfc-like magnitude (left) and breadth (right). Statistical significance of the comparison were performed by non-parametrical Mann-Whitney test while non-parametric Spearman r correlations were applied.

Similar articles

Cited by

References

    1. Jacobs ES, Keating SM, Abdel-Mohsen M, Gibb SL, Heitman JW, Inglis HC, et al. . Cytokines Elevated in HIV Elite Controllers Reduce HIV Replication In Vitro and Modulate HIV Restriction Factor Expression. J Virol (2017) 91(6). doi: 10.1128/jvi.02051-16 - DOI - PMC - PubMed
    1. Côrtes FH, Passaes CPB, Bello G, Teixeira SLM, Vorsatz C, Babic D, et al. . HIV Controllers With Different Viral Load Cutoff Levels Have Distinct Virologic and Immunologic Profiles. J Acquir Immune Defic Syndr (2015) 8:377–85. doi: 10.1097/QAI.0000000000000500 - DOI - PMC - PubMed
    1. Jones RB, Walker BD. HIV-Specific CD8+ T Cells and HIV Eradication. J Clin Invest (2016) 126(2):455–63. doi: 10.1172/JCI80566 - DOI - PMC - PubMed
    1. Fellay J, Shianna KV, Ge D, Colombo S, Ledergerber B, Weale M, et al. . A Whole-Genome Association Study of Major Determinants for Host Control of HIV-1. Science (80- ) (2007) 317:944–7. doi: 10.1126/science.1143767 - DOI - PMC - PubMed
    1. Pereyra F, Addo MM, Kaufmann DE, Liu Y, Miura T, Rathod A, et al. . Genetic and Immunologic Heterogeneity Among Persons Who Control HIV Infection in the Absence of Therapy. J Infect Dis (2008) 197(4):563–71. doi: 10.1086/526786 - DOI - PubMed

Publication types

Substances