. 2022 Jun 16:13:922958.
doi: 10.3389/fimmu.2022.922958. eCollection 2022.

Helios Expression Is Downregulated on CD8+ Treg in Two Mouse Models of Lupus During Disease Progression

Affiliations

Helios Expression Is Downregulated on CD8+ Treg in Two Mouse Models of Lupus During Disease Progression

Andrés París-Muñoz et al. Front Immunol. .

Abstract

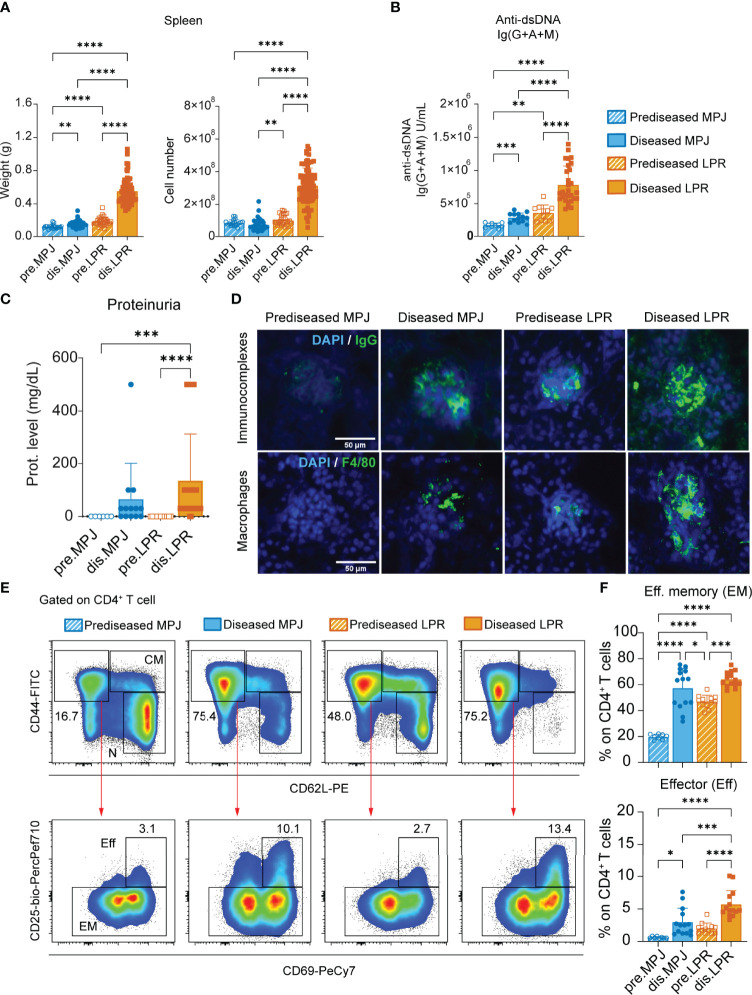
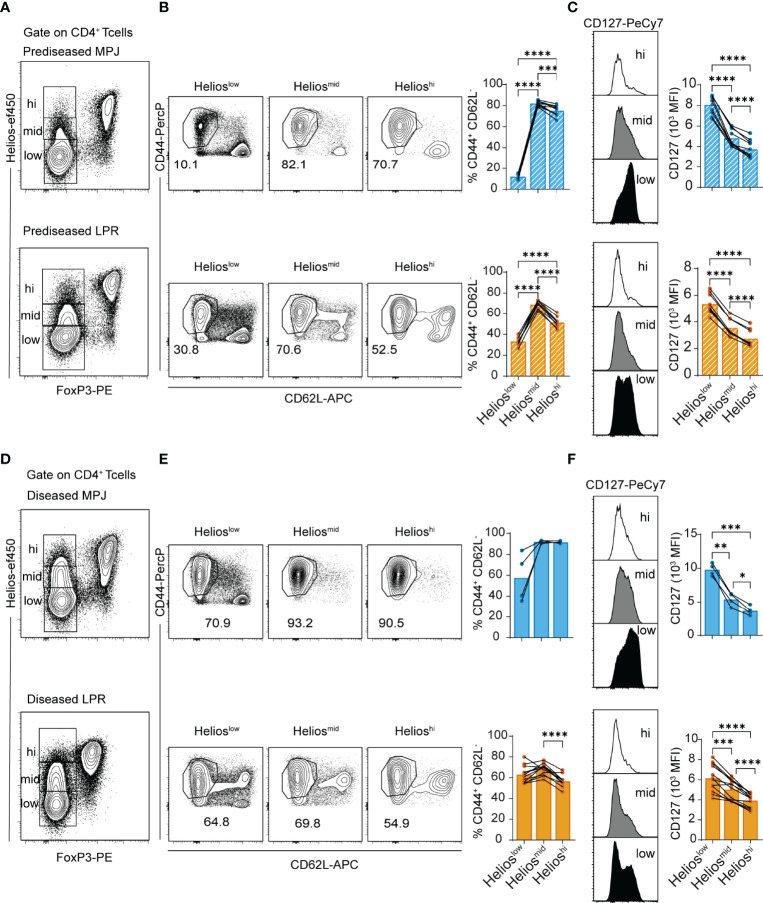
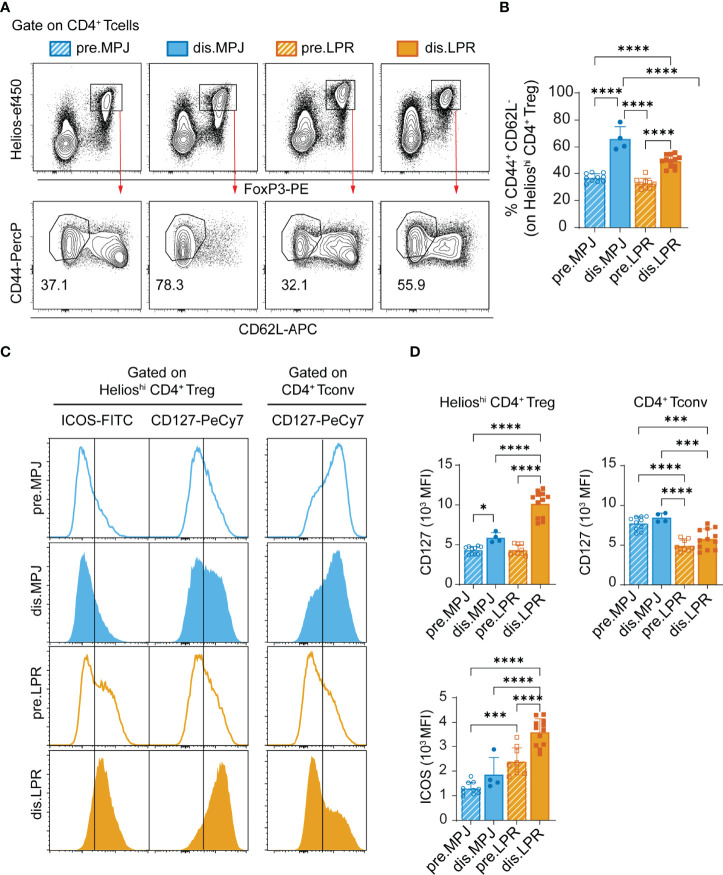
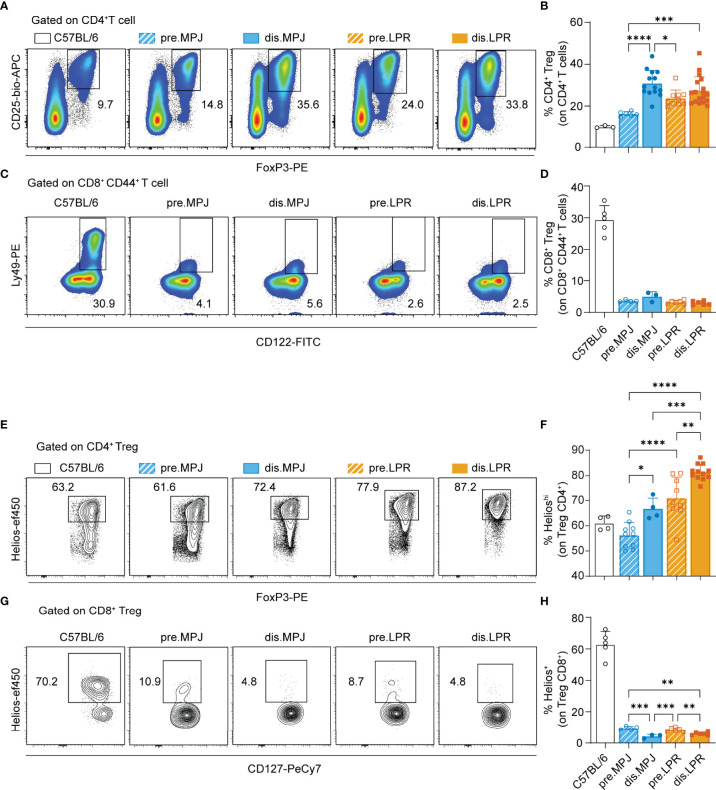
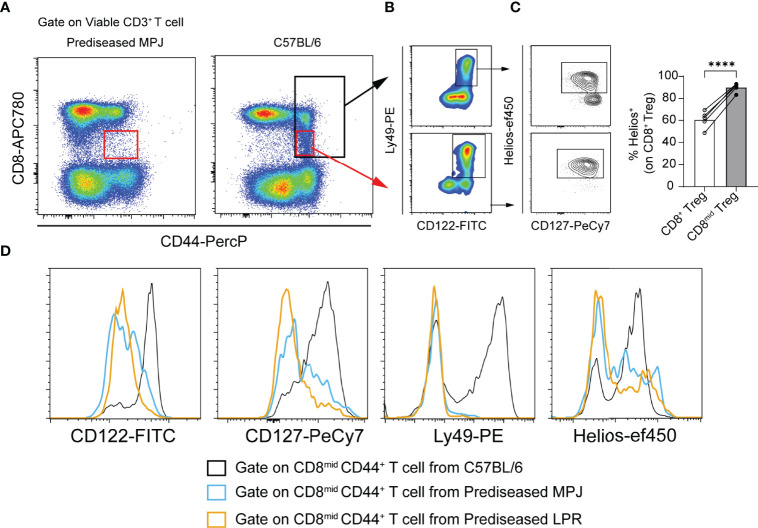
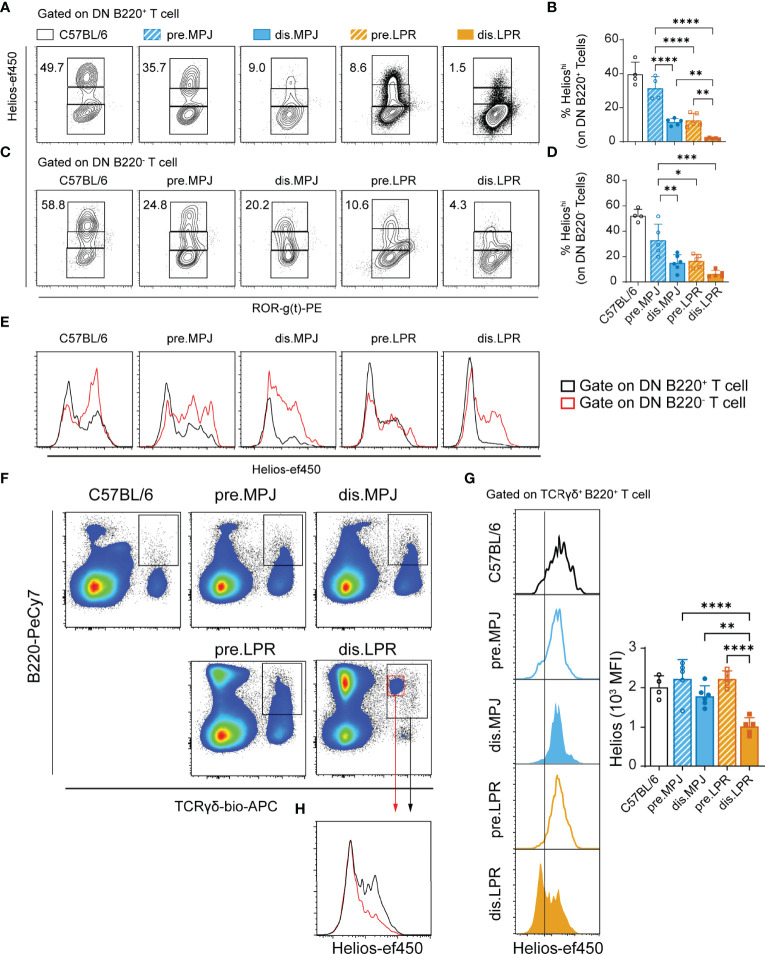
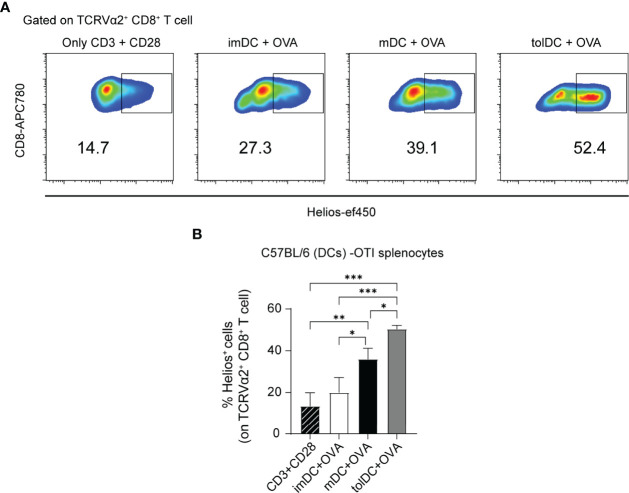
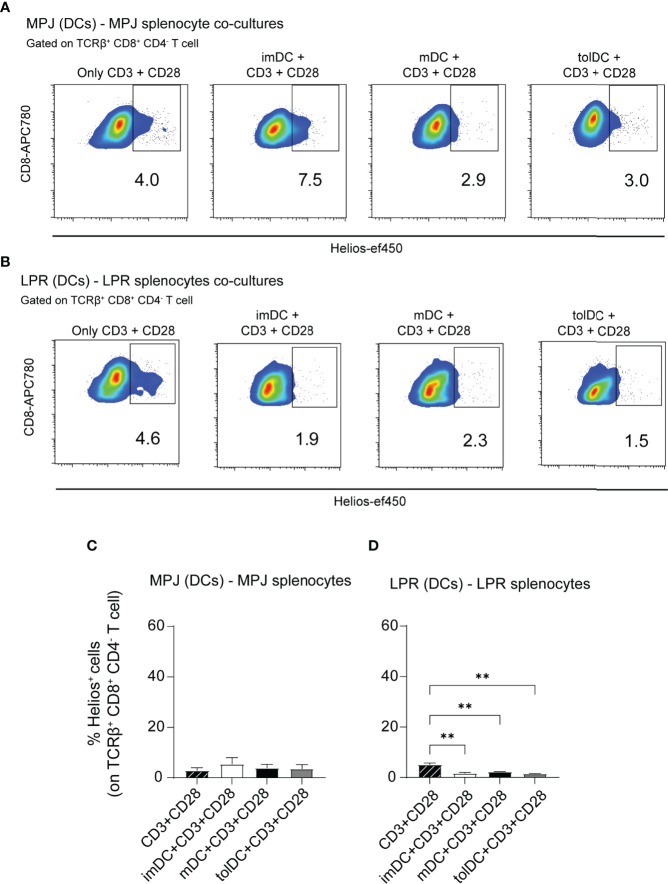
T-cell-mediated autoimmunity reflects an imbalance in this compartment that is not restored by tolerogenic immune cells, e.g., regulatory T cells or tolerogenic dendritic cells (tolDCs). Although studies into T-cell equilibrium have mainly focused on regulatory CD4+FoxP3+ T cells (CD4+ Tregs), recent findings on the lesser known CD8+ Tregs (CD44+CD122+Ly49+) have highlighted their non-redundant role in regulating lupus-like disease and their regulatory phenotype facilitated by the transcription factor Helios in mice and humans. However, there are still remaining questions about Helios regulation and dynamics in different autoimmune contexts. Here, we show the absence of CD8+ Tregs in two lupus-prone murine models: MRL/MPJ and MRL/lpr, in comparison with a non-prone mouse strain like C57BL/6. We observed that all MRL animals showed a dramatically reduced population of CD8+ Tregs and a greater Helios downregulation on diseased mice. Helios induction was detected preferentially on CD8+ T cells from OT-I mice co-cultured with tolDCs from C57BL/6 but not in MRL animals. Furthermore, the Helios profile was also altered in other relevant T-cell populations implicated in lupus, such as CD4+ Tregs, conventional CD4+, and double-negative T cells. Together, these findings could make Helios a versatile maker across the T-cell repertoire that is capable of differentiating lupus disease states.

Keywords: CD8+ Treg; Helios; autoimmunity; dendritic cells; lupus; tolerance; tolerogenic DC.


Conflict of interest statement

The authors declare that the research was conducted in the absence of any commercial or financial relationships that could be construed as a potential conflict of interest.

Figures

Figure 1
Figure 1
Characterization of MPJ and LPR mice differentiating two lupus disease states. (A) Spleen weight (left) and cell number (right). (B) Levels of Ig(G+A+M) antibodies against double-stranded DNA (dsDNA) determined by ELISA. (C) Protein concentration in urine (0, 30, 100, and 500 mg/dl) determined using urine dipsticks. (D) Representative immunofluorescence images from frozen kidney sections (4–10 µm) stained with DAPI (4′,6-diamidino-2-phenylindole) (blue), goat anti-mouse IgG (green) for immunocomplexes (top), and a primary rat anti-mouse F4/80 with secondary goat anti-rat IgG (green) for macrophages (bottom). Scale bar is 50 µm. (E) Representative flow cytometry plots gated on splenic CD4+ T cells (CD3+B220CD8CD4+) showing effector (Eff), effector memory (EM), central memory (CM), and naïve (N) gates. (F) Proportion of effector (Eff: CD44+CD62LCD25+CD69+) and effector memory (EM: CD44+CD62LCD25) phenotypes among splenic CD4+ T cells. The data represent the mean ± SD: *P < 0.05; **P < 0.01; ***P < 0.001; ****P < 0.0001 by one-way ANOVA with a Tukey multi-comparison post-test. Each point represents a single animal: prediseased MPJ (pre.MPJ), n = 20 (A) 10 (B) 6 (C) and 8 (E, F) diseased MPJ (dis.MPJ), n = 40 (A) 13 (B) 13 (C) and 14 (E, F); prediseased LPR (pre.LPR), n = 31 (A) 11 (B) 12 (C) and 12 (E , F) diseased LPR (dis.LPR), n = 74 (A) 29 (B) 38 (C) and 14 (E, F).
Figure 2
Figure 2
Helios expression and effector phenotype of CD4+ Tconvs in MPJ and LPR mice. (A) Representative flow cytometry plots pregated on splenic CD4+ T cells (CD3+CD4+) from prediseased MPJ (top) and LPR (bottom) mice, in which three different CD4+ Tconv (FoxP3) populations are indicated through their Helios expression (Helioslow/mid/hi). (B) Representative effector phenotype (CD44+CD62L) plots of Helioslow, Heliosmid and Helioshi CD4+ Tconv cells, and their percentages (right) relative to prediseased MPJ and LPR mice. (C) Representative CD127 histograms gated on CD4+ Tconv Helioslow, Heliosmid, or Helioshi (left), and their MFI quantification (right) in prediseased MPJ and LPR mice. (D) Same as in (A) but from diseased mice. (E) Same as in (B) but from diseased mice. (F) Same as in (C) but from diseased mice. The data represent the mean ± SD: *P < 0.05; **P < 0.01; ***P < 0.001; ****P < 0.0001 by RM one-way ANOVA with a Tukey multi-comparison post-test. Each point represents a single animal: prediseased MPJ (pre.MPJ), n = 10 (A–C) diseased MPJ (dis.MPJ), n = 4 (A–C) prediseased LPR (pre.LPR), n = 9 (D–F) and diseased LPR (dis.LPR), n = 12 (D–F).
Figure 3
Figure 3
Helios expression and effector phenotype of CD4+ Tregs in MPJ and LPR mice. (A) Representative flow cytometry plots pregated on splenic CD4+ T cells (CD3+CD4+), in which Treg (FoxP3+Helioshi, top) and their effector (CD44+CD62L) populations (bottom) are indicated. (B) Percentage of splenic CD4+ Treg cells with an effector phenotype. (C) Representative ICOS and CD127 histograms gated on CD4+ Treg (left) and CD4+ Tconv (right). (D) MFI quantification of (C). The data represent the mean ± SD: *P < 0.05; ***P < 0.001; ****;P < 0.0001 by one-way ANOVA with a Tukey multi-comparison post-test. Each point represents a single animal: prediseased MPJ (pre.MPJ), n = 10 (A–D) diseased MPJ (dis.MPJ), n = 4 (A–D) prediseased LPR (pre.LPR), n = 9 (A–D) and diseased LPR (dis.LPR), n = 12 (A–D).
Figure 4
Figure 4
Helios expression in CD4+ and CD8+ Tregs from MPJ and LPR mice. (A) Representative flow cytometry plots pregated on splenic CD4+ T cells (CD3+CD8CD4+). The CD4+ Treg (CD25+FoxP3+) gates are indicated. (B) Percentage of CD4+ Tregs among the CD4+ T cells. (C) Representative flow cytometry plots pregated on splenic CD8+ CD44+ T cells (CD3+CD8+CD44+), in which the CD8+ Treg (CD122+Ly49+) gates are indicated. (D) Percentage of CD8+ Treg among CD8+ CD44+ T cells. (E) Representative flow cytometry plots pregated on CD4+ Tregs with the Helioshi gate indicated. (F) Percentage of Helioshi cells among CD4+ Tregs. (G) Representative flow cytometry plots pregated on CD8+ CD127+ Tregs, with the Helios+ gate indicated. (H) Percentage of Helios+ cells among CD8+ Tregs. The data represent the mean ± SD: *P < 0.05, **P < 0.01; ***,P < 0.001; ****,P < 0.0001 for comparisons between MRL animals. One-way ANOVA with a Tukey multi-comparison post-test was used. Each point represents a single animal: C57BL/6, n = 3 (A, B), 5 (C, D), 4 (E, F), and 5 (G, H); prediseased MPJ (pre.MPJ), n = 6 (A, B), 4 (C, D), 10 (E, F), and 4 (G, H); diseased MPJ (dis.MPJ), n = 14 (A, B), 3 (C, D), 4 (E, F), and 3 (G, H); prediseased LPR (pre.LPR), n = 10 (A, B), 4 (C, D), 9 (E, F), and 4 (G, H); and diseased LPR (dis.LPR), n = 18 (A, B), 6 (C, D), 12 (E, F), and 6 (G, H).
Figure 5
Figure 5
Phenotypic analysis of CD8mid CD44+ populations in prediseased MPJ and LPR mice. (A) Representative flow cytometry plots pregated on viable CD3+ T cell from prediseased MPJ (left) and C57BL/6 mice (right). (B) Representative flow cytometry plots of CD8+CD44+ and CD8midCD44+ gates from C57BL/6 mice and their Treg phenotype. (C) Percentage of Helios+ cells among CD8+ and CD8mid Tregs. The data represent the mean values. (D) Representative histograms pregated on CD8midCD44+ T cells from C57BL/6 (black), prediseased MPJ (blue), and prediseased LPR mice (orange): ****P < 0.0001 by a paired Student t-test. Each point represents a single animal (C57BL/6, n = 5).
Figure 6
Figure 6
Helios levels in different T-cell subsets from MPJ and LPR mice. (A) Representative flow cytometry plots pregated on splenic DN B220+ T cells (CD3+TCRγδB220+CD4CD8), in which three different gates are indicated based on Helios expression (Helioslow/mid/hi). (B) Helioshi frequencies on DN B220+ T cells. (C) Representative flow cytometry plots pregated on splenic DN B220 T cells (CD3+TCRγδB220CD4CD8). (D) Helioshi frequencies among DN B220 T cells. (E) Representative histograms of Helios in DN T-cell populations: DN B220+ (black) and DN B220 (red). (F) Representative flow cytometry plots pregated on splenic CD3+ T cells, indicating the TCRγδ+ B220+ gates. (G) Representative Helios histograms gated on TCRγδ+ B220+ (left) and their quantification (MFI: right). (H) Representative Helios histograms comparing two distinct TCRγδ+ B220+ subsets (red and black) from diseased LPR mice. The data represent the mean ± SD: *P < 0.05, **P < 0.01, ***P < 0.001, ****P < 0.0001 for comparisons between MRL animals. One-way ANOVA with a Tukey multi-comparison post-test. Each point represents a single animal: prediseased MPJ (pre.MPJ), n = 5 (A–D, G); diseased MPJ (dis.MPJ), n = 6 (A–D, G); prediseased LPR (pre.LPR), n = 5 (A–D, G); and diseased LPR (dis.LPR), n = 5 (A–D, G).
Figure 7
Figure 7
Helios expression in CD8+ T cells from OT-I mice co-cultured with different types of DCs. (A) Representative flow cytometry plots gated on TCRVα2+ CD8+ showing Helios expression in a 3-day co-culture experiment. Bone marrow dendritic cells (DCs): immature (imDC), mature (mDC), and tolerogenic (tolDC) from C57BL/6 were co-cultured with splenocytes from OT-I mice in presence of OVA. As a positive control of stimulation, anti-CD3 and anti-CD28 antibodies were used. (B) Percentage of Helios+ cells among TCRVα2+ CD8+ T cells. The data represent the mean ± SD: *P < 0.05; **P < 0.01; ***P < 0.001 by one-way ANOVA with a Tukey multi-comparison post-test (n = 2–4 independent experiments).
Figure 8
Figure 8
Helios expression in CD8+ T cells from MRL mice co-cultured with different types of DCs. (A) Representative flow cytometry plots gated on TCRβ+CD8+CD4 T cells showing Helios expression in a 3-day co-culture experiment with bone marrow derived dendritic cells (DCs) and splenocytes from MPJ mice in the presence of CD3 and CD28 stimuli. (B) Representative flow cytometry plots gated on TCRβ+CD8+CD4 T cells showing Helios expression in 3-day co-culture experiments with bone marrow–derived DCs and splenocytes from LPR mice, in the presence of CD3 and CD28 stimuli. (C) Percentage of Helios+ cells among MPJ TCRβ+CD8+CD4 T cells. (D) Percentage of Helios+ cells among LPR TCRβ+CD8+CD4 T cells. The data represent the mean ± SD: **P < 0.01 by one-way ANOVA with a Tukey multi-comparison post-test (n = 2–4 independent experiments).
Figure 9
Figure 9
In vitro and in vivo phenotypic analysis of DCs from MPJ and LPR mice. (A) Percentages of splenic plasmacytoid (pDC: CD11clowCD11b-B220+PDCA-1+CD3/CD19, left), conventional type 1 (cDC1: CD11chiCD11bCD8α+B220PDCA-1CD3/CD19, middle), and conventional type 2 (cDC2: CD11chiCD11b+CD8αB220PDCA-1CD3/CD19, right) dendritic cells (DCs) among the total viable cells from MPJ and LPR mice. (B) Quantification (MFI) of the MHCII expression on pDCs (left), cDC1 (middle), and cDC2 (right). (C) Quantification (MFI) of the CD244.1 expression on pDCs (left), cDC1 (middle), and cDC2 (right). (D) Representative histograms of (B) (top) and (C) (bottom). The data represent the mean ± SD: *P < 0.05; **P < 0.01; ***P < 0.001; ****P < 0.0001 by one-way ANOVA with a Tukey multi-comparison post-test. Each point represents a single animal: prediseased MPJ (pre.MPJ), n = 8 (A–C); diseased MPJ (dis.MPJ), n = 10 (A–C); prediseased LPR (pre.LPR), n = 4–12 (A–C); and diseased LPR (dis.LPR), n = 16 (A–C). (E) Quantification (MFI) of different DC markers on immature (imDC), mature (mDC), and tolerogenic (tolDC) DCs from the bone marrow of MPJ and LPR mice. The data represent the mean ± SD: +P < 0.05, ++P < 0.01, +++P < 0.001, and ++++P < 0.0001 for comparisons between imDCs, mDCs, and tolDCs from MPJ or LPR animals; and ##P < 0.01, ###P < 0.001, and ####P < 0.0001 for the comparisons between mDCs from MPJ and LPR animals, using a two-way ANOVA with a Tukey multi-comparison post-test.

Similar articles

Cited by

References

    1. Wang L, Wang FS, Gershwin ME. Human Autoimmune Diseases: A Comprehensive Update. J Intern Med (2015) 278(4):369–95. doi: 10.1111/joim.12395 - DOI - PubMed
    1. Tsokos GC. Autoimmunity and Organ Damage in Systemic Lupus Erythematosus. Nat Immunol (2020) 21(6):605–14. doi: 10.1038/s41590-020-0677-6 - DOI - PMC - PubMed
    1. Suarez-Fueyo A, Bradley SJ, Tsokos GC. T Cells in Systemic Lupus Erythematosus. Curr Opin Immunol (2016) 43:32–8. doi: 10.1016/j.coi.2016.09.001 - DOI - PMC - PubMed
    1. Chen PM, Tsokos GC. T Cell Abnormalities in the Pathogenesis of Systemic Lupus Erythematosus: An Update. Curr Rheumatol Rep (2021) 23(2):12. doi: 10.1007/s11926-020-00978-5 - DOI - PMC - PubMed
    1. Mizui M, Tsokos GC. Targeting Regulatory T Cells to Treat Patients With Systemic Lupus Erythematosus. Front Immunol (2018) 9:786. doi: 10.3389/fimmu.2018.00786 - DOI - PMC - PubMed

Publication types

Substances