

Limb Mesoderm and Head Ectomesenchyme Both Express a Core Transcriptional Program During Chondrocyte Differentiation
- PMID: 35784462
- PMCID: PMC9247276
- DOI: 10.3389/fcell.2022.876825
Limb Mesoderm and Head Ectomesenchyme Both Express a Core Transcriptional Program During Chondrocyte Differentiation
Abstract
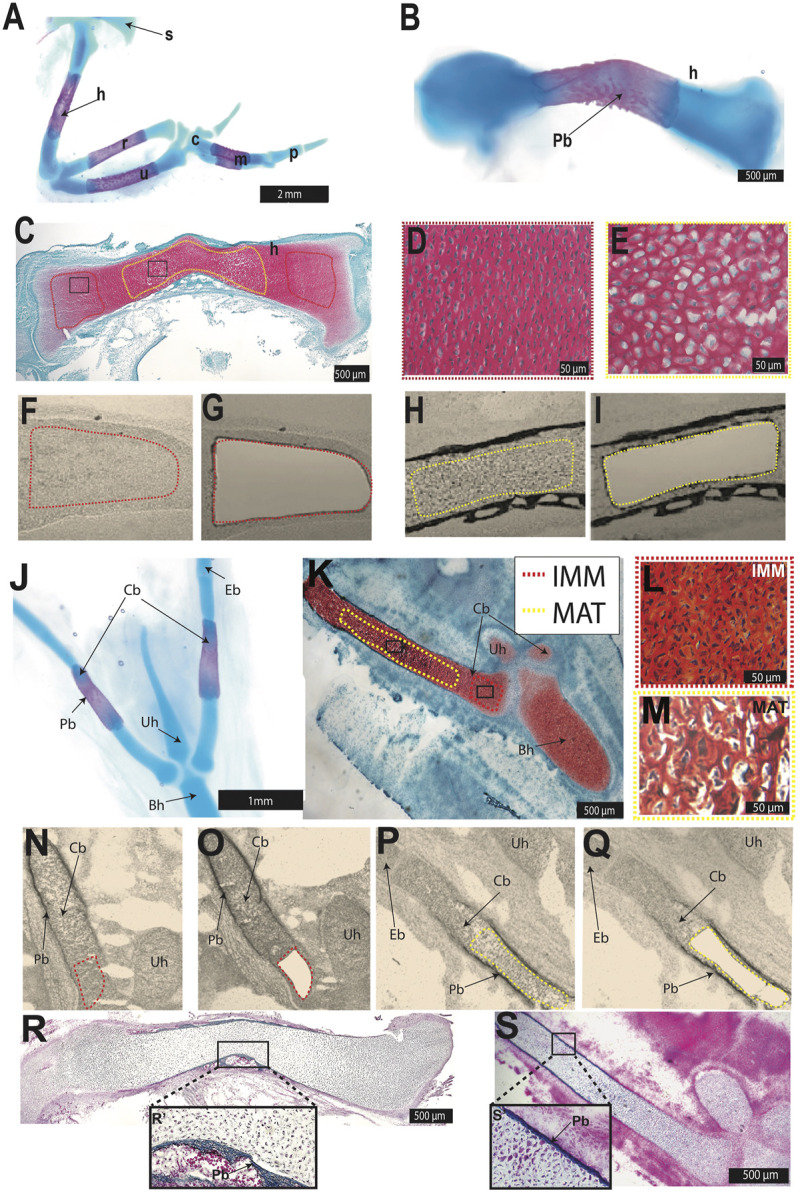
To explain how cartilage appeared in different parts of the vertebrate body at discrete times during evolution, we hypothesize that different embryonic populations co-opted expression of a core gene regulatory network (GRN) driving chondrocyte differentiation. To test this hypothesis, laser-capture microdissection coupled with RNA-seq was used to reveal chondrocyte transcriptomes in the developing chick humerus and ceratobranchial, which are mesoderm- and neural crest-derived, respectively. During endochondral ossification, two general types of chondrocytes differentiate. Immature chondrocytes (IMM) represent the early stages of cartilage differentiation, while mature chondrocytes (MAT) undergo additional stages of differentiation, including hypertrophy and stimulating matrix mineralization and degradation. Venn diagram analyses generally revealed a high degree of conservation between chondrocyte transcriptomes of the limb and head, including SOX9, COL2A1, and ACAN expression. Typical maturation genes, such as COL10A1, IBSP, and SPP1, were upregulated in MAT compared to IMM in both limb and head chondrocytes. Gene co-expression network (GCN) analyses of limb and head chondrocyte transcriptomes estimated the core GRN governing cartilage differentiation. Two discrete portions of the GCN contained genes that were differentially expressed in limb or head chondrocytes, but these genes were enriched for biological processes related to limb/forelimb morphogenesis or neural crest-dependent processes, respectively, perhaps simply reflecting the embryonic origin of the cells. A core GRN driving cartilage differentiation in limb and head was revealed that included typical chondrocyte differentiation and maturation markers, as well as putative novel "chondrocyte" genes. Conservation of a core transcriptional program during chondrocyte differentiation in both the limb and head suggest that the same core GRN was co-opted when cartilage appeared in different regions of the skeleton during vertebrate evolution.
Keywords: GRN co-option; GRN evolution; chondrocytes; head cartilage; limb cartilage.
Copyright © 2022 Gomez-Picos, Ovens and Eames.
Conflict of interest statement
The authors declare that the research was conducted in the absence of any commercial or financial relationships that could be construed as a potential conflict of interest.
Figures


Similar articles
-
Common features of cartilage maturation are not conserved in an amphibian model.Dev Dyn. 2023 Nov;252(11):1375-1390. doi: 10.1002/dvdy.594. Epub 2023 Apr 29. Dev Dyn. 2023. PMID: 37083105
-
Chondrocyte maturation bridges two cross-inhibitory subnetworks of the skeletal cell gene regulatory network.Development. 2025 Jun 1;152(11):dev204496. doi: 10.1242/dev.204496. Epub 2025 May 29. Development. 2025. PMID: 40440101
-
Targeted expression of SHH affects chondrocyte differentiation, growth plate organization, and Sox9 expression.J Bone Miner Res. 2004 Oct;19(10):1678-88. doi: 10.1359/JBMR.040706. Epub 2004 Jul 12. J Bone Miner Res. 2004. PMID: 15355563
-
On the evolutionary relationship between chondrocytes and osteoblasts.Front Genet. 2015 Sep 23;6:297. doi: 10.3389/fgene.2015.00297. eCollection 2015. Front Genet. 2015. PMID: 26442113 Free PMC article. Review.
-
Runx2, an inducer of osteoblast and chondrocyte differentiation.Histochem Cell Biol. 2018 Apr;149(4):313-323. doi: 10.1007/s00418-018-1640-6. Epub 2018 Jan 22. Histochem Cell Biol. 2018. PMID: 29356961 Review.
Cited by
-
Distinct gene regulatory dynamics drive skeletogenic cell fate convergence during vertebrate embryogenesis.Nat Commun. 2025 Mar 4;16(1):2187. doi: 10.1038/s41467-025-57480-8. Nat Commun. 2025. PMID: 40038298 Free PMC article.
-
Sox10 is required for systemic initiation of bone mineralization.Development. 2025 Jan 15;152(2):dev204357. doi: 10.1242/dev.204357. Epub 2025 Jan 20. Development. 2025. PMID: 39791977 Free PMC article.
-
Characterization of Chromatin Accessibility in Fetal Bovine Chondrocytes.Animals (Basel). 2023 Jun 5;13(11):1875. doi: 10.3390/ani13111875. Animals (Basel). 2023. PMID: 37889831 Free PMC article.
-
The IFITM5 mutation in osteogenesis imperfecta type V is associated with an ERK/SOX9-dependent osteoprogenitor differentiation defect.J Clin Invest. 2024 Jun 17;134(15):e170369. doi: 10.1172/JCI170369. J Clin Invest. 2024. PMID: 38885336 Free PMC article.
-
Proteoglycan inhibition of canonical BMP-dependent cartilage maturation delays endochondral ossification.Development. 2024 Jan 15;151(2):dev201716. doi: 10.1242/dev.201716. Epub 2024 Jan 12. Development. 2024. PMID: 38117077 Free PMC article.
References
-
- Akiyama H., Chaboissier M.-C., Martin J. F., Schedl A., de Crombrugghe B. (2002). The Transcription Factor Sox9 Has Essential Roles in Successive Steps of the Chondrocyte Differentiation Pathway and Is Required for Expression of Sox5 and Sox6. Genes Dev. 16, 2813–2828. 10.1101/gad.1017802 - DOI - PMC - PubMed
LinkOut - more resources
Full Text Sources
Molecular Biology Databases
Research Materials
Miscellaneous