. 2022 Jun 20;2(6):100235.
doi: 10.1016/j.crmeth.2022.100235.

Identification of the stress granule transcriptome via RNA-editing in single cells and in vivo

Affiliations

Identification of the stress granule transcriptome via RNA-editing in single cells and in vivo

Wessel van Leeuwen et al. Cell Rep Methods. .

Abstract

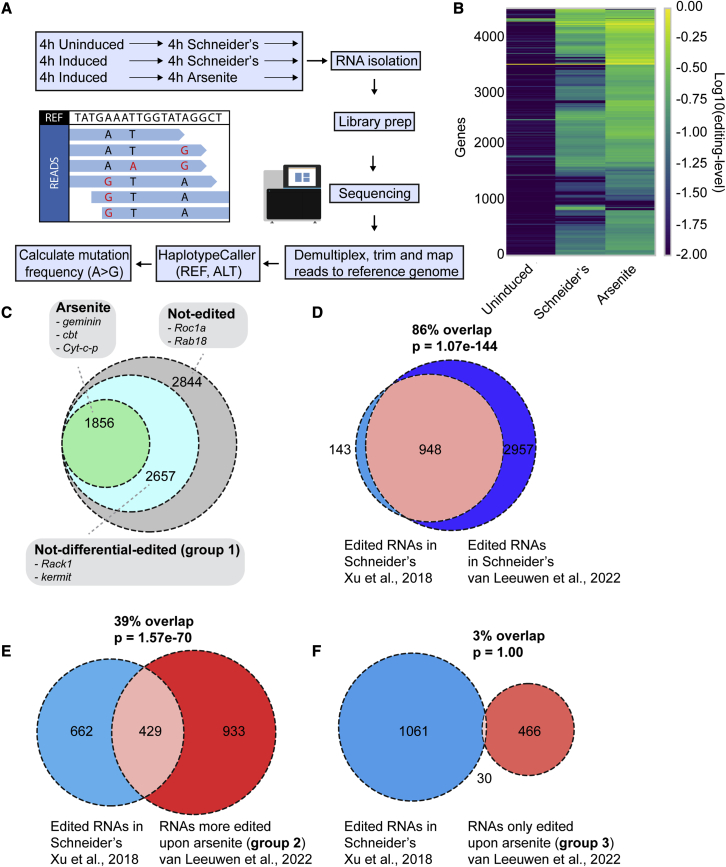
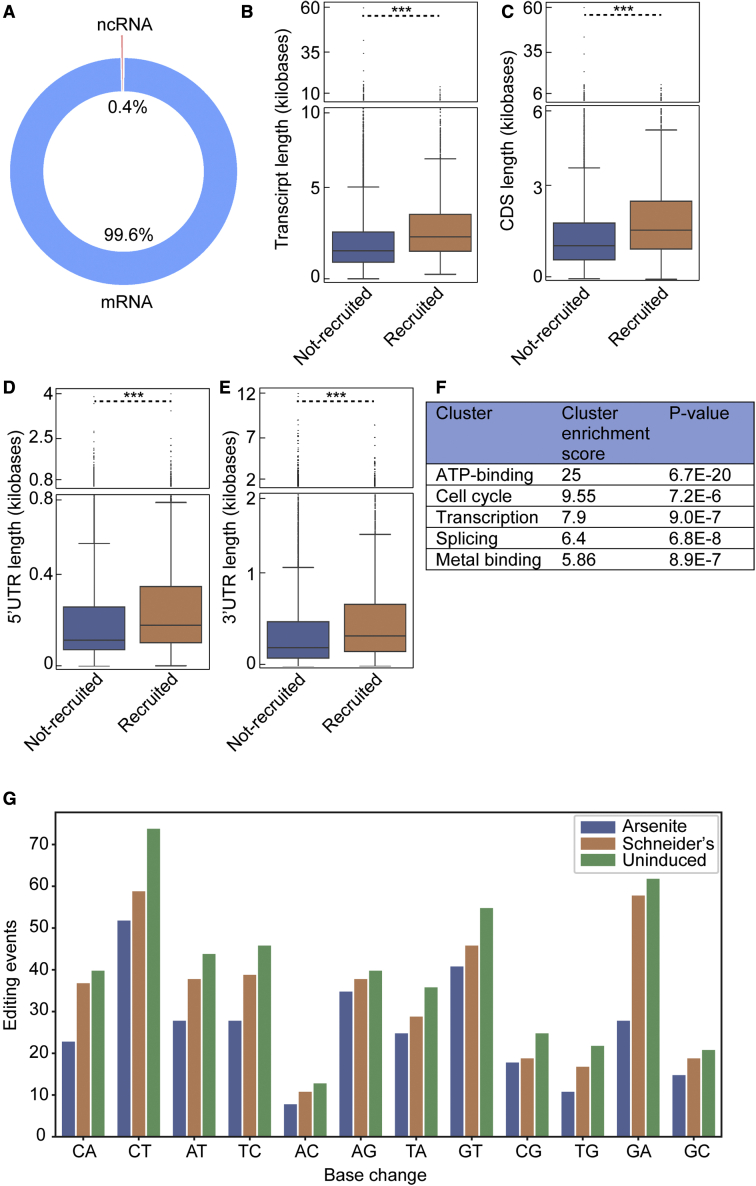
Stress granules are phase-separated assemblies formed around RNAs. So far, the techniques available to identify these RNAs are not suitable for single cells and small tissues displaying cell heterogeneity. Here, we used TRIBE (target of RNA-binding proteins identified by editing) to profile stress granule RNAs. We used an RNA-binding protein (FMR1) fused to the catalytic domain of an RNA-editing enzyme (ADAR), which coalesces into stress granules upon oxidative stress. RNAs colocalized with this fusion are edited, producing mutations that are detectable by VASA sequencing. Using single-molecule FISH, we validated that this purification-free method can reliably identify stress granule RNAs in bulk and single S2 cells and in Drosophila neurons. Similar to mammalian cells, we find that stress granule mRNAs encode ATP binding, cell cycle, and transcription factors. This method opens the possibility to identify stress granule RNAs and other RNA-based assemblies in other single cells and tissues.

Keywords: Drosophila; RNA; RNA-editing; S2 cells; VASA-seq; hyperTRIBE; neurons; single cell; stress granules.


Conflict of interest statement

The authors declare no competing interests.

Figures

None
Graphical abstract
Figure 1
Figure 1
Adaptation of HyperTRIBE using FMR1-ADARcd-V5 to detect stress granule RNAs (A) Schematic overview of our HyperTRIBE adaptation strategy using FMR1-ADARcd-V5 to predict stress granule RNAs. In growing cells, FMR1-ADARcd-V5 binds to its own client RNAs that can be edited in the cytosol. Upon arsenite stress, FMR1-ADARcd-V5 is recruited to stress granules. Allowing ADARcd to edit stress granule RNAs, its clients as well as other stress granule RNAs that are in close proximity. (B) Immunofluorescence visualization of FMR1-ADARcd-V5 (using anti-V5, green) in S2 cells in Schneider’s and in arsenite (0.5 mM for 4 h) leading to localization of FMR1-ADARcd-V5 with the known stress granule marker Caprin (red). (C) Western blot of S2 cell extract after 20 min and 4 h induction (+CuSO4) of different clones expressing FMR1-ADARcd-V5 using an anti-V5 antibody. This number indicated is the ratio “4 h/20 min induction” of the ratio “FMR1-ADARcd-V5/tubulin” for each clone (20 min is therefore 1). (D and E) Graph displaying the frequency (D) and total (E) of A>G editing events in S2 cells in which the expression of FMR1-ADARcd-V5 was induced for 20 min and 4 h. Scale bar: 10 μm (B).
Figure 2
Figure 2
RNA editing through ADAR predicts the stress granule transcriptome in S2 cells (A) Schematic overview of the workflow. After induction of the FMR1-ADARcd-V5 expression for 4 h in Schneider’s, cells were either maintained in Schneider’s or treated with 0.5 mM arsenite for 4 h. RNA was isolated, and libraries were generated and sequenced. Reads were processed by demultiplexing, trimming and mapping to the reference genome. The mapped reads were consequently subjected to a haplotype caller to detect base editing events (see Figure S4). The frequency of A>G editing events is calculated per gene, per sample and per condition. (B) Heatmap displaying the editing level per gene and per condition. (C) Venn diagram depicting the number of RNAs that were significantly (p < 0.01) more edited upon arsenite after applying the Empirical Bayes statistical test. (D) Venn diagram depicting the percentage of RNAs that are edited in Schneider’s and that overlap with the established FMR1 clients (1,091) (Xu et al., 2018). The overlap (p value) was calculated using a Hypergeometric test. (E and F) Venn diagram depicting the percentage of RNAs that were more edited in Schneider’s and more edited upon arsenite (group 2, E), RNAs that were only edited upon arsenite (group 3, F) and that overlap with the established FMR1 clients (Xu et al., 2018).
Figure 3
Figure 3
Potential stress granule RNAs identified by RNA editing are validated by single-molecule FISH (A) Visualization by smFISH of Rack1 and kermit mRNAs (group 1). (B) Visualization by smFISH of cbt and red mRNAs (group 2). (C) Visualization by smFISH of geminin and Prosβ4 mRNAs (group 3). (D) Quantification of the number per cell of RNA molecules in stress granules (colocalization with FMR1). (E) Scatterplot displaying the number of RNA molecules in stress granules (FMR1 positive) versus the fold change editing upon arsenite compared to Schneider’s. Scale bar: 10 μm (A, B, C).
Figure 4
Figure 4
Features of the identified stress granule RNAs (A) Chart depicting the types of RNAs predicted to be in stress granules. (B–E) Boxplots displaying the length of transcripts (B), CDS (C), 5′UTRs (D), and 3′UTRs (E) of the mRNAs predicted to be in stress granules (recruited) and of the RNAs that were predicted not recruited. ∗∗∗p value < 0.001 (Mann-Whitney U test). (F) Gene enrichment analysis (using DAVID) of the RNAs predicted to be localized in stress granules upon arsenite. (G) Editing events per possible base change in intronic RNA sequences of bulk S2 cells.
Figure 5
Figure 5
Identification of stress granule RNAs in single cells (A) Countplot displaying the number of editing events per possible base change in single cells. (B) Boxplot of the mean editing frequency of all genes per single cell for each condition. Each black dot represents a single cell. ∗∗∗p value < 0.001. (C) Scatterplot displaying the mean editing frequency (A-to-G) over all genes per single cell versus the number of ADAR transcripts per cell. (D) Venn diagram depicting the overlap of RNAs significantly (p < 0.01) more edited upon arsenite in bulk and in pseudobulk (pooled single cells). (E) Volcano plot depicting the log-fold change in editing and the significancy (p < 0.01, dashed line) for all detected RNAs in pseudobulk. (F) Heatmap of the editing level per gene per single cell (360 cells in total). The last column is from bulk sequencing (S = Schneider’s, A = arsenite).
Figure 6
Figure 6
Stress granule formation in Drosophila neurons (A) Schematic overview of the workflow. elav-GeneSwitch-Gal4/FMR1-ADARcd-V5 expressing third instar larvae were exposed to RU486 by larval bathing to allow the expression of FMR1-ADARcd-V5 specifically in neurons. The dissociated brain cells were exposed to 0.5 mM arsenite for 4 h. Finally, the total RNA was isolated, sequenced, and the RNA editing analyzed. (B) Immunofluorescence visualization of FMR1-ADARcd-V5 (anti-V5, red) in dissociated Drosophila brain cells from mock (80% ethanol) and RU486 (3 mg/mL) bathed third instar larvae. Quantification in (B’). (C and D) Immunofluorescence visualization of FMR1-ADARcd-V5 (anti-V5, red), the glial cell marker Repo (cyan, C) and the neuronal marker Elav (cyan, D) in dissociated Drosophila brain cells. Quantification in (C’ and D’). (E) Immunofluorescence visualization of FMR1-ADARcd-V5 (anti-V5, red) in dissociated Drosophila brain cells upon incubation in Schneider’s and upon arsenite (0.5 mM for 4 h) leading to FMR1-ADARcd-V5 localization in stress granules together with Caprin (green). (F) Visualization of polyadenylated mRNAs (red) in arsenite-stressed (0.5 mM for 4 h) neurons by RNA FISH using an oligo(T) probe, in FMR1-ADARcd-V5 positive stress granules. Scale bar: 10 μm (B, C, D, E); 5 μm (F).
Figure 7
Figure 7
RNA editing through ADAR predicts the stress granule transcriptome of dissociated Drosophila neurons (A) Heatmap displaying the editing level per gene and per condition. (B) Venn diagram depicting the number of RNAs that were significantly (p < 0.01) more edited upon arsenite after applying the Empirical Bayes statistical test on the data set. (C) Visualization of row, wdn, wal, and Rack1 mRNA (red) by smFISH in wild-type neurons. Row, wdn, and wal were all more significantly (p < 0.01) more edited upon arsenite compared with Schneider’s in neurons, while Rack1 is not. Stress granules are marked with endogenous FMR1 (green). Quantification of the number of RNAs co-localizing with FMR1 (stress granules) in (C’). (D) Chart depicting the types of RNAs in stress granules. (E–H) Boxplots displaying the length of transcripts (E), CDS (F), 5′UTRs (G), and 3′UTRs (H) of the mRNAs predicted to be in stress granules (recruited) and of the mRNAs that were predicted not recruited in neurons. ∗∗∗p value < 0.001 (Mann-Whitney U test). (I) Gene enrichment analysis of the RNAs predicted to be localized in stress granules upon arsenite in neurons (cluster analysis using DAVID). (J) Venn diagram depicting the overlap of RNAs significantly (p < 0.01) more edited upon arsenite in S2 cells and in Drosophila neurons. Scale bar: 3 μm (C).

References

    1. Aguilera-Gomez A., Zacharogianni M., Van Oorschot M.M., Genau H., Grond R., Veenendaal T., Sinsimer K.S., Gavis E.R., Behrends C., Rabouille C. Phospho-rasputin stabilization by Sec16 is required for stress granule formation upon amino acid starvation. Cell Rep. 2017;20:935–948. doi: 10.1016/j.celrep.2017.06.042. - DOI - PMC - PubMed
    1. Anders M., Chelysheva I., Goebel I., Trenkner T., Zhou J., Mao Y., Verzini S., Qian S.B., Ignatova Z. Dynamic m(6)A methylation facilitates mRNA triaging to stress granules. Life Sci. Alliance. 2018;1 doi: 10.26508/lsa.201800113. - DOI - PMC - PubMed
    1. Anderson P., Kedersha N. Stressful initiations. J. Cell Sci. 2002;115:3227–3234. doi: 10.1242/jcs.115.16.3227. - DOI - PubMed
    1. Aoki S.T., Lynch T.R., Crittenden S.L., Bingman C.A., Wickens M., Kimble J. C. elegans germ granules require both assembly and localized regulators for mRNA repression. Nat. Commun. 2021;12:996. doi: 10.1038/s41467-021-21278-1. - DOI - PMC - PubMed
    1. Aulas A., Fay M.M., Lyons S.M., Achorn C.A., Kedersha N., Anderson P., Ivanov P. Stress-specific differences in assembly and composition of stress granules and related foci. J. Cell Sci. 2017;130:927–937. doi: 10.1242/jcs.199240. - DOI - PMC - PubMed

Publication types