. 2022 Jun 13;2(6):100238.
doi: 10.1016/j.crmeth.2022.100238. eCollection 2022 Jun 20.

Development of an HIV reporter virus that identifies latently infected CD4+ T cells

Affiliations

Development of an HIV reporter virus that identifies latently infected CD4+ T cells

Eun Hye Kim et al. Cell Rep Methods. .

Abstract

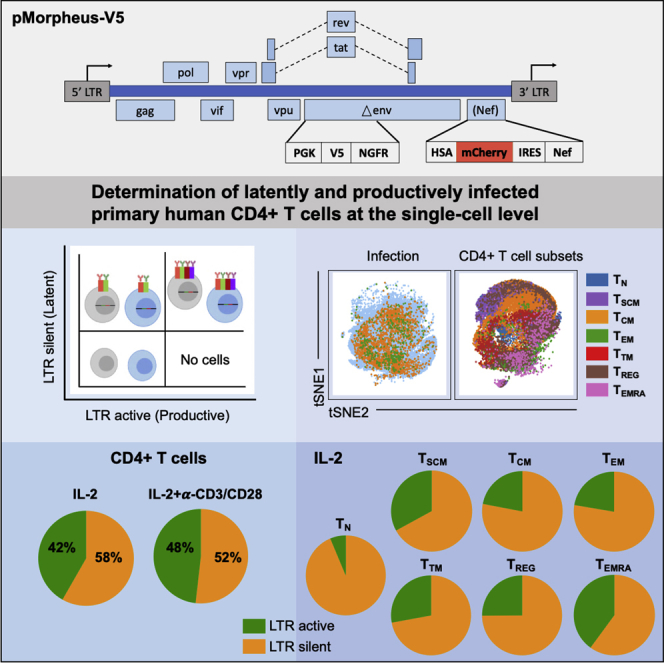
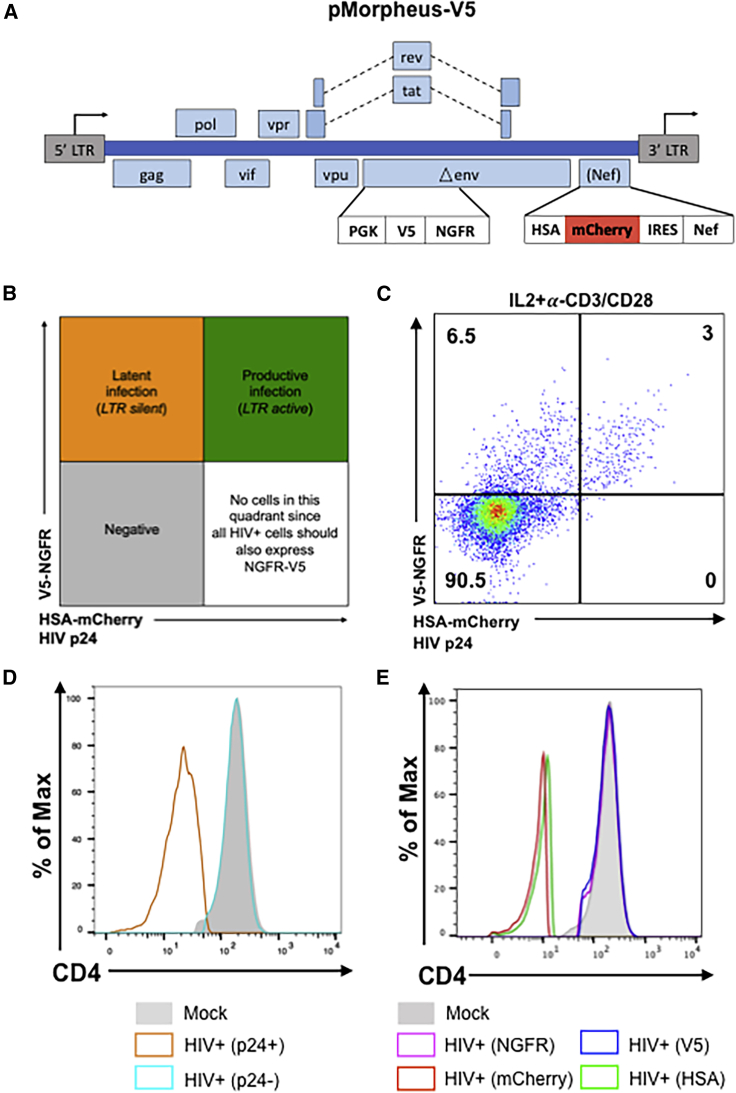
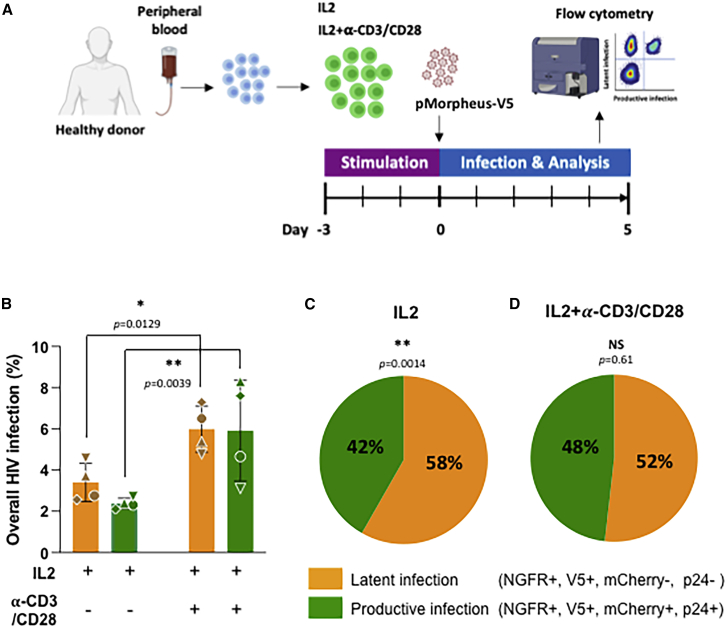
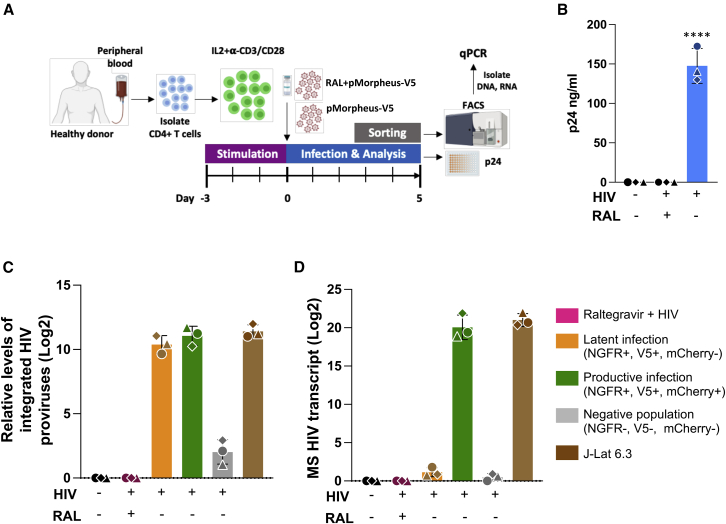
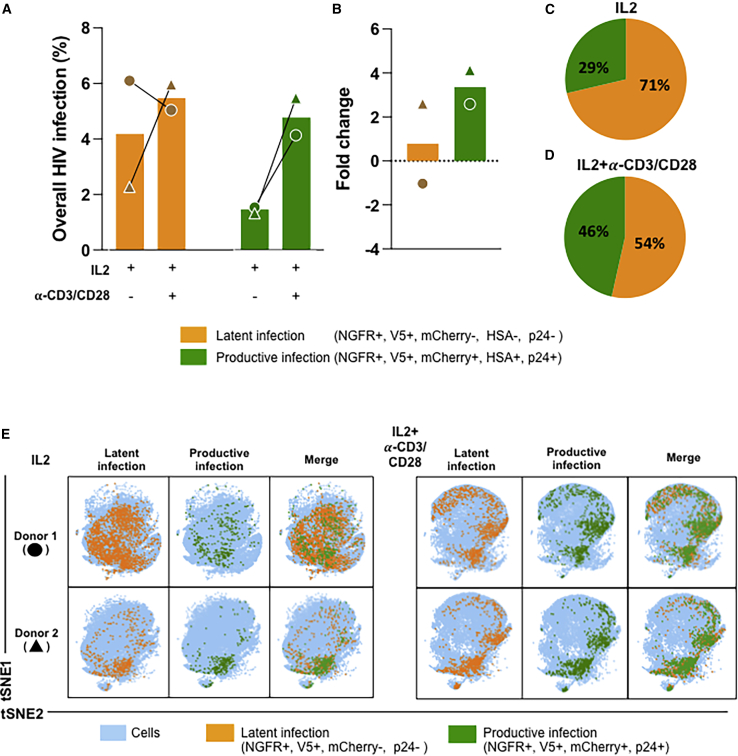
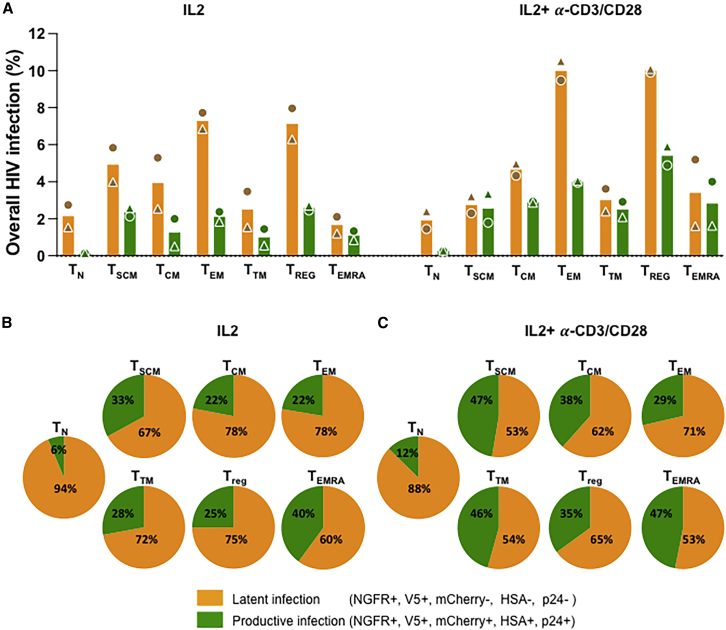
There is no cure for HIV infection, as the virus establishes a latent reservoir, which escapes highly active antiretroviral treatments. One major obstacle is the difficulty identifying cells that harbor latent proviruses. We devised a single-round viral vector that carries a series of versatile reporter molecules that are expressed in an LTR-dependent or LTR-independent manner and make it possible to accurately distinguish productive from latent infection. Using primary human CD4+ T cells, we show that transcriptionally silent proviruses are found in more than 50% of infected cells. The latently infected cells harbor proviruses but lack evidence for multiple spliced transcripts. LTR-silent integrations occurred to variable degrees in all CD4+ T subsets examined, with CD4+ TEM and CD4+ TREG displaying the highest frequency of latent infections. This viral vector permits the interrogation of HIV latency at single-cell resolution, revealing mechanisms of latency establishment and allowing the characterization of effective latency-reversing agents.

Keywords: CD4+ T memory cells; CD4+ T stem cells; CD4+ T cell subsets; HIV integration; HIV persistence; HIV reservoir; HIV-1; latency establishment; mass cytometry; reporter virus.


Conflict of interest statement

The authors declare no competing interests.

Figures

None
Graphical abstract
Figure 1
Figure 1
Description and characterization of the pMorpheus-V5 viral reporter vector (A) Representation of the HIV reporter viral vector pMorpheus-V5 (pLAI2-V5-NGFR HSA-mCherry-IRES-Nef). (B) Gating strategy to identify cells latently or productively infected by pMorpheus-V5 using flow cytometry or CyTOF is depicted. (C) Latently (V5+, NGFR+) or productively (HSAPOS, mCherryPOS, V5POS, NGFRPOS, p24POS) infected, IL-2 + α-CD3/CD28-stimulated CD4+ T cells were identified using flow cytometry after infection with pMorpheus-V5. The data show one representative example of four independent experiments using cells from different healthy donors. The percentage of CD4+ T cells in each quadrant is indicated. (D) Nef down-regulates CD4 levels during pMorpheus-V5 infection. CD4+ T cells from two different donors were stimulated with IL-2 + α-CD3/CD28 and infected with pMorpheus-V5. CyTOF was performed 5 days post-infection (dpi). Histogram plots show the CD4 expression for uninfected cells (shaded light gray), p24POS cells (orange), and p24NEG cells (light blue). The data were analyzed using FlowJo. (E) Cells were stimulated with IL-2 + α-CD3/CD28 prior to infection with p-Morpheus-V5. Histogram analysis of CD4 expression levels of NGFR (magenta), V5 (blue), mCherry (red), or HSA (green) positive cells. The data were analyzed using FlowJo. Data from two independent donors.
Figure 2
Figure 2
Identification of latently and productively infected CD4+ T cells (A) Experimental design to analyze CD4+ T cells infected with pMorpheus-V5. CD4+ T cells from four healthy donors were stimulated with IL-2 or a combination of IL-2 with α-CD3/CD28 antibody-coated beads for 3 days prior to infection with pMorpheus-V5. The frequency of latently and productively infected cells was determined 5 dpi using flow cytometry. (B) Frequency of latently (V5POS, NGFRPOS; yellow) and productively (mCherryPOS, V5POS, NGFRPOS, p24POS; green) infected CD4+ T cells stimulated with IL-2 alone or IL-2/α-CD3/CD28. Cells were analyzed using flow cytometry 5 dpi. Each of the four healthy donors is identified by symbol. Error bars represent the average ± SD, and statistical significance was established using unpaired t test. (C) Relative proportion of pMorpheus-V5 latently (yellow) or productively (green) infected CD4+ T cells stimulated with IL-2 is shown. The data represent the average of the four healthy donors. Average LTR-silent 58% ± 4% versus average LTR-active 42% ± 4% (p = 0.0014, unpaired t test). (D) Relative proportion of pMorpheus-V5 latently (yellow) or productively (green) infected CD4+ T cells activated with α-CD3/CD28. The data represent the average of the four individual healthy donors. Average LTR-silent 52% ± 8% versus average LTR-active 48% ± 8% (p = 0.61, t test).
Figure 3
Figure 3
Quantification of proviruses and multiply spliced HIV transcripts in FACS-sorted CD4+ T cells (A) Representation of the experimental design to analyze provirus integration or multiply spliced transcripts in productive or latently infected cells from three different healthy donors. CD4+ T cells were activated with IL-2 and α-CD3/CD28 antibody-coated beads for 3 days prior to infection with pMorpheus-V5. CD4+ T cells were infected with pMorpheus-V5 in the presence and absence of raltegravir. Latently (orange), productively (green), and the reporter negative cell populations were sorted using FACS 5 dpi with pMorpheus-V5. RNA and DNA were extracted from the same samples. (B) Gag p24 concentration of culture supernatants was measured using ELISA at 5 dpi. Bar graph shows the production of p24 in pMorpheus-V5 or mock-infected cells in the presence and absence of raltegravir (RAL). Each donor is identified by a specific symbol. The average of three donors is shown (±SD) (∗∗∗∗p < 0.0001, unpaired t test). (C) HIV integration was measured using a two-step quantitative Alu-PCR assay using total DNA from each sorted cell population (latent infection, yellow; productive infection, green; reporter expression-negative cells, gray). The bar graph depicts relative amounts of integrated proviruses. J-Lat 6.3 cells were used as a positive control. The mean ± SD of three independent experiments/donors are shown. Sorted cells from the same donor (N = 3) are identified by the same symbol. (D) Multiply spliced (MS) HIV transcripts were quantified using semi-nested real-time qPCR. RNA was extracted from the same samples as in (C). RNA extracted from stimulated J-Lat 6.3 cells was used as a positive control. The bar graph depicts the mean ± SD from three independent experiments/donors. Sorted cells from the same healthy donor (N = 3) are identified by the same symbol.
Figure 4
Figure 4
Characterization of latently and productively infected CD4+ T cell populations using CyTOF (A) pMorpheus-V5-infected primary human CD4+ T cells stimulated with IL-2 or activated with IL-2/α-CD3/CD28 beads were analyzed using CyTOF at 5 dpi. Latently (V5POS, NGFRPOS; yellow) or productively (HSAPOS, mCherryPOS, V5POS, NGFRPOS, p24POS; green) infected cells were identified. Data for each donor (±SD) are indicated by a specific symbol. (B) The bar graph shows the fold change of latently or productively infected cells depending on cellular activation. The average of two individual donors is shown. (C) The proportion of latently or productively infected CD4+ T cells stimulated with IL-2 for three days. The average of two individual donors is shown with the percentage and the total number of cells. (D) The proportion of latently or productively infected CD4+ T cells stimulated with IL-2 and α-CD3/CD28. The average of two individual donors is shown with the percentage and the total number of cells. (E) viSNE analysis of pMorpheus-V5-infected CD4+ T cells stimulated with IL-2 alone or with IL-2 and α-CD3/CD28. The tSNE1 and tSNE2 axes are based on the relevant markers of the subsets defined by the Cytobank program. The results are based on 66,000 cells for each condition from each donor identified by the circle and triangle symbols in (A).
Figure 5
Figure 5
Determination of latent and productive infection in different CD4+ T cell subsets (A) pMorpheus-V5-infected primary human CD4+ T cells from healthy donors stimulated with IL-2 or with IL-2 and α-CD3/CD28 were analyzed using CyTOF to determine levels of NGFR, V5, mCherry, HSA, and p24 in different CD4+ T cell subsets. The bar graphs represent percentage of latent or productive infection of each T cell subsets. The average of two individual donors is shown. Each donor is indicated by a unique symbol and each stimulated group is color coded. (B) The proportion of latent (yellow) and productive (green) infection of CD4+ T cells upon pMorpheus-V5 infection. CD4+ T cells from 2 donors were stimulated with IL-2 for 3 days. The average of two individual donors is shown. (C) CD4+ T cells were stimulated with IL2 and α-CD3/CD28 beads for 3 days and infected with pMorpheus-V5. The proportion of latently (yellow) or productively (green) infected cells is depicted. The average of two individual donors is shown.
Figure 6
Figure 6
Validation of latent and productive infection by measuring early activation markers CD69 and HLA-DR in different CD4+ T cell subsets (A) CD69/HLA-DR expression on latently and productively pMorpheus-V5-infected primary human CD4+ T cells stimulated with IL-2 was determined using CyTOF. Bar graphs represent levels of CD69 and HLA-DR in total CD4+ T cells. Each donor is indicated by a unique symbol. The infection status of each CD4+ T cell subset is color coded in the figure. The average of two individual donors is shown. (B) CD69/HLA-DR expression on latently and productively pMorpheus-V5-infected CD4+ T subsets stimulated with IL-2 was determined. The levels of CD69+/HLA-DR+ in mock-infected, reporter-negative cells, latently infected, and productively infected CD4+ T cell subsets stimulated were measured using CyTOF. The average of two individual donors is shown. (C) CD69/HLA-DR expression on latently and productively pMorpheus-V5-infected primary human CD4+ T cells stimulated with IL-2 and α-CD3/CD28 was determined using CyTOF. Bar graphs represent levels of CD69 and HLA-DR in total CD4+ T cells. Each donor is indicated by a unique symbol. Results are from two independent donors. (D) CD69/HLA-DR expression on latently and productively pMorpheus-V5-infected CD4+ T subsets stimulated with IL-2 and α-CD3/CD28. The levels of CD69/HLA-DR in mock-infected, reporter-negative cells, latently infected, and productively infected CD4+ T cell subsets were measured using CyTOF. The average of two individual donors is shown.
Figure 7
Figure 7
Investigation of immune exhaustion maker Tim-3 in latently and productively infected cells in different CD4+ T cell subsets (A) Tim-3 expression on latently and productively pMorpheus-V5-infected primary human CD4+ T cells stimulated with IL-2 was determined using CyTOF. Bar graphs represent levels of Tim-3 in total CD4+ T cells. Each donor is indicated by a unique symbol. The infection status of each CD4+ T cell subset is color coded in the figure. Results are from two independent donors. (B) IL-2 stimulated CD4+ T cells were infected with pMorpheus-V5. The levels of Tim-3POS in mock-infected, reporter-negative cells, latently infected and productively infected CD4+ T cell subsets stimulated were measured using CyTOF. The average of two individual donors is shown. (C) Tim-3 expression on latently and productively pMorpheus-V5-infected primary human CD4+ T cells stimulated with IL-2 and α-CD3/CD28 beads was determined using CyTOF. Bar graphs represent levels of Tim-3 in total CD4+ T cells. Each donor is indicated by a unique symbol. Results are from two independent donors. (D) Tim-3 expression on latently and productively pMorpheus-V5-infected CD4+ T subsets stimulated with IL-2 and α-CD3/CD28 beads was determined. The levels of Tim-3POS in mock-infected, reporter-negative cells, latently infected, and productively infected CD4+ T cell subsets were measured using CyTOF. The average of two individual donors is shown.

References

    1. Agosto L.M., Gagne M., Henderson A.J. Impact of chromatin on HIV replication. Genes. 2015;6:957–976. doi: 10.3390/genes6040957. - DOI - PMC - PubMed
    1. Agosto L.M., Herring M.B., Mothes W., Henderson A.J. HIV-1-Infected CD4+ T cells facilitate latent infection of resting CD4+ T cells through cell-cell contact. Cell Rep. 2018;24:2088–2100. doi: 10.1016/j.celrep.2018.07.079. - DOI - PubMed
    1. Amir E.a.D., Davis K.L., Tadmor M.D., Simonds E.F., Levine J.H., Bendall S.C., Shenfeld D.K., Krishnaswamy S., Nolan G.P., Pe'er D. viSNE enables visualization of high dimensional single-cell data and reveals phenotypic heterogeneity of leukemia. Nat. Biotechnol. 2013;31:545–552. doi: 10.1038/nbt.2594. - DOI - PMC - PubMed
    1. Bacchus C., Cheret A., Avettand-Fenoel V., Nembot G., Melard A., Blanc C., Lascoux-Combe C., Slama L., Allegre T., Allavena C., et al. A single HIV-1 cluster and a skewed immune homeostasis drive the early spread of HIV among resting CD4+ cell subsets within one month post-infection. PLoS One. 2013;8:e64219. doi: 10.1371/journal.pone.0064219. - DOI - PMC - PubMed
    1. Battivelli E., Dahabieh M.S., Abdel-Mohsen M., Svensson J.P., Tojal Da Silva I., Cohn L.B., Gramatica A., Deeks S., Greene W.C., Pillai S.K., Verdin E. Distinct chromatin functional states correlate with HIV latency reactivation in infected primary CD4(+) T cells. Elife. 2018;7 doi: 10.7554/elife.34655. - DOI - PMC - PubMed

Publication types