

Altered Regional Brain Glucose Metabolism in Diffuse Large B-Cell Lymphoma Patients Treated With Cyclophosphamide, Epirubicin, Vincristine, and Prednisone: An Fluorodeoxyglucose Positron Emission Tomography Study of 205 Cases
- PMID: 35784854
- PMCID: PMC9240384
- DOI: 10.3389/fnins.2022.914556
Altered Regional Brain Glucose Metabolism in Diffuse Large B-Cell Lymphoma Patients Treated With Cyclophosphamide, Epirubicin, Vincristine, and Prednisone: An Fluorodeoxyglucose Positron Emission Tomography Study of 205 Cases
Abstract
Background: A growing number of neuroimaging studies reported that chemotherapy might impair brain functions, leading to persistent cognitive alterations in a subset of cancer patients. The present study aimed to investigate the regional brain glucose metabolism differences between diffuse large B cell lymphoma (DLBCL) patients treated with cyclophosphamide, epirubicin, vincristine, and prednisone and controls using positron emission tomography with 18F-labeled fluoro-2-deoxyglucose integrated with computed tomography (18F-FDG PET/CT) scanning.
Methods: We analyzed 18F-FDG PET data from 205 right-handed subjects (for avoiding the influence of handedness factors on brain function), including 105 post-chemotherapy DLBCL patients and 100 controls. The two groups had similar average age, gender ratio, and years of education. First, we compared the regional brain glucose metabolism using a voxel-based two-sample t-test. Second, we compared the interregional correlation. Finally, we investigated the correlations between the regional brain glucose metabolism and the number of chemotherapy cycles.
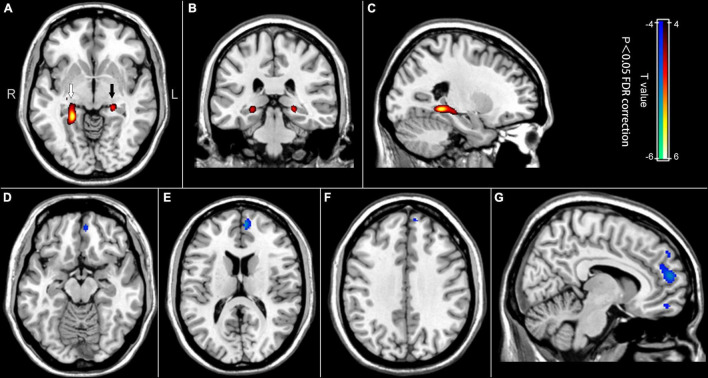
Results: Compared with the controls, the post-chemotherapy group showed higher metabolism in the right hippocampus and parahippocampal gyrus (region of interest (ROI) 1) and the left hippocampus (ROI 2), and lower metabolism in the left medial orbitofrontal gyrus (ROI 3), the left medial superior frontal gyrus (ROI 4), and the left superior frontal gyrus (ROI 5). The two groups had different interregional correlations between ROI 3 and ROI 5. In some brain regions-mainly located in the bilateral frontal gyrus-the number of chemotherapy cycles was positively correlated with the regional brain glucose metabolism. Meanwhile, in some bilateral hippocampus regions, these two parameters were negatively correlated.
Conclusion: The present study provides solid data on the regional brain glucose metabolism differences between post-chemotherapy DLBCL patients and controls. These results should improve our understanding of human brain functions alterations in post-chemotherapy DLBCL patients and suggest that 18F-FDG PET/CT scanning is a valuable neuroimaging technology for studying chemotherapy-induced brain function changes.
Keywords: 18F-FDG; PET; brain glucose metabolism; chemotherapy; diffuse large B cell lymphoma.
Copyright © 2022 Hu, Zhang, Cui and Zhang.
Conflict of interest statement
The authors declare that the research was conducted in the absence of any commercial or financial relationships that could be construed as a potential conflict of interest.
Figures


Similar articles
-
Brain glucose metabolism in diffuse large B-cell lymphoma patients as assessed with FDG-PET: impact on outcome and chemotherapy effects.Acta Radiol. 2016 Jun;57(6):733-41. doi: 10.1177/0284185115598809. Epub 2015 Aug 20. Acta Radiol. 2016. PMID: 26297729
-
Altered interregional correlations between serotonin transporter availability and cerebral glucose metabolism in schizophrenia: A high-resolution PET study using [11C]DASB and [18F]FDG.Schizophr Res. 2017 Apr;182:55-65. doi: 10.1016/j.schres.2016.10.020. Epub 2016 Oct 17. Schizophr Res. 2017. PMID: 27760700
-
Different predictive values of interim 18F-FDG PET/CT in germinal center like and non-germinal center like diffuse large B-cell lymphoma.Ann Nucl Med. 2017 Jan;31(1):1-11. doi: 10.1007/s12149-016-1123-6. Epub 2016 Sep 15. Ann Nucl Med. 2017. PMID: 27627889
-
Prognostic Importance of Bone Marrow Uptake on Baseline 18F-FDG Positron Emission Tomography in Diffuse Large B Cell Lymphoma.Cancer Biother Radiopharm. 2016 Dec;31(10):361-365. doi: 10.1089/cbr.2016.2132. Cancer Biother Radiopharm. 2016. PMID: 27996313
-
A combined study of 18F-FDG PET-CT and fMRI for assessing resting cerebral function in patients with major depressive disorder.Exp Ther Med. 2018 Sep;16(3):1873-1881. doi: 10.3892/etm.2018.6434. Epub 2018 Jul 9. Exp Ther Med. 2018. PMID: 30186413 Free PMC article.
Cited by
-
Advances of neuroimaging in chemotherapy related cognitive impairment (CRCI) of patients with breast cancer.Breast Cancer Res Treat. 2023 Aug;201(1):15-26. doi: 10.1007/s10549-023-07005-y. Epub 2023 Jun 17. Breast Cancer Res Treat. 2023. PMID: 37329458 Review.
-
Cancer- and Chemotherapy-Induced Changes in Cerebral Metabolism in Patients with Diffuse Large B-Cell Lymphoma: A Serial [18F]FDG PET Study.Cancers (Basel). 2025 Jul 2;17(13):2222. doi: 10.3390/cancers17132222. Cancers (Basel). 2025. PMID: 40647520 Free PMC article.
-
The remodeling of metabolic brain pattern in patients with extracranial diffuse large B-cell lymphoma.EJNMMI Res. 2023 Oct 30;13(1):94. doi: 10.1186/s13550-023-01046-6. EJNMMI Res. 2023. PMID: 37902852 Free PMC article.
References
-
- Baudino B., D’Agata F., Caroppo P., Castellano G., Cauda S., Manfredi M., et al. (2012). The chemotherapy long-term effect on cognitive functions and brain metabolism in lymphoma patients. Q. J. Nucl. Med. Mol. Imaging 56 559–568. - PubMed
LinkOut - more resources
Full Text Sources