

Anemia Increases Oxygen Extraction Fraction in Deep Brain Structures but Not in the Cerebral Cortex
- PMID: 35784894
- PMCID: PMC9248375
- DOI: 10.3389/fphys.2022.896006
Anemia Increases Oxygen Extraction Fraction in Deep Brain Structures but Not in the Cerebral Cortex
Abstract
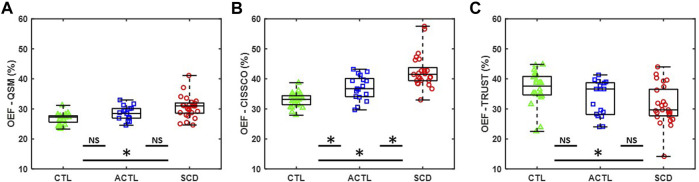
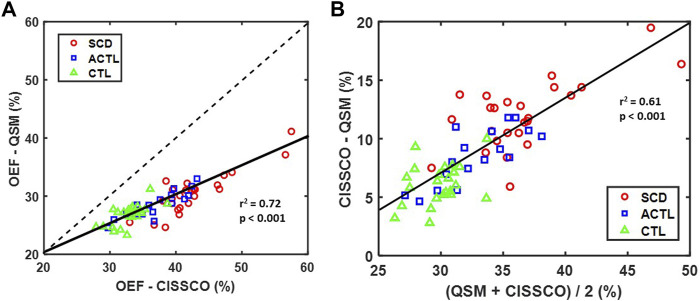
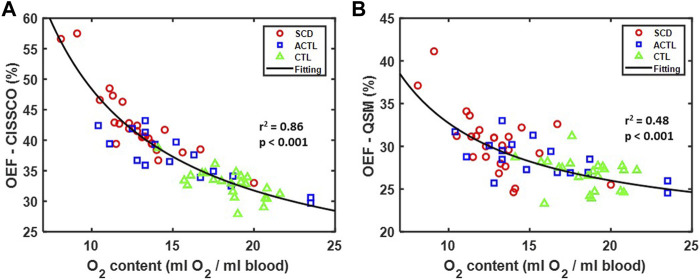
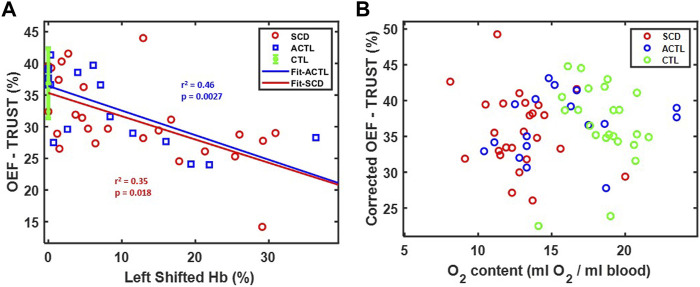
Sickle cell disease (SCD) is caused by a single amino acid mutation in hemoglobin, causing chronic anemia and neurovascular complications. However, the effects of chronic anemia on oxygen extraction fraction (OEF), especially in deep brain structures, are less well understood. Conflicting OEF values have been reported in SCD patients, but have largely attributed to different measurement techniques, faulty calibration, and different locations of measurement. Thus, in this study, we investigated the reliability and agreement of two susceptibility-based methods, quantitative susceptibility mapping (QSM) and complex image summation around a spherical or a cylindrical object (CISSCO), for OEF measurements in internal cerebral vein (ICV), reflecting oxygen saturation in deep brain structures. Both methods revealed that SCD patients and non-sickle anemia patients (ACTL) have increased OEF in ICV (42.6% ± 5.6% and 30.5% ± 3.6% in SCD by CISSCO and QSM respectively, 37.0% ± 4.1% and 28.5% ± 2.3% in ACTL) compared with controls (33.0% ± 2.3% and 26.8% ± 1.8%). OEF in ICV varied reciprocally with hematocrit (r 2 = 0.92, 0.53) and oxygen content (r 2 = 0.86, 0.53) respectively. However, an opposite relationship was observed for OEF measurements in sagittal sinus (SS) with the widely used T2-based oximetry, T2-Relaxation-Under-Spin-Tagging (TRUST), in the same cohorts (31.2% ± 6.6% in SCD, 33.3% ± 5.9% in ACTL and 36.8% ± 5.6% in CTL). Importantly, we demonstrated that hemoglobin F and other fast moving hemoglobins decreased OEF by TRUST and explained group differences in sagittal sinus OEF between anemic and control subjects. These data demonstrate that anemia causes deep brain hypoxia in anemia subjects with concomitant preservation of cortical oxygenation, as well as the key interaction of the hemoglobin dissociation curve and cortical oxygen extraction.
Keywords: CISSCO; QSM; internal cerebral vein; oxygen extraction fraction; sickle cell anemia; susceptibility; trust.
Copyright © 2022 Shen, Miao, Vu, Xu, González-Zacarías, Nederveen and Wood.
Conflict of interest statement
XM was employed by Siemens. JW is a Consultant for BluebirdBio, Celgene, Apopharma, WorldcareClinical, and BiomeInformatics. The remaining authors declare that the research was conducted in the absence of any commercial or financial relationships that could be construed as a potential conflict of interest.
Figures
Similar articles
-
Comparison of cerebral oxygen extraction fraction using ASE and TRUST methods in patients with sickle cell disease and healthy controls.J Cereb Blood Flow Metab. 2024 Aug;44(8):1404-1416. doi: 10.1177/0271678X241237072. Epub 2024 Mar 4. J Cereb Blood Flow Metab. 2024. PMID: 38436254 Free PMC article.
-
Diminished cerebral oxygen extraction and metabolic rate in sickle cell disease using T2 relaxation under spin tagging MRI.Magn Reson Med. 2018 Jul;80(1):294-303. doi: 10.1002/mrm.27015. Epub 2017 Dec 1. Magn Reson Med. 2018. PMID: 29194727 Free PMC article.
-
Brain Oxygen Extraction and Metabolism in Pediatric Patients With Sickle Cell Disease: Comparison of Four Calibration Models.Front Physiol. 2022 Feb 11;13:814979. doi: 10.3389/fphys.2022.814979. eCollection 2022. Front Physiol. 2022. PMID: 35222083 Free PMC article.
-
Differential cerebral hemometabolic responses to blood transfusions in adults and children with sickle cell anemia.J Magn Reson Imaging. 2019 Feb;49(2):466-477. doi: 10.1002/jmri.26213. Epub 2018 Oct 15. J Magn Reson Imaging. 2019. PMID: 30324698 Free PMC article.
-
Blood oxygenation level-dependent (BOLD)-based techniques for the quantification of brain hemodynamic and metabolic properties - theoretical models and experimental approaches.NMR Biomed. 2013 Aug;26(8):963-86. doi: 10.1002/nbm.2839. Epub 2012 Aug 28. NMR Biomed. 2013. PMID: 22927123 Free PMC article. Review.
Cited by
-
Relationships of Hemoglobin Concentration, Ischemic Lesions, and Clinical Outcomes in Patients With Intracerebral Hemorrhage.Stroke. 2023 Apr;54(4):1021-1029. doi: 10.1161/STROKEAHA.122.041410. Epub 2023 Feb 13. Stroke. 2023. PMID: 36779340 Free PMC article.
-
Brain BOLD and NIRS response to hyperoxic challenge in sickle cell disease and chronic anemias.Magn Reson Imaging. 2023 Jul;100:26-35. doi: 10.1016/j.mri.2023.03.002. Epub 2023 Mar 14. Magn Reson Imaging. 2023. PMID: 36924810 Free PMC article.
-
Anemia in pregnancy and sleep of 6-month-old infants: A prospective cohort study.Front Nutr. 2023 Mar 10;10:1049219. doi: 10.3389/fnut.2023.1049219. eCollection 2023. Front Nutr. 2023. PMID: 36969814 Free PMC article.
-
Oxygen extraction fraction change in M1-M6 brain regions of patients with unilateral or bilateral middle cerebral artery occlusion.J Cereb Blood Flow Metab. 2025 Feb;45(2):319-327. doi: 10.1177/0271678X241276386. Epub 2024 Aug 20. J Cereb Blood Flow Metab. 2025. PMID: 39161251 Free PMC article.
-
Comparison of cerebral oxygen extraction fraction using ASE and TRUST methods in patients with sickle cell disease and healthy controls.J Cereb Blood Flow Metab. 2024 Aug;44(8):1404-1416. doi: 10.1177/0271678X241237072. Epub 2024 Mar 4. J Cereb Blood Flow Metab. 2024. PMID: 38436254 Free PMC article.
References
Grants and funding
LinkOut - more resources
Full Text Sources